


Serviços Personalizados
Journal
Artigo
 Inglês (pdf)
 Artigo em XML
 Referências do artigo
 Enviar este artigo por email
Indicadores
-
 Citado por SciELO
 -
 Acessos
Links relacionados
-
 Similares em
SciELO
Similares em
SciELO
Compartilhar

 Permalink
Portuguese Journal of Public Health
versão impressa ISSN 2504-3137versão On-line ISSN 2504-3145
Port J Public Health vol.37 no.1 Lisboa 2019
https://doi.org/10.1159/000500119
RESEARCH ARTICLE
Multimorbidity and Disease Severity by Age Groups, in Inpatients: Cross-Sectional Study
Multimorbilidade e gravidade da doença por grupos etários, em pacientes internados: estudo transversal
Paula Broeiro-Gonçalvesa Paulo Nogueira b Pedro Aguiar c
a Faculty of Medicine of Lisbon, University of Lisbon, Lisbon, Portugal
b Information and Analysis Department, DGS, ISAMB, Institute of Environmental Health, Faculty of Medicine of Lisbon, University of Lisbon, Lisbon, Portugal
c Public Health Research Centre, NOVA University of Lisbon, Lisbon, Portugal
ABSTRACT
Introduction: Multimorbidity (MM) by age groups curves behaviour and its relationship with disease severity are not well established. Considering the Charlson Index as a prognosis instrument to measure disease severity, the objectives were to characterise the MM and its severity through the Charlson index in Portuguese inpatients. - Methods: A cross-sectional, descriptive study with an analytical component was drawn through data exported from the hospitalisations Homogeneous Diagnostic Groups database of the Portuguese-NHS during the year 2015. The study included 22 chronic health conditions: the 15 predicted in the Charlson index and 7 more (hypertension, obesity, dyslipidaemia, osteoarthritis, osteoporosis, anxiety and depression). The bi and multivariable analyses were performed through the generalised linear model considering binary logistic regression. In the analysis, the IBM SPSS version 24.0 tool was used. - Results: A total of 800,376 hospitalisations were analysed, from which 42% (336,398) corresponds to males and 58% (463,978) to females. The average age of the sample was 59.8 years, being higher in men (62.34 years) than in women (57.95 years). The mean number of diagnostics per person was 1.6, being greater in men (1.8). Disease severity was also higher in males. The greatest disease severity (Charlson >5) occurred at middle-aged (between 55 and 74 years). Throughout life behaviour of the average number of conditions and the average Charlson index without adjustment for age is similar. By the weight attributed to age, the Charlson index age-adjusted shows a sharper tendency of elevation after the forty years. The distribution by age groups of the age-adjusted Charlson index, categorised according to the cut-offs defined in the methodology (cut-off 0 to <5; cut-off 5 to <9; cut-off ≥9), showed an abrupt growth for the cut-off ≥9 at 55/59 years, peaking at 75/79 years, while for cut-off 5 at <9 the most marked growth occurs at 65/69 and the peak about 5 years later than for the cut-off ≥9. After the 90 years old all measures averages (MM and severity disease) suffer a decline. - Discussion: The results suggest that the greatest disease severity are male associated and occurred at middle ages. There was an association between any MM measure and the Charlson index. The MM curves behaviour showed a decline in nonagenary age, suggesting healthy people live longer. Questioned if the MM and its severity is not a middle age health issue. As limitations, we identified its cross-sectional design and the omission of socioeconomic information and the use of the same medical conditions to measure MM and disease severity. Other studies and analysis models should explore the complexity of the MM phenomenon and its impact on long life.
Keywords: Multimorbidity · Comorbidity · Disease burden · Disease severity
RESUMO
Introdução: A relação entre magnitude e gravidade da multimorbilidade, por grupos etários, não está bem estabelecida. Considerando o índice de Charlson como um instrumento de prognóstico para medir a gravidade da multimorbilidade, os objetivos foram caracterizar a magnitude e gravidade da multimorbilidade em pacientes internados em Portugal. Métodos: Estudo transversal, descritivo, com um componente analítico, elaborado a partir de dados exportados da base de dados de Grupos de Diagnósticos Homogéneos de internamentos hospitalares do SNS durante o ano de 2015. O estudo incluiu 22 condições crónicas de saúde: as 15 previstas no índice de Charlson e mais sete (hipertensão, obesidade, dislipidemia, osteoartrose, osteoporose, ansiedade e depressão). A análise bi e multivariada foi realizada através do modelo linear generalizado, considerando a regressão logística binária. Na análise, foi usada a ferramenta IBM SPSS versão 24.0. Resultados: Foram analisadas 800'376 internamentos, das quais 42% (336'398) correspondem a homens. A idade média da amostra foi de 59,8 anos, sendo superior nos homens (62,34 anos) em relação às mulheres (57,95 anos). O número médio de diagnósticos por pessoa foi de 1,6, sendo maior nos homens (1,8). A gravidade da doença também foi maior no sexo masculino. A maior gravidade da doença (Charlson > 5) ocorreu na meia- idade (entre 55 e 74 anos). Por grupos etários, o comportamento do número médio de condições e do índice médio de Charlson sem ajuste para a idade é semelhante. Pelo peso atribuído à idade, o índice de Charlson ajustado à idade mostra uma tendência mais acentuada de elevação após os quarenta anos. A distribuição por faixa etária do índice de Charlson ajustado à idade, categorizada de acordo com os pontos de corte definidos na metodologia (ponto de corte 0 a <5; ponto de corte 5 a <9; ponto de corte =9), mostrou crescimento abrupto para o ponto de corte =9 aos 55/59 anos, com um pico aos 75/79 anos, enquanto para o ponto de corte 5 aos < 9 o crescimento mais acentuado ocorre aos 65/69 e o pico cerca de 5 anos mais tarde do que para o ponto de corte =9. Após os 90 anos, todas as médias das medidas de multimorbilidade (magnitude e gravidade) sofrem um declínio. Discussão: Os resultados sugerem que a maior gravidade da doença está associada ao sexo masculino e ocorreu na meiaidade. Houve associação entre qualquer medida de multimorbilidade e o índice de Charlson. O comportamento das curvas de multimorbilidade mostrou um declínio nos nonagenários, sugerindo que as pessoas saudáveis vivem mais tempo. Questionando-se se a gravidade da multimorbilidade não é um problema de meia-idade. Como limitações, identificou-se o delineamento transversal e a omissão de informações socioeconómicas, o uso das mesmas condições médicas para medir a magnitude e a gravidade da multimorbilidade. Outros estudos e modelos de análise devem explorar a complexidade do fenomeno da multimorbilidade e seu impacto ao longo da vida.
Palavras Chave: Multimorbilidade · Comorbilidade · Carga de doença · Gravidade da doença
INTRODUCTION
The multimorbidity (MM) prevalence estimates are influenced by their operational definition (2 or more problems) and by the number of diagnoses defined [1 ,2 ]. When considering a smaller number of diagnoses (5 diagnoses), a lower prevalence value is reported (0.3% at age 32.5 years and 3.5% at 75 years) regardless of the sample size 2 . Conversely, when more diagnoses are considered, a higher prevalence is reported, which gives consistency to the statement: differences in prevalence estimates are by the number of chronic diseases considered 2. The frequency of MM, as reported, varies according to the measure considered: 43.7% for 2 or more diagnoses (MM2 +), 27.4% (MM3 +), 14.7%, 7% (MM5 +) and 2.8% for 6 or more coexisting diagnoses (MM6 +) 3. Finally, the MM prevalence curve estimates, by age, have different behaviours according to definitions 2 or more (MM2 +) and 3 or more (MM3 +) chronic diseases. MM2 + increases rapidly until the age group 70–79 years and remains stable in the older age groups. MM3 + increases later (between 30–39 and 40–49 years old) with plateau up to 80–89 years 3. According to the meta-analysis of Violan et al. 4, there is MM association with age and gender, despite the latter not be consistent.
In a Portuguese study, carried out in the primary health-care context, in the adult population, nine out of 10 participants (87.0%) had at least one chronic health problem, with a general average of 3.4 (3.6 men, 3.3 in women) 5. The MM measured as MM2 + was present in 72.7% of the sample and if the measure was MM3 + was 57.2% 5. There was a significant ( p < 0.05) association between MM and: male gender, age, living in rural areas, living alone, having low social status (schooling and income) 5. Which confirms the results of other studies, which showed an association between MM and lower social gradients [4 - 6 ].
Indexes were developed based on the number and the medical conditions severity, resulting in an added value. Of these, the Charlson index is one of the most widely used [7] and considered the most potent 1. The Charlson index was developed based on the relative risk of death. The disease severity is measured by the morbidities impact on the overall morbidity (e.g., weighting of 6 for solid metastatic tumour, 2 for diabetes with complications) [9 ,10 ].
The Charlson index allows us to measure comorbidity (e.g., index of 3 or more points means severe comorbidity) and predict mortality (e.g., index of 5 or more points is a predictor of death at 3 years in 85% of patients) 9. The Charlson index can, therefore, be considered a prognostic health instrument for measuring the disease severity [10 - 13 ]. With advances in medicine and increased survival rates, health problems such as coronary heart disease, uncomplicated diabetes, or cerebrovascular disease were not associated with mortality 10. However, the confirming change in prognosis did not justify any change in the Charlson index 10.
MM still seems to condition life expectancy 7. In an outpatient retrospective cohort of MEDICARE beneficiaries between 2007 and 2008, a 67-year-old individual with no chronic conditions is expected to live on average 22.6 more years, while the presence of 5 chronic diseases removes 7.7 years in the average expected life. The median decline in life expectancy was 1.8 years for each additional chronic condition – ranging from 0.4 years less for the first condition to 2.6 years less for the sixth diagnosis 7.
A study has compared MM pattern by age in a 9-year retrospective cohort of inpatients discharged. The middle-aged discharged in-patients with MM are admitted more often than olders and have similar total hospitalized days per year 14. The Charlson Index is a prognostic tool that can measure disease severity [10 - 13 ]. It is important to know if there is an association between both (MM and severity of disease) considering the diagnoses and age group.
In this study, it was defined as objective to know the inpatients MM in the Portuguese NHS hospitals. An additional aim was to assess the behaviour of the curves by age groups, through the count (magnitude) and Charlson index score (severity).
Methods
A cross-sectional, descriptive study with analytical component was drawn from data exported from the Homogeneous Diagnostic Groups (GDH) database.
GDH is a Portuguese classification system of admission patients in acute hospitals. That aggregate patients into clinically coherent and similar groups from resource consumption. It allows defining operationally the hospital products, which are the set of goods, and services that each patient receives according to their needs and the pathology that led to their hospitalisation. It allows identifying the diagnoses by admission episode and per patient.
The Charlson index has been widely used in health outcome studies to allow valid comparisons and adjustment to risk. Risk adjustment is a complex construction involving patient sociodemographic factors (e.g., age), acute clinical stability, or disease severity and was created as an indicator of illness severity [15 ,16 ]. There has been growing interest in the use of databases to study, and the Charlson index applied to administrative data coded according to 9th version of the International Classification of Diseases (ICD-9) 16.
In order to determine the disease severity through the Charlson index, the 15 identified diagnoses there (diabetes and hepatic insufficiency have 2 levels of severity) to which were added the most prevalent problems (hypertension, obesity, dyslipidaemia, osteoarthritis, osteoporosis, anxiety and depression) [5 ,17 ] making a total of 22 diagnoses (Fig. 2 ). After defining the diagnoses to be analysed, the respective codes were identified in the ICD-9, the classification used in the GDH (Table 1 ).
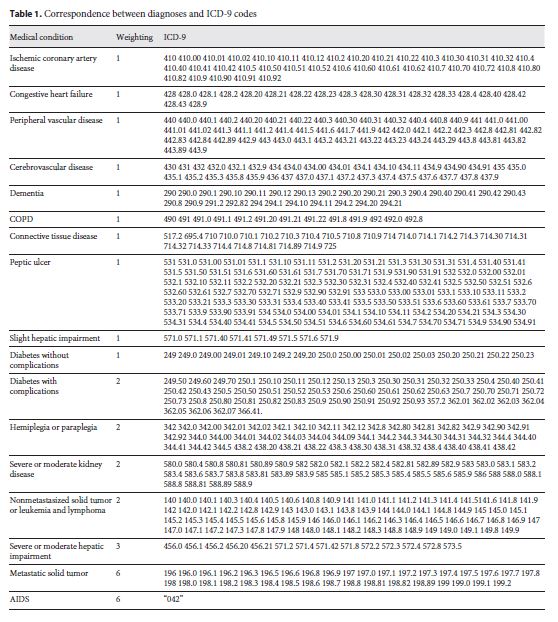
From the GDH database corresponding to hospitalisation episodes, during the year 2015, sociodemographic data (age and sex) and the 22 diagnoses according to CID9 codes (Table 1 ) were extracted for each episode.
The data were exported to an excel matrix and later to the IBM SPSS statistical tool version 24.0 for the Mac OS operating system, which supported the data analysis.
From the exported data, the paediatric population (0 to <18 years) was withdrawn. Given that a patient may have 1 or more admissions in 1 year, from the adult population (aged 18 or over) duplicates were removed. About the duplicates, the considered episode was the last.
The 22 diagnoses had binary corresponding, the value 1 to the condition presence and 0 to the absence. The number of problems per person corresponded to the sum of the medical conditions present. MM was determined according to the definitions of coexistence of 2 or more diagnoses (MM2 +) up to eight or more (MM8 +).
The Charlson cumulative index was calculated considering the weight attributed to the diagnoses in the scale (Table 1 ). This index provides for adjustment for age by a weighting: 1 for group 40 at <50 years; 2 for those aged 50 to <60 years; 3 to that of 60 to <70; and 4 to that of 70 and over.
The descriptive analysis took into account the age, the number of problems per person and the Charlson index as numerical variables. Quantitative variables were categorised to facilitate analysis:
1. Age groups: young adults, adults, pre-retirement adults, retired seniors and oldest, or at 5-year intervals from 20 years to 95, or 10-year intervals from 35 onwards.
2. Total problems per person: according to the definitions of MM, 2 or more problems per person (MM2 +) up to eight or more (MM8 +).
3. Charlson index by severity: (cut-off 0 to <5; cut-off 5 to <9; cut-off ≥9) if calculated with adjustment for age or (cut-off <5; cut-off ≥5) without age adjustment.
The binary nature of the variables permits, the bi and multivariate analyses using the generalised linear model considering binary logistic regression.
Ethical Requirements
The GDH database, with encrypted personal identification data, is made available to ENSP students upon request for superior permission and confidentiality commitment.
The study protocol was submitted to the ARSLVT Ethics Committee for Health, which obtained a favourable opinion.
Results
From the GDH database, 1,026,317 episodes were exported, of which 136,574 corresponded to episodes referring to the paediatric population (0 to <18 years). Episodes attributable to adults were 889,743 of which duplicates were removed, with the aim of each person corresponding to an episode (the latter) as referred to in the methodology. About 10% of the episodes were removed for duplication, considering 800,382 episodes for analysis and 6 missing for sex were excluded. For this reason, 800,376 cases were analysed, corresponding 42% (336,398) to males and 58% (463,978) females. The average age of the sample was 59.8 years, being higher in the men sex (62.34 years, being 57.95 for the women sex).
To better understand the distribution, by age group and sex, of individuals who had at least 1 hospital stay in a public hospital during the year 2015, the data were summarised in Table 2 .
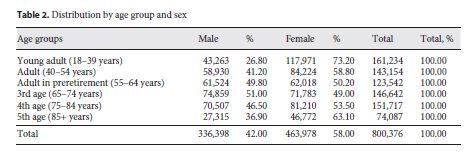
As can be observed, there is a predominance of females in all ages, except for the group designated as the third age group (aged 65–74), in which 51% were males.
The mean number of problems per patient was 1.6 higher in men (1.8) than in women, which was 1.44. The severity of disease through the Charlson index was also higher in men (1.11), while for women it was 0.74 and in the sample was 0.90.
Multivariate analysis of the diagnoses associated with greater disease severity (Charlson ≥5) as a dependent variable was performed. All diagnoses were gender, age and the number of problems per person adjusted. As can be seen in Table 3,the number of conditions per patient was the highest predictor of disease severity followed by dementia, diabetes, COPD and heart failure in descending order of OR value.
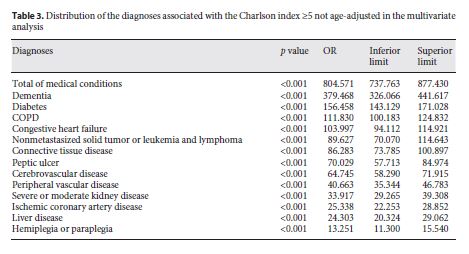
The female sex appears to have a protective effect ( p < 0.001; OR 0.807 [0.773–0.842]) and the age risk effect ( p < 0.001; OR 1.713 [1.703–1.724]).
In the sex-adjusted bivariate analysis by age group (every 10 years from the age of 35), the diagnoses associated with age ( p < 0.001) were as follows:
Anxiety, liver disease and non-metastatic oncologic disease in the adulthood ages (45–54 and 55–64 years old).
Depression, obesity and metastatic oncologic disease with the higher OR in the transition age from adulthood to old persons (55–64 and 65–74 years old).
Heart failure, renal failure and dementia OR increasing from 65 years of age onwards until the more advanced ages (≥95 years old).
High blood pressure, ischemic coronary disease and osteoarthritis associated with all age groups since 55 years old.
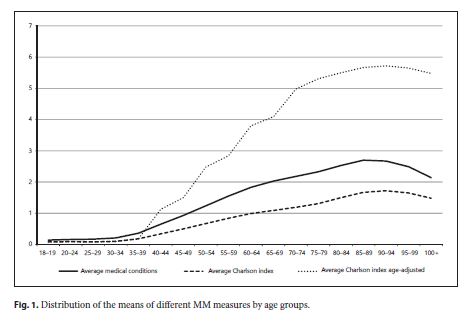
To better understand the behaviour of MM and severity of disease throughout life, the mean number of problems and the Charlson index with and without adjustment for age were distributed in the adult population at intervals of 5 years from 20 years (Fig. 2 ).
As can be seen in Figure 1,the throughout life behaviour of the average number of conditions and the average Charlson index without adjustment for age are similar. The conditions curve is slightly higher than the Charlson index average. Both averages begin to rise to 40 years reaching the highest value at age 90, the age from which a decline is projected. By the weight attributed to age (1 to group 40 to <50 years, 2 for 50 to <60 years, 3 for 60 to <70 and 4 for that of 70 and over), the Charlson index age-adjusted shows more sharply the tendency of elevation after the forty years.
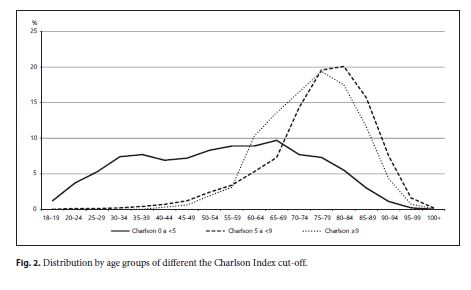
The distribution by age groups of the age-adjusted Charlson index, categorised according to the cut-offs defined in the methodology (cut-off 0 to <5; cut-off 5 to <9; cut-off ≥9) was represented in Figure 2 . Interestingly, for the cut-off ≥9, abrupt growth appears at 55/59 years, peaking at 75/79 years, while for cut-off 5 at <9, the most marked growth occurs at 65/69 And the peak about 5 years later than for the cut-off ≥9. For the lower cut-off <5, the decline occurs at 65/69 years.
When analysing the categories of the Charlson index by sex, it was verified that the severity was associated with the male sex: cut-off 5 to <9 ( p < 0.001; OR 1.382 [1.368–1.3897]) and cut-off ≥9 ( p < 0.001; OR 1.802 [1.766–1.838]).
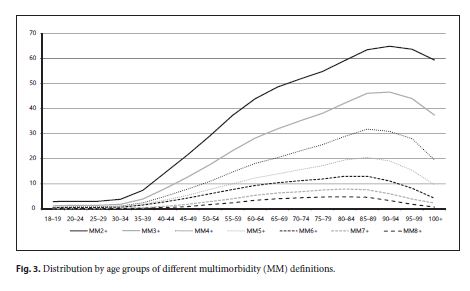
The MM (Fig. 3 ) analysis was performed for different definitions (between 2 or more problems per person [MM2 +] to 8 [MM8 +]), which reveals a frequency decline in all age groups when progressing from MM2 + to MM8 +: 41.9% (MM2 +), 28.0% (MM3 +), 18.4% (MM4 +), 12.4%, 8.8% (MM6 +), 5.0% (MM7 +) and 3.1% (MM8 +). If we observe the curves of the different measures of MM, we can see that they increase up to 90 years (64.9% for MM2 + and 46.6% for MM3 +) and up to 85 for the rest (from MM4 + to MM8 +). In the older ones, there is a decline in all different MM measures.
The 2 definitions of MM (MM2 + and MM3 +) were associated with male (OR 1.391 and 1.359, respectively) and age (OR 1.056 and 1.052, respectively).
Discussion
The relevant results are similar curve behaviour, by age groups, between the mean number of conditions and the mean age-adjusted Charlson index, with a curve with the onset of growth from the age of 40 years. When the age-adjusted Charlson index was categorised for different cut-offs, there appeared to be 2 severity curves with 10-year onset elevation. One starting at age 55 for cut-off ≥9 and another at 65 years for that of 5 to <9, as well as a peak with 5 years difference (at 75 and 80 years, respectively; Fig. 2 ). It, therefore, seems to suggest that the highest disease severity occurs at middle age group (55–79 years). What can justify a study the middle-aged discharged in-patients with MM are admitted more often than olders and have similar total hospitalized days per year found in a Korean study 14.
The frequency of MM varied according to the measurement considered 41.9% (MM2 +), 28.0% (MM3 +), 18.4% (MM4 +), 12.4% (MM5 +), 8.8%, 5.0% (MM7 +) and 3.1% (MM8 +). Although our results correspond to hospitalisation data, these are comparable with those of Harrison et al. 3. However, concerning a study carried out in Portugal on primary health care, our frequencies were lower [5] probably because they were hospitalisation data.
Both of the MM definitions (MM2 + and MM3 +) were associated with age and males as in the Portuguese study [5] as opposed to a systematic review of Violan et al. 4. It is questioned whether the association with the male gender has to do with the data source associated with severity (hospitalisation data), the paradox of using services related to sex or even the Portuguese population characteristics.
The lifetime frequency curves (Fig. 3 ) for different definitions (from MM2 + to MM8 +) revealed a frequency decline in all age groups when progressing from MM2 + to MM8 + and elevation between 40 and 90 years for MM2 + (64.9%) and MM3 + (46.6%). For the remaining definitions (from MM4 + to MM8 +), the increase occurred until the age of 85 years. Although not entirely similar, the results confirm the different behaviour of the MM prevalence curves throughout the life 3.
One of the highlights of the results of our study was the discrimination of the age groups after 75 years, which allowed analysing the nonagenarian population and the decline in the average conditions number and disease severity. The MM and its severity appear to be associated with the middle age groups, from 55 to 79 years. That seems to confirm that those who lives longer than after 90 years have lower MM. Generating controversy about the MM definition, particularly, for the oldest group.
Limited by the cross-sectional design of the study, we still wondered if this group would not be equivalent to the healthy group of the DuGoff EH study 7. Would correspond to those without chronic conditions who lived on average 22.6 years [7] or even the permanently healthy group of the study by Chang et al. 18.
The validity of the results of our study may derive from the robustness conferred by the sample size, the significance of the results, the accuracy of the diagnoses and their clinical coherence previously mentioned. The use of medical records classified according to the ICD is another aspect that contributed to the reproducibility and external validation of the results and comparability of morbidity between the different contexts 7.
Our study contemplated 22 chronic health conditions, including all, the most frequently studied 19, such as diabetes, osteoarthritis, hypertension or cancer, by the 12 minimum number of medical conditions for MM studies suggested in the literature 19. The generalised linear model analysis model and the use of the Charlson index were other methodological strategies that make our research reproducible.
The identified study limitations were its cross-sectional design and the hospitalisation nature and provenance of the data. In the literature, MM is consistently associated with the socioeconomic information such as schooling, income or social network, which was missing [4 ,6 ,20 ]. High educational level, healthy lifestyle, good social network and practicing leisure activities have proved to be protective, that is, they attenuate the effect of MM [21] and consistent with the well-controlled MM class of Chang’s study 18. However, future research such as longitudinal study studies associating the number and nature of medical conditions and Charlson index over time in different contexts (inpatient, primary health care and general population) is in prospect. Other studies and models of analysis should explore the complexity of the MM phenomenon (social, mental and physical) and clarify the current simple and seemingly inadequate definition 7.
The most relevant considered limitation of our research is to use the same medical conditions in both MM and severity measures (Charlson index).
The better knowledge of the MM phenomenon and its impact on hope and quality of life should also be studied 12. As well as the most successful interventions, in particular, the paradigm shifts from a traditional disease-oriented approach to a holistic patient centred on the and oriented towards the improvement of functional capacities and quality of life [7 ,12 ].
REFERENCES
1 Stewart M, Fortin M, Britt HC, Harrison CM, Maddocks HL. Comparisons of multi-morbidity in family practice—issues and biases. Fam Pract. 2013 Aug; 30(4): 473–80.
2 Fortin M, Stewart M, Poitras ME, Almirall J, Maddocks H. A systematic review of prevalence studies on multimorbidity: toward a more uniform methodology. Ann Fam Med. 2012 Mar-Apr; 10(2): 142–51.
3 Harrison C, Britt H, Miller G, Henderson J. Examining different measures of multimorbidity, using a large prospective cross-sectional study in Australian general practice. BMJ Open. 2014 Jul; 4(7):e004694. [ Links ]
4 Violan C, Foguet-Boreu Q, Flores-Mateo G, Salisbury C, Blom J, Freitag M, et al. Prevalence, determinants and patterns of multimorbidity in primary care: a systematic review of observational studies. PLoS One. 2014 Jul; 9(7):e102149. [ Links ]
5 Prazeres F, Santiago L. Prevalence of multimorbidity in the adult population attending primary care in Portugal: a cross-sectional study. BMJ Open. 2015 Sep; 5(9):e009287. [ Links ]
6 Barnett K, Mercer SW, Norbury M, Watt G, Wyke S, Guthrie B. Epidemiology of multimorbidity and implications for health care, research, and medical education: a cross-sectional study. Lancet. 2012 Jul; 380(9836): 37– 43.
7 DuGoff EH, Canudas-Romo V, Buttorff C, Leff B, Anderson GF. Multiple chronic conditions and life expectancy: a life table analysis. Med Care. 2014 Aug; 52(8): 688–94.
8 Brilleman SL, Salisbury C. Comparing measures of multimorbidity to predict outcomes in primary care: a cross sectional study. Fam Pract. 2013 Apr; 30(2): 172–8.
9 de Groot V, Beckerman H, Lankhorst GJ, Bouter LM. How to measure comorbidity. a critical review of available methods. J Clin Epidemiol. 2003 Mar; 56(3): 221–9.
10 Quan H, Li B, Couris CM, Fushimi K, Graham P, Hider P, et al. Updating and validating the Charlson comorbidity index and score for risk adjustment in hospital discharge abstracts using data from 6 countries. Am J Epidemiol. 2011 Mar; 173(6): 676–82.
11 Charlson M, Szatrowski TP, Peterson J, Gold J. Validation of a combined comorbidity index. J Clin Epidemiol. 1994 Nov; 47(11): 1245–51.
12 Miles A, Asbridge JE. Multimorbidity-A manifestation of network disturbances? How to investigate? How to treat? J Eval Clin Pract. 2017 Feb; 23(1): 193–8.
13 Huntley AL, Johnson R, Purdy S, Valderas JM, Salisbury C. Measures of multimorbidity and morbidity burden for use in primary care and community settings: a systematic review and guide. Ann Fam Med. 2012 Mar-Apr; 10(2): 134–41.
14 Lai FT, Wong SY, Yip BH, Guthrie B, Mercer SW, Chung RY, et al. Multimorbidity in middle age predicts more subsequent hospital admissions than in older age: A nine-year retrospective cohort study of 121,188 discharged in-patients. Eur J Intern Med. 2019 Mar; 61: 103–11.
15 Li B, Evans D, Faris P, Dean S, Quan H. Risk adjustment performance of Charlson and Elixhauser comorbidities in ICD-9 and ICD- 10 administrative databases. BMC Health Serv Res. 2008 Jan; 8(1): 12. [ Links ]
16 Deyo RA, Cherkin DC, Ciol MA. Adapting a clinical comorbidity index for use with ICD- 9-CM administrative databases. J Clin Epidemiol. 1992 Jun; 45(6): 613–9.
17 Eurostat. Sustainable development in the European Union – 2015 monitoring report of the UE Sustainable Developmnt Strategy. 2015. p. 356.
18 Chang WC, Lu FP, Lan TY, Wu SC. Multidimensional health-transition patterns among a middle-aged and older population. Geriatr Gerontol Int. 2013 Jul; 13(3): 571–9.
19 Diederichs C, Berger K, Bartels DB. The measurement of multiple chronic diseases—a systematic review on existing multimorbidity indices. J Gerontol A Biol Sci Med Sci. 2011 Mar; 66(3): 301–11.
20 Marventano S, Ayala A, Gonzalez N, Rodríguez- Blázquez C, Garcia-Gutierrez S, Forjaz MJ. Multimorbidity and functional status in institutionalized older adults. Eur Geriatr Med. 2016; 7(1): 34–9.
21 Rizzuto D, Orsini N, Qiu C, Wang HX, Fratiglioni L. Lifestyle, social factors, and survival after age 75: population based study. BMJ. 2012 Aug 29; 345:e5568. [ Links ]
The authors have no conflicts of interest to declare.
Project without funding.

