


Serviços Personalizados
Journal
Artigo
 Inglês (pdf)
 Artigo em XML
 Referências do artigo
 Enviar este artigo por email
Indicadores
-
 Citado por SciELO
 -
 Acessos
Links relacionados
-
 Similares em
SciELO
Similares em
SciELO
Compartilhar

 Permalink
GE-Portuguese Journal of Gastroenterology
versão impressa ISSN 2341-4545
GE Port J Gastroenterol vol.26 no.4 Lisboa ago. 2019
https://doi.org/10.1159/000493351
ORIGINAL ARTICLE
Perfusion Magnetic Resonance as a Biomarker for Sorafenib-Treated Advanced Hepatocellular Carcinoma: A Pilot Study
Perfusão por Ressonância Magnética como biomarcador do carcinoma hepato-celular avançado tratado com sorafenib: avaliação preliminar
Marta Camposa, Isabel Candeláriab,c, Nickolas Papanikolaoud, Adélia Simãoa,e, Carlos Ferreiraf,g, Georgios C. Manikish, Filipe Caseiro-Alvesa,b
aFaculty of Medicine, Universidade de Coimbra, Coimbra, Portugal; bMedical Imaging Department, Centro Hospitalar e Universitário de Coimbra, Coimbra, Portugal; cLocal Healthcare Unit, Castelo Branco, Portugal; dComputational Clinical Imaging Group, Champalimaud Foundation, Lisboa, Portugal; eDepartment of Internal Medicine, Centro Hospitalar e Universitário de Coimbra, Coimbra, Portugal; fCoimbra Institute for Biomedical Imaging and Translational Research, Coimbra, Portugal; gInstitute of Nuclear Sciences Applied to Health, Universidade de Coimbra, Coimbra, Portugal; hComputational BioMedicine Laboratory, Institute of Computer Science, Foundation for Research and Technology – Hellas (FORTH), Heraklion, Greece
* Corresponding author.
ABSTRACT
Background: Sorafenib is the currently recommended therapy in patients with advanced hepatocellular carcinoma (HCC). Among the several biomarkers available for the evaluation of the therapeutic response and prognosis, there is perfusion magnetic resonance imaging (p-MRI) that, through measurement of the vascular permeability unit (ktrans), may retrieve useful information regarding the microvascular properties of focal liver lesions. The aim of this study was to evaluate the impact of sorafenib therapy in patients with advanced HCC using the p-MRI technique. Materials and Methods: In this retrospective study, 27 patients with the diagnosis of advanced HCC were included for palliative therapy using sorafenib. MRI of the liver was performed before the beginning of the oral therapy (T0), after 3 (T3), and after 6 months (T6). Dynamic acquisitions of the tumor (n = 50, during the first 2 min after contrast injection) were obtained in the coronal plane and were used to compute the parametric perfusion maps, acquiring the ktrans value using the extended Tofts pharmacokinetic model. Results: The value of ktrans obtained at T0 was significantly different from the value of ktrans obtained at T6 (p = 0.028). There were no significant differences between T0 and T3 (p = 0.115) or a correlation between ktrans at T0 and the size of the lesion (p = 0.376). The ktrans value at T0 in patients with progressionfree survival (PFS) > 6 months was not significantly different from the ktrans value in patients with PFS ≤6 months (p = 0.113). The ktrans value at T0 was not significantly different between patients who were previously submitted to chemoembolization and those who were not submitted (p = 0.587). Conclusion: In this pilot study, the ktrans value may serve as a biomarker of tumor response to antiangiogenic therapy, but only 6 months after its initiation. Clinical outcomes such as PFS were not predicted before the initiation of treatment.
Keywords: Hepatocellular carcinoma, Sorafenib, Angiogenesis, Magnetic resonance imaging perfusion, ktrans, Tumor markers
RESUMO
Introdução: O sorafenib é a terapêutica atualmente recomendada em doentes com carcinoma hepatocelular avançado. Entre os vários biomarcadores disponíveis para a avaliação da resposta terapêutica e do prognóstico, existe a perfusão por Ressonância Magnética na qual, através da unidade de permeabilidade vascular (ktrans), se obtém informação relativa às propriedades microvasculares das lesões tumorais. O objetivo deste estudo foi avaliar o impacto da terapêutica com sorafenib em doentes com carcinoma hepatocelular avançado, através da técnica de perfusão por Ressonância Magnética (p-RM). Materiais e Métodos: Neste estudo observacional retrospetivo, foram incluídos 27 doentes, com diagnóstico de carcinoma hepatocelular avançado com indicação para terapêutica paliativa com sorafenib. Foi realizado estudo de Ressonância Magnética hepática antes do início da terapêutica com sorafenib (T0), aos 3 (T3) e aos 6 meses (T6) após o seu início. As imagens adquiridas no plano coronal (n = 50, durante os primeiros 2 minutos após a injeção de contraste paramagnético) foram utilizadas para fusão dos mapas paramétricos de perfusão, obtendo-se o valor de ktrans, usando o modelo farmacocinético de Tofts. Resultados: O valor de ktrans obtido em T0 foi significativamente diferente do valor de ktrans obtido em T6 (p = 0.028). Não existiram diferenças significativas entre T0 e T3 (p = 0.115) ou correlação entre o valor de ktrans em T0 e a dimensão da lesão (p = 0.376). Associadamente, o valor de ktrans em T0 nos doentes com sobrevivência livre de progressão superior a 6 meses não foi significativamente diferente do valor de ktrans nos doentes com sobrevivência livre de progressão inferior ou igual a 6 meses (p = 0.113). O valor de ktrans em doentes com ou sem tratamento prévio por quimioembolização não mostrou diferença estatisticamente significativa (p = 0.587). Conclusão: Neste estudo inicial, o valor de ktrans pode servir como biomarcador da perfusão tumoral na resposta à terapêutica anti-angiogénica, 6 meses após o seu início. O seu valor antes do inicio do tratamento não permitiu predizer o desfecho clinico em termos de sobrevivência livre de doença nos pacientes submetidos ou não a prévia quimioembolização.
Palavras-Chave: Carcinoma hepatocelular, Angiogénese,Sorafenib, Perfusão por ressonância magnética, ktrans, Biomarcador de imagem
Introduction
Hepatocellular carcinoma (HCC) is a prevalent disease worldwide, corresponding to the sixth most frequent cancer and the second most common cause of cancer death, representing a global health problem [1–3]. In recent years, the incidence of HCC has increased, especially in developed countries [3]. Between 70 and 90% of the HCC cases occur in patients with chronic liver disease and cirrhosis [4, 5]. Most HCC patients show advanced disease at the time of diagnosis, given the scarcity of specific symptoms in the early stages, which causes a worse prognosis [2, 5–8].
Treatment options for HCC depend on the stage of the disease, and surgical resection, hepatic transplantation, ablation or chemoembolization are recommended in the early stages (stages A and B of the Barcelona Clinic for Liver Cancer [BCLC] classification) [5, 9, 10]. Patients with more advanced stages (stages C and D of the BCLC classification) have more limited and less effective therapeutic options [5, 9, 10]. In recent years, there has been a breakthrough in the knowledge of the molecular pathogenesis of HCC, which has led to the development of molecular targeted therapies such as sorafenib [4, 6, 11, 12]. This drug is a multikinase inhibitor, active against the Raf-1 serine/threonine protein-kinase proto-oncogene and the B-Raf proto-oncogene, the vascular endothelial growth factor receptor cells 1–3, platelet-derived growth factor receptor β, as well as the gene fms-related tyrosine kinase 3, RET gene, c-KIT gene, stimulating apoptosis, and inhibiting the proliferation and angiogenesis of tumor cells [4, 5, 9, 13–16]. Currently, sorafenib is recommended in advanced HCC, and its effect on increasing the median overall survival of these patients has been demonstrated in approximately 3 months [5, 9, 12–15, 17]. Sorafenib therapy is generally indicated in patients with BCLC stage B refractory to locoregional therapies or who have contraindications to its use, as well as in selected BCLC stage C patients [4, 13].
Taking into account the high cost and toxicity of this drug, it seems logical to have an early evaluation of the therapeutic response and prognosis, for which clinical, biological, molecular, and imaging biomarkers have been assessed [2, 12, 15]. From the imaging biomarkers, criteria based on the lesion size, such as the Response Evaluation Criteria in Solid Tumors (RECIST), have been validated [6]. However, antiangiogenic therapies used in HCC induce tumor necrosis, which may lead to the absence of a noticeable size change of the lesion or even its increase, resulting in inappropriate categorization and/or patient management [6, 7, 16, 18]. There has been an increasing interest in developing new techniques for the evaluation of tumor perfusion using computed tomography (CT) or Magnetic resonance imaging (MRI) [2, 11, 14]. In MRI, this technique is based on the acquisition of a dynamic contrast enhanced T1-weighted sequence with the intravenous administration of paramagnetic contrast, gathering information on the microvascular properties of tumor lesions in the form of a measurable variable, the unit of vascular permeability (ktrans) and local blood flow [11, 18, 19]. This imaging biomarker is reflecting the exchange rate of paramagnetic contrast molecules from the intravascular space to the extracellular space [19].
Considering that sorafenib may determine late changes in lesion size, the use of noninvasive methods such as perfusion MRI (p-MRI) may allow a better monitoring of the response to treatment and may assist to establish more accurate prognosis at an early stage of treatment [11, 19].
The aim of the current study was to verify if p-MRI could monitor tumor response and predict clinical outcomes in advanced HCC patients undergoing sorafenib therapy. As a secondary goal the value of p-MRI for better patient selection was evaluated regarding the antiangiogenic response to the targeted treatment.
Materials and Methods
Patient Characteristics
Patients were recruited from the multidisciplinary tumor board where the decision to proceed with antiangiogenic therapy in advanced HCC cases was taken. Patients were included between May 2013 and January 2017. The noninvasive diagnosis of HCC was established by the presence of the accepted imaging findings (wash-in/wash-out) in one or two different imaging methods (CT and MRI) or through histological characterization. All patients met the following inclusion criteria: age > 18 years; Child Pugh A or B; Eastern Oncology Cooperative Group (ECOG) 0 or 1; HCC with unresectability criteria on CT or MRI; and/or HCC refractory to locoregional therapies (chemoembolization or radiofrequency thermoablation). The exclusion criteria included severe nephropathy or chronic renal failure (glomerular filtration rate < 30 mL/min) or any other absolute contraindication to the use of paramagnetic contrast or MRI. From the group of 35 patients with advanced HCC who fulfilled the inclusion criteria, 27 patients were selected to receive sorafenib and were thus included in the present study.
The values of aspartate aminotransferase, alanine aminotransferase, alpha-fetoprotein, alkaline phosphatase, gamma-glutamyl transferase, lactate dehydrogenase, and bilirubin were determined before the initiation of therapy with sorafenib and, serially, during treatment. All patients were treated with sorafenib at the dose of 400 mg, twice daily, per os. The presence of adverse reactions, such as anorexia, fatigue, diarrhea or dermatological lesions (hand-foot syndrome or palmar-plantar erythrodysesthesia, exanthema, or xerostomia) were monitored. In patients who presented adverse reactions, the dose was reduced to half-dose of 200 mg, twice daily, and in refractory cases, the drug was suspended.
his study was approved by the Ethics Committee of the Hospital and University Center of Coimbra (CHUC).
MRI Technique
MRI was performed on a 3-Tesla scanner (Magnetom Trio; Siemens Medical Systems, Erlangen, Germany), using a phased-array multi-channel coil. Patients underwent liver MRI prior to the initiation of therapy (T0), at 3 (T3), and at 6 months (T6) after the initiation of therapy. A bolus of gadobutrol (Gd-DO3A-butrol) at a dose of 0.1ml/kg was administered at a flow rate of 3 ml/s followed by the administration of 20 mL of saline solution. Both were administered intravenously using an automatic power injector.
For the dynamic study, image acquisition was performed during the first 2 min after the paramagnetic contrast injection, with 50 repetitions, providing a temporal resolution of 2 s, through a 3D gradient echo volumetric interpolated breath-hold examination sequence. The complete parameters of the acquisition protocol are shown in (Table 1).
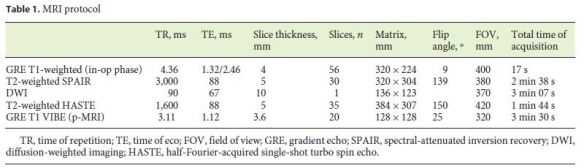
Image Processing and Analysis
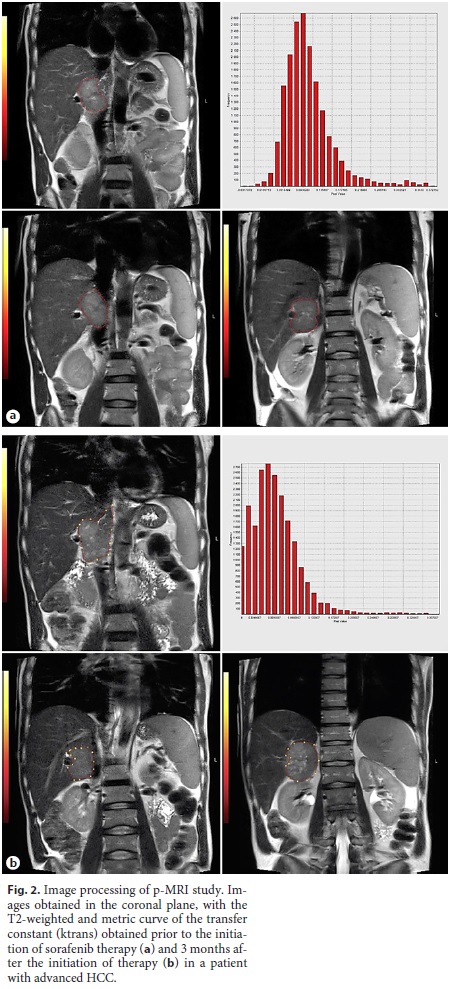
For anatomical reference, the T2-weighted images obtained in the coronal plane, were fused with the parametric perfusion maps obtained through the NordicICE software (Nordic NeuroLabs, Bergen, Sweden) using the extended Tofts pharmacokinetic model. A single observer traced the regions of interest, incorporating the total volume of the lesion into the fusion images. Correction of motion artifacts was performed, as well as the temporal smoothing of the time intensity curves in the dynamic sequences to reduce motion-related spikes. Quantitative perfusion analysis was performed using T1 maps, generated with four different flip angles (2°, 5°, 10° and 15°), and the kinetic curves were determined using the Tofts model, both of which are included in the perfusion module existing in the previously mentioned software. The arterial input function was determined from the flow in the abdominal aorta, and the parametric variable (ktrans) was extracted from the kinetic model. For each patient, the morphological characteristics of the lesions, signal intensity, tumor enhancement, and perfusion were evaluated, and the histograms and corresponding parametric maps were elaborated.
Statistical Analysis
Statistical analysis was performed using IBM SPSS software, version 24.0. For all variables considered, a descriptive statistical analysis was performed. For the comparison between the value of ktrans at T0, T3, and T6, the Friedman test was applied. We used the signal test to compare the value of ktrans at T0 and T3. To evaluate the correlation between the lesion size and the ktrans value, at T0, the Spearman correlation coefficient was applied. To compare the value of ktrans obtained at T0 in patients who had a progression-free survival (PFS) > 6 months or ≤6 months, the Mann-Whitney U test was used. The same test was applied to compare the ktrans value at T0 in patients already submitted or not submitted to chemoembolization. A p value < 0.05 was considered indicative of statistical significance.
Results
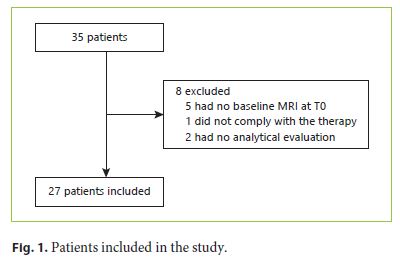
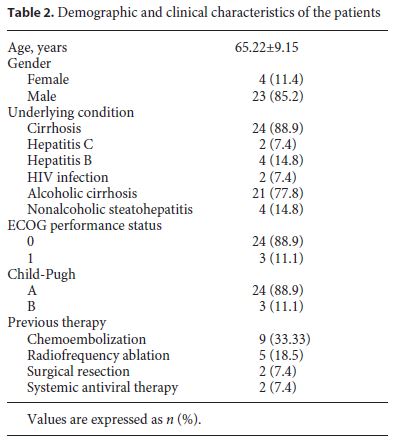
Initially, 35 patients with advanced HCC were selected, but 8 patients were excluded due to the absence of hepatic MRI at T0, noncompliance with the therapy, or absence of analytical evaluation (Fig. 1). A total of 27 patients were included in the study, 4 females (11.4%) and 23 males (85.2%). The mean age was 65.22 ± 9.15 years, with ages ranging from 48 to 84 years (63 ± 7.35 in females and 65.61 ± 9.51 in males) (Table 2). Of these 27 patients, only 20 performed hepatic MRI at T3 and only 6 performed hepatic MRI at T6; the last patient deceased during follow-up. The clinical data and patient characteristics are summarized in Table 2.
Of the 6 patients (22.22%) who performed hepatic p-MRI at T0, T3, and T6, a median ktrans value of 0.475 min–1, 0.205 min–1, and 0.105 min–1, respectively, was obtained. A statistically significant difference was found between the value of ktrans obtained at T0 and T6 (p = 0.028) with α = 0.05.
Of the 20 patients (74.07%) who underwent hepatic MRI only at T0 and T3, the median value of ktrans at T0 and T3 was 0.255 min–1 and 0.195 min–1, respectively (p = 0.115), without a statistically significant difference for α = 0.05. An example of the images, parametric maps, and metric curves of ktrans obtained after the perfusion study is presented in Figure 2.
The ktrans value obtained at T0 for each patient of the study group was not significantly different, showing a Spearman correlation coefficient of –0.178, (p = 0.376) for α = 0.05.
Considering PFS, 12 patients (44.4%) had a survival rate > 6 months and 9 patients (33.3%) a survival of ≤6 months; this parameter could not be applied in 6 patients (22.2%). The median value of ktrans at T0 in patients with PFS > 6 months was 0.255 min–1 compared to 0.45 min–1 in patients with PFS ≤6 months. Despite the fact that patients with a PFS > 6 months revealed a higher median ktrans at T0, the difference was not statistically significant (p = 0.113) for α = 0.05.
Of the total number of patients considered, 9 (33.33%) were previously submitted to chemoembolization, and the median value of ktrans in T0 was 0.29 min–1, compared to 0.27 min–1 in the 18 patients (66.66%) who did not undergo chemoembolization. Although the median value of ktrans was slightly different between the 2 groups, it did not reach a significant difference (p = 0.587), for α = 0.05.
Nine patients (33.3%) complained of fatigue, 6 (22.2%) had diarrhea, 5 (18.5%) had anorexia, 3 patients (11.1%) developed xeroderma, 2 patients (7.4%) hand-foot syndrome, rash or alopecia, and 1 patient (3.7%) had xerostomia, nausea, abdominal pain, anemia, dysphonia, or pruritus. Despite the high number of adverse reactions, 24 patients (88.9%) maintained the recommended dose of sorafenib (400 mg, twice daily), and the dose was halved to 200 mg twice daily only in 3 patients (11.1%). Sorafenib was not suspended in any patient.
Discussion
The RECIST criteria are widely accepted for the evaluation of the therapeutic response in several cancer clinical trials, given its ease of use and reproducibility [6, 20, 21]. However, new antiangiogenic therapies may not induce tumor size reduction, which makes it difficult to evaluate the pharmacological response [6, 20, 22]. The mRECIST criteria have been applied to overcome this limitation, but its measurements are subjective and not always easy to reproduce on longitudinal follow-up studies. There has been an interest in the use of p-MRI techniques in advanced HCC, which allows monitoring the response to therapy at an early stage of treatment [6, 8]. Furthermore, this technique provides quantitative evaluation of tumor vascular modifications after treatment [2, 6, 11, 16]. One of the parameters obtained by the p-MRI is ktrans, which determines the flow of contrast from the intravascular space to the extracellular space that may indicate a change in tumor blood flow or vascular permeability [8, 11, 19, 23].
In this study, it was verified that the value of ktrans varies with the time point of treatment, with a significant difference from time T0 to T6, supporting the utility of ktrans measurements in the evaluation of the response to sorafenib therapy in advanced HCC. Since it was not possible to verify a significant difference in ktrans value at time T0 compared to time T3, this may warrant to extend the MR follow-up at least 6 months after the initiation of therapy. Although the current study seems to point out that a significant difference in ktrans values can only be seen after a longer period of treatment with sorafenib, the small sample size does not allow definite conclusions in this regard.
Since ktrans only indicates alterations of vascular permeability or blood flow, it seems logical to not be affected by tumor size, as we have also observed [11, 19, 22, 23]. A prior study showed that a higher ktrans value prior to the initiation of sunitinib therapy in advanced HCC is associated with a higher PFS [6]. However, in the present study, this relationship was not verified, and in the therapy with sorafenib in advanced HCC, the value of ktrans at T0 does not allow inferences related to the prognosis, especially in relation to PFS. Another study reports that the percentage change in ktrans value when analyzed as a continuous variable after the initiation of therapy may predict tumor response to tegafur/uracil-associated sorafenib therapy in advanced HCC, as well as global survival [11].
Some patients with advanced HCC were previously submitted to locoregional therapies, such as chemoembolization or radiofrequency thermoablation. In this study, we try to verify if the chemoembolization performed prior to sorafenib therapy caused differences in the value of ktrans obtained at T0. These differences were not statistically significant, so chemoembolization did not affect the change in the ktrans value.
Despite the promising results obtained, it should be noted that the study had some limitations. First, the total number of patients included in the study was relatively small, particularly for the three hepatic MRI assessments, and the present study should be validated in larger prospective studies. Second, this study corresponds to a retrospective observational study. Third, the hepatic MRI studies at T3 and T6 were not all performed at regular intervals. Fourth, subclassification of the stage C BCLC patients was not performed. Since it is known that stage C BCLC patients includes a wide group of heterogeneous patients with different treatment options, this may explain why the patients in the present study presented different responses to sorafenib treatment [24]. Fifth, it was not possible to define a value or parameter from which the existence of a therapeutic response and, consequently, the reduction of angiogenesis could be considered. Sixth, there is no consensus regarding the ideal pharmacokinetic model for the evaluation of the therapeutic and prognostic response, and the model used may not be the most indicated [25]. Finally, although it has occurred in a small number of patients, in some cases, the dose of sorafenib has been halved, which may have determined a poorer response to treatment.
In conclusion, the median ktrans value obtained by p-MRI in histogram analysis of the total tumor area may serve as a biomarker of tumor response to antiangiogenic therapy, but the antiangiogenic response may only be seen 6 months after its initiation. A larger longitudinal study with a more homogeneous patient selection may be warranted, trying to define which threshold ktrans value may assist in a better patient selection.
Conclusion
Based on the data obtained from this study, there were significant differences in the ktrans value between the assessment before the initiation of sorafenib and 6 months after the initiation, despite the limited number of patients. This suggests that there is a clinical benefit in the use of this parameter in the evaluation of the response to antiangiogenic therapy, although there was no significant difference in the ktrans value between the assessment before the start of therapy and 3 months after its onset. In addition, it was also found that the value of ktrans is not affected by the size of the lesion, as verified by the criteria currently accepted and used to evaluate the therapeutic response.
Contrary to previous studies, the value of ktrans obtained before starting therapy in patients with PFS for > 6 months was not found to be higher than the same value in patients with PFS for ≤6 months, not allowing inferences related to the prognosis as a function of the value of ktrans obtained before starting the treatment with sorafenib.
References
1 Ferlay J, Soerjomataram I, Dikshit R, Eser S, Mathers C, Rebelo M, et al. Cancer incidence and mortality worldwide: sources, methods and major patterns in GLOBOCAN 2012. Int J Cancer. 2015 Mar;136(5):E359–86. [ Links ]
2 Jiang T, Zhu AX, Sahani DV. Established and novel imaging biomarkers for assessing response to therapy in hepatocellular carcinoma. J Hepatol. 2013 Jan;58(1):169–77. [ Links ]
3 Thomas MB, Zhu AX. Hepatocellular carcinoma: the need for progress. J Clin Oncol. 2005 May;23(13):2892–9. [ Links ]
4 Keating GM, Santoro A. Sorafenib: a review of its use in advanced hepatocellular carcinoma. Drugs. 2009;69(2):223–40. [ Links ]
5 Gbolahan OB, Schacht MA, Beckley EW, La-Roche TP, ONeil BH, Pyko M. Locoregional and systemic therapy for hepatocellular carcinoma. J Gastrointest Oncol. 2017 Apr;8(2):215–28. [ Links ]
6 Sahani DV, Jiang T, Hayano K, Duda DG, Catalano OA, Ancukiewicz M, et al. Magnetic resonance imaging biomarkers in hepatocellular carcinoma: association with response and circulating biomarkers after sunitinib therapy. J Hematol Oncol. 2013 Jul;6(1):51. [ Links ]
7 Colagrande S, Regini F, Taliani GG, Nardi C, Inghilesi AL. Advanced hepatocellular carcinoma and sorafenib: Diagnosis, indications, clinical and radiological follow-up. World J Hepatol. 2015 May;7(8):1041–53. [ Links ]
8 Chen BB, Hsu CY, Yu CW, Liang PC, Hsu C, Hsu CH, et al. Early perfusion changes within 1 week of systemic treatment measured by dynamic contrast-enhanced MRI may predict survival in patients with advanced hepatocellular carcinoma. Eur Radiol. 2017 Jul;27(7):3069–79. [ Links ]
9 Ziogas IA, Tsoulfas G. Evolving role of Sorafenib in the management of hepatocellular carcinoma. World J Clin Oncol. 2017 Jun;8(3):203–13. [ Links ]
10 Colombo M, Sangiovanni A: Treatment of hepatocellular carcinoma: beyond international guidelines. Liver Int. 2015 Jan;35 Suppl 1:129–38. [ Links ]
11 Hsu CY, Shen YC, Yu CW, Hsu C, Hu FC, Hsu CH, et al. Dynamic contrast-enhanced magnetic resonance imaging biomarkers predict survival and response in hepatocelular carcinoma patients treated with sorafenib and metronomic tegafur/uracil. J Hepatol. 2011 Oct;55(4):858–65. [ Links ]
12 Bouattour M, Payance A, Wassermann J. Evaluation of antiangiogenic efficacy in advanced hepatocellular carcinoma: biomarkers and functional imaging. World J Hepatol. 2015 Sep;7(20):2245–63. [ Links ]
13 Llovet JM, Ricci S, Mazzaferro V, Hilgard P, Gane E, Blanc JF, et al.; SHARP Investigators Study Group. Sorafenib in advanced hepatocellular carcinoma. N Engl J Med. 2008 Jul;359(4):378–90. [ Links ]
14 Colagrande S, Inghilesi AL, Aburas S, Taliani GG, Nardi C, Marra F. Challenges of advanced hepatocellular carcinoma. World J Gastroenterol. 2016 Sep;22(34):7645–59. [ Links ]
15 Shao YY, Hsu CH, Cheng AL. Predictive biomarkers of sorafenib efficacy in advanced hepatocellular carcinoma: are we getting there? World J Gastroenterol. 2015 Sep;21(36):10336–47. [ Links ]
16 Choi JI, Imagawa DK, Bhosale P, Bhargava P, Tirkes T, Seery TE, et al. Magnetic resonance imaging following treatment of advanced hepatocellular carcinoma with sorafenib. Clin Mol Hepatol. 2014 Jun;20(2):218–22. [ Links ]
17 Ganten TM, Stauber RE, Schott E, Malfertheiner P, Buder R, Galle PR, Gohler T, Walther M, Koschny R, Gerken G: Sorafenib in Patients with Hepatocellular Carcinoma-Results of the Observational INSIGHT Study. Clin Cancer Res. 2017 Oct;23(19):5720–5728. [ Links ]
18 OConnor JP, Jackson A, Parker GJ, Jayson GC. DCE-MRI biomarkers in the clinical evaluation of antiangiogenic and vascular disrupting agents. Br J Cancer. 2007 Jan;96(2):189–95. [ Links ]
19 Chen BB, Shih TT. DCE-MRI in hepatocellular carcinoma-clinical and therapeutic image biomarker. World J Gastroenterol. 2014 Mar;20(12):3125–34. [ Links ]
20 Llovet JM, Di Bisceglie AM, Bruix J, Kramer BS, Lencioni R, Zhu AX, et al.; Panel of Experts in HCC-Design Clinical Trials. Design and endpoints of clinical trials in hepatocellular carcinoma. J Natl Cancer Inst. 2008 May;100(10):698–711. [ Links ]
21 Fournier L, Ammari S, Thiam R, Cuenod CA. Imaging criteria for assessing tumour response: RECIST, mRECIST, Cheson. Diagn Interv Imaging. 2014 Jul-Aug;95(7-8):689–703. [ Links ]
22 Salvaggio G, Furlan A, Agnello F, Cabibbo G, Marin D, Giannitrapani L, et al. Hepatocellular carcinoma enhancement on contrastenhanced CT and MR imaging: response assessment after treatment with sorafenib: preliminary results. Radiol Med (Torino). 2014 Apr;119(4):215–21. [ Links ]
23 Yang JF, Zhao ZH, Zhang Y, Zhao L, Yang LM, Zhang MM, et al. Dual-input two-compartment pharmacokinetic model of dynamic contrast-enhanced magnetic resonance imaging in hepatocellular carcinoma. World J Gastroenterol. 2016 Apr;22(13):3652–62. [ Links ]
24 Jun CH, Yoon JH, Cho E, Shin SS, Cho SB, Kim HJ, et al. Barcelona clinic liver cancerstage C hepatocellular carcinoma: A novel approach to subclassification and treatment. Medicine (Baltimore). 2017 Apr;96(17):e6745. [ Links ]
25 Jajamovich GH, Huang W, Besa C, Li X, Afzal A, Dyvorne HA, et al. DCE-MRI of hepatocellular carcinoma: perfusion quantification with Tofts model versus shutter-speed model- initial experience. MAGMA. 2016 Feb;29(1):49–58. [ Links ]
Statement of Ethics
This study was approved by the appropriate ethics committee.
Disclosure Statement
The authors have no conflicts of interest to declare.
* Corresponding author.
Filipe Caseiro-Alves
Rua Augusta nº 5
PT–3000-061 Coimbra (Portugal)
E-Mail lcalves@fmed.uc.pt
Marta Campos
Rua do Crasto nº57/59
PT–3810-416 Verdemilho-Aveiro (Portugal)
E-Mail martaresendecampos@gmail.com
Received: July 3, 2018; Accepted after revision: August 27, 2018

