


Serviços Personalizados
Journal
Artigo
 Inglês (pdf)
 Artigo em XML
 Referências do artigo
 Enviar este artigo por email
Indicadores
-
 Citado por SciELO
 -
 Acessos
Links relacionados
-
 Similares em
SciELO
Similares em
SciELO
Compartilhar

 Permalink
GE-Portuguese Journal of Gastroenterology
versão impressa ISSN 2341-4545
GE Port J Gastroenterol vol.24 no.4 Lisboa ago. 2017
https://doi.org/10.1159/000453364
ORIGINAL ARTICLE
Diagnostic Accuracy of Controlled Attenuation Parameter for Detecting Hepatic Steatosis in Patients with Chronic Liver Disease
Acuidade Diagnóstica do Parâmetro de Atenuação Controlada para Deteção de Esteatose Hepática em Doentes com Doença Hepática Crónica
Patrícia Andradea, Susana Rodriguesa, Eduardo Rodrigues-Pintoa, Rui Gaspara, Joanne Lopesb, Susana Lopesa, Guilherme Macedoa
Departments of aGastroenterology and bPathology, Faculty of Medicine, Centro Hospitalar São João, University of Porto, Porto, Portugal
* Corresponding author.
ABSTRACT
Introduction: Controlled attenuation parameter (CAP), measured by transient elastography, has been suggested as a noninvasive method for the detection and quantification of steatosis. We aimed to assess the accuracy of CAP to detect steatosis in patients with chronic liver disease (CLD) compared with liver histology and to evaluate factors that correlate with the CAP value. Methods: Patients with CLD who underwent liver biopsy and simultaneous CAP determination were consecutively enrolled. CAP was measured using the M probe of FibroScan® (Echosens, Paris, France). Histologically, steatosis was categorized as absent (S0: <5%), mild (S1: 5–33%), moderate (S2: 34–66%) and severe (S3: >66% of all hepatocytes ). Results: We analyzed 159 patients with CLD (61% men, mean age 47.9 ± 12.9 years). We found a positive correlation between CAP and steatosis in histology (rs = 0.869, p < 0.001), arterial hypertension (rs = 0.222, p = .005), type 2 diabetes mellitus (rs = 0.279, p < 0.001), body mass index (BMI; rs = 0.533, p < 0.001), total cholesterol (rs = 0.442, p < 0.001), triglycerides (rs = 0.272, p = 0.001), and non-alcoholic fatty liver disease (NAFLD; rs = 0.588, p < 0.001). In the multivariate analysis, BMI >25 (odds ratio [OR] 48.4, 95% confidence interval [CI] 23.78–72.95, p < 0.001), serum total cholesterol (OR 3.803, 95% CI 2.203–13.889, p = 0.008), and NAFLD etiology (OR 40.8, 95% CI 15.01–66.66, p = 0.002) were independently associated with higher CAP values. We did not find any significant correlation between CAP and the grade of necroinflammatory activity (rs = 0.063, p = 0.808) or fibrosis (rs = 0.071, p = 0.713) in histology and with alanine aminotransferase (rs = 0.190, p = 0.356) or aspartate aminotransferase (rs = 0.117, p = 0.142). Optimal CAP cutoff values for detecting steatosis ≥ S1, ≥ S2, and ≥ S3 were 206.5, 232.5, and 282.5 dB/m, respectively. CAP performance was 0.822, 0.956, and 0.976 for diagnosing steatosis ≥ S1, ≥ S2, and ≥ S3, respectively. Conclusions: CAP had an excellent diagnostic accuracy for the detection of steatosis in diverse CLD patients. A CAP value cutoff of <282.5 dB/m excludes severe steatosis ≥ S3 with an accuracy of 98%.
Keywords: Controlled attenuation parameter; Transient elastography;·Steatosis; Chronic liver disease; Liver biopsy
RESUMO
Introdução: O Parâmetro de Atenuação Controlada (CAP) medido por elastografia hepática tem sido sugerido como um método não invasivo para deteção e quantificação de esteatose. O objetivo deste estudo foi avaliar a acuidade do CAP na avaliação da esteatose hepática nos doentes com doença hepática crónica (DHC) comparativamente à histologia e avaliar os fatores que se correlacionam com o valor de CAP. Métodos: Incluídos os doentes com DHC que realizaram simultaneamente biópsia hepática e avaliação do CAP. Para avaliação do CAP foi utilizada a sonda M do Fibroscan® (Echosens,Paris, France). Na histologia, a esteatose foi categorizada em ausente (S0: <5%), ligeira (S1: 5–33%), moderada (S2: 34–66%) e grave (S3: >66% de hepatócitos). Resultados: Foram analisados 159 doentes com DHC (61% homens; idade média 47.9 ± 12.9 anos). Verificou-se uma correlação positiva entre o CAP e esteatose na histologia (rs = 0.869, p < 0.001), hipertensão arterial (rs = 0.222, p = 0.005), diabetes mellitus tipo 2 (rs =0.279, p < 0.001), índice de massa corporal (rs = 0.533, p < 0.001), colesterol total (rs = 0.442, p < 0.001), triglicerídeos (rs = 0.272, p = 0.001) e NAFLD (rs = 0.588, p < 0.001). Na análise multivariada, IMC>25 mg/kg 2 (odds ratio [OR] 48.4, IC 95%: 23.78–72.95, p < 0.001), o colesterol sérico (OR 3.803, IC 95%: 2.203–13.889, p = 0.008) e etiologia NAFLD (OR 40.8, IC 95%: 15.01–66.66, p = 0.002) associaram-se de forma independente a valores de CAP mais elevados. O CAP não se correlacionou com o grau de atividade necroinflamatória (rs = 0.063, p = 0.808) ou de fibrose na histologia (rs = 0.071, p = 0.713) nem com o valor de ALT (rs = 0.190, p = 0.356) ou AST (rs = 0.117, p = 0.142). O melhor cutoff para diagnóstico de esteatose ≥ S1, ≥ S2 e ≥ S3 foi 206.5 dB/m, 232.5 dB/m e 282.5 dB/m, respetivamente. A acuidade do CAP para diagnóstico de esteatose ≥ S1, ≥ S2 e ≥ S3, CAP foi 0.822, 0.956 e 0.976, respetivamente. Conclusões: O CAP apresentou elevada acuidade diagnóstica na deteção de esteatose em doentes com doença hepática crónica. Um valor de CAP inferior a 282.5 dB/m exclui esteatose ≥ S3 com 98% de acuidade.
Palavras-Chave: Parâmetro de atenuação controlada; Elastografia transitória; Esteatose; Doença hepática crónica; Biópsia hepática
Introduction
Liver steatosis is one of the most common conditions in chronic liver disease (CLD) with an increasing prevalence of 16–45% in the western society, 9–29% in the eastern society, 76% in the obese, and 46–80% in heavy alcoholics [1–3]. Regarding the global pandemy of obesity and metabolic syndrome, the incidence of non-alcoholic fatty liver disease (NAFLD) is increasing worldwide, and it is now the most common cause of CLD in both developed and developing countries [4–6]. Furthermore, steatosis can act as a co-factor of fibrogenesis in patients with CLD of other etiologies such as chronic hepatitis C and B virus infection and alcoholic liver disease. Regardless of the etiology, hepatic steatohepatitis can progress to end-stage liver disease such as liver cirrhosis or hepatocellular carcinoma [3, 7–9]. Thus, an early and accurate diagnosis of hepatic steatosis seems to be important for an appropriate management of patients with CLD.
Liver biopsy is still regarded as the gold standard in the diagnosis of steatosis. However, this procedure has several limitations such as invasiveness, potential sampling error, and inability to be readily repeated for an adequate patient follow-up [10, 11]. Alternative noninvasive methods, mainly involving conventional imaging, have been proposed to detect steatosis [12–14]. Ultrasonography (US) is the imaging technique of choice for detecting steatosis given its low cost, safety, and wide availability compared to computed tomography or magnetic resonance. However, US can only reliably detect steatosis greater than 20–30% and cannot accurately discriminate steatosis from fibrosis [14–16]. To overcome these limitations, transient elastography (TE) has recently been introduced in order to evaluate both steatosis and fibrosis simultaneously. Hepatic steatosis is determined by the controlled attenuation parameter (CAP), which is based on the properties of US signals acquired by the Fibroscan® (Echosens, Paris, France). CAP is an estimate of the total ultrasonic attenuation at the central frequency of the M or XL probe of the Fibroscan and is expressed in decibel per meter (dB/m). This parameter can be measured along with liver stiffness (LS) measurement, is machine independent, and can be assessed by an operator who does not have any US imaging skills [17–21].
Some recent studies have shown that CAP significantly correlates with the grade of steatosis in patients with CLD of different etiologies [22–24]. However, the accuracy of CAP for quantifying steatosis in patients with CLD varies among studies. Furthermore, parameters correlating with CAP (either clinic, laboratory, or histological) are not well established. In our study, we aimed to assess the performance of CAP to detect and quantify steatosis in a group of patients with CLD compared with liver histology (reference method). We also aimed to evaluate the clinical, laboratory, and histological factors that correlate with CAP.
Materials and Methods
Study Population
From June 2013 to June 2015, 159 patients with CLD who underwent CAP measurement and liver biopsy at our tertiary referral center (Centro Hospitalar São João, Porto, Portugal) were consecutively recruited. The indications to perform liver biopsy were to assess the degree of inflammatory activity and fibrosis and to establish a definite diagnosis in cases of uncertainty. Exclusion criteria were (i) age lower than 18 years; (ii) other etiology than chronic hepatitis B or C, autoimmune hepatitis, alcoholic liver disease or NAFLD; (iii) TE invalid/unreliable measure, and (iv) insufficient specimen size in liver biopsy.
Methods
Demographic, anthropometric, clinical, and biochemical parameters were collected on the day of the procedures if no previous results were available from the last month and prospectively collected in a database created for this purpose. Blood tests included hemoglobin, leukocytes and platelet count, albumin, fasting glucose, aspartate aminotransferase, alanine aminotransferase, γ-glutamyltranspeptidase, alkaline phosphatase, total bilirubin, prothrombin time, total cholesterol, high-density lipoprotein cholesterol, low-density lipoprotein cholesterol, and triglycerides.
All patients underwent TE using the Fibroscan M probe on the same day as liver biopsy after fasting for at least 8 h. TE was performed by a trained operator on the right lobe of the liver through the intercostal spaces with the patient lying in the dorsal decubitus position and the right arm in maximal abduction. Ultrasound attenuation (CAP) was only calculated when the LS value was valid in order to ensure an accurate attenuation. A reliable LS value was defined using the following 3 criteria: (i) at least 10 valid shots, (ii) a success rate (SR: the ratio of valid shots to the total number of shots) of at least 60%, and (iii) an interquartile range (IQR) of less than 30% of the median LS value (IQR/M\30%). The median value of 10 successful measurements was selected as the representative value. TE results were expressed as kilopascals (kPa) for LS and dB/m for CAP.
All liver samples were obtained by a percutaneous approach using the Menghini technique. Liver specimens were formalin fixed and paraffin embedded, and 3-mm slides were stained with hematoxylin-eosin and Masson trichrome. Only specimens with a minimum of 8 portal tracts were analyzed by 2 experienced hepatopathologists who were blinded for CAP results. Liver fibrosis stage and necroinflammation were evaluated using the METAVIR or Brunt scoring system, according to the liver disease etiology. Steatosis was estimated by visual assessment as a percentage of hepatocytes with fatty accumulation and categorized in the following staging systems: absent (S0: <5%), mild (S1: 5–33%), moderate (S2: 34–66%), and severe (S3: >66%).
Statistical Analysis
SPSS 22.0 for Windows (SPSS, Chicago, IL, USA) was used for statistical analysis. Categorical variables were described as absolute frequencies ( n ) and relative frequencies (%); continuous variables were described as mean ± standard deviation (parametric distributions) or as median and percentiles (nonparametric distributions). The normality of the continuous variables was tested using the Kolmogorov–Smirnov test and the respective histogram. The Student t test was used to compare quantitative variables with a normal distribution, and the Mann-Whitney U test was used to compare the quantitative variables without a normal distribution. Any groups with more than 2 quantitative variables were compared using the Kruskal-Wallis test. A Pearson χ 2 test was used to compare categorical variables. The Spearman rank-order correlation test ( rs ) was used to assess any correlation between CAP and clinical, laboratory, and histological parameters. A multivariate logistic regression was performed using the variables that provided a statistically significant association with CAP on the univariate analysis. The area under the receiver-operating characteristics curve (AUROC) was used to evaluate the performance of CAP in diagnosing steatosis using liver biopsy as the reference.
Results
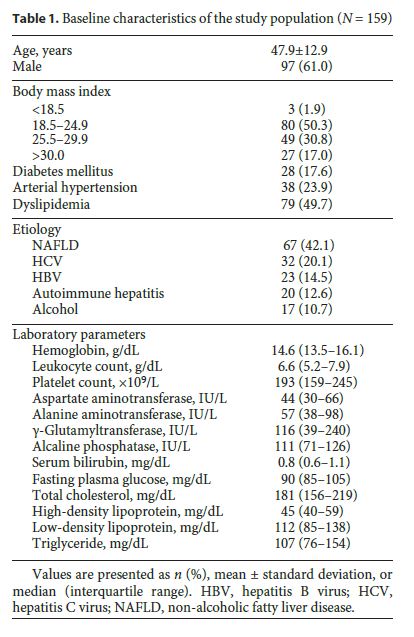
We included 159 patients with CLD who underwent CAP measurement and liver biopsy on the same day. The mean age of the patients was 47.9 ± 12.9 years, and 97 (61.0%) were male. The etiology of CLD was NAFLD in 67 (42.1%) patients, viral chronic hepatitis in 55 (34.6%), autoimmune hepatitis in 20 (12.6%), and alcohol in 17 (10.7%) patients. Baseline characteristics of the population are summarized in Table 1.
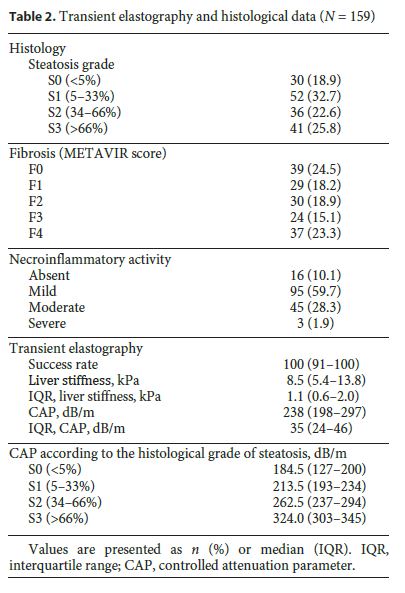
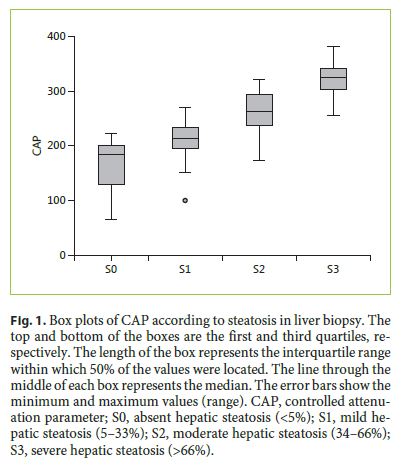
The median LS and CAP values were 8.5 kPa (IQR 5.4–13.8) and 238 dB/m (IQR, 198–297), respectively. The histological grade of steatosis was S0 in 30 (18.9%) patients, S1 in 52 (32.7%), S2 in 36 (22.6%), and S3 in 41 (25.8%) patients. Thirty-seven (23.3%) patients had cirrhosis according to the METAVIR score, and 95 (59.7%) had mild necroinflammatory activity in histology. TE and liver biopsy data are detailed in Table 2. The median CAP value increased significantly according to the histological grade of steatosis: S0, 184.5 (127–200) dB/m; S1, 213.5 (193–234) dB/m; S2, 262.5 (237–294) dB/m; and S3, 324.0 (303–345) dB/m (Fig. 1 , p < 0.001).
Correlation of CAP with Clinical, Laboratory, and Histological Parameters
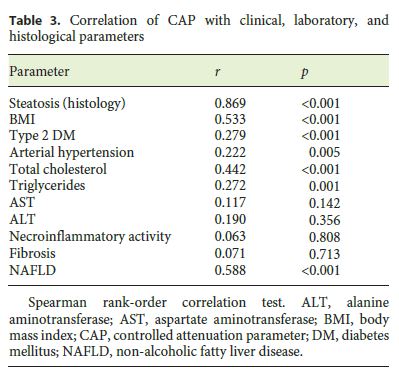
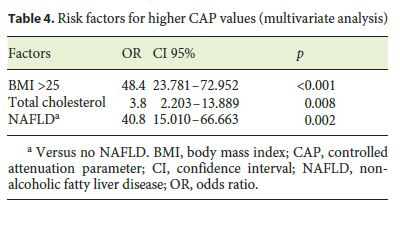
We found a positive correlation between CAP and steatosis in histology (rs = 0.869, p < 0.001), arterial hypertension (rs = 0.222, p = 0.005), type 2 diabetes mellitus (rs = 0.279, p < 0.001), body mass index (BMI; rs = 0.533, p < 0.001), total cholesterol (rs = 0.442, p < 0.001), triglycerides (rs = 0.272, p = 0.001), and NAFLD (rs = 0.588, p < 0.001). We did not find any significant correlation between CAP and the grade of necroinflammatory activity (rs = 0.063, p = 0.808) or fibrosis (rs = 0.071, p = 0.713) in histology and with alanine aminotransferase (rs = 0.190, p = 0.356) or aspartate aminotransferase (rs = 0.117, p = 0.142) (Table 3). In the multivariate analysis, a BMI >25 (OR 48.4, 95% confidence interval [CI]: 23.78–72.95, p < 0.001), dyslipidemia (OR 3.803, 95% CI 2.203–13.889, p = 0.008), and NAFLD etiology (OR 40.8, 95% CI 15.01–66.66, p = 0.002) were independently associated with higher CAP values (Table 4).
CAP Performance in the Assessment of Steatosis in CLDs
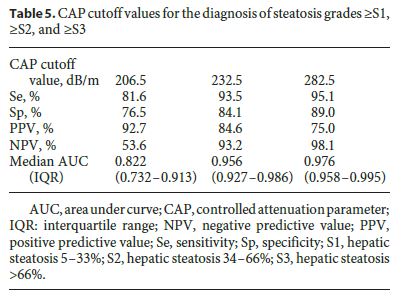
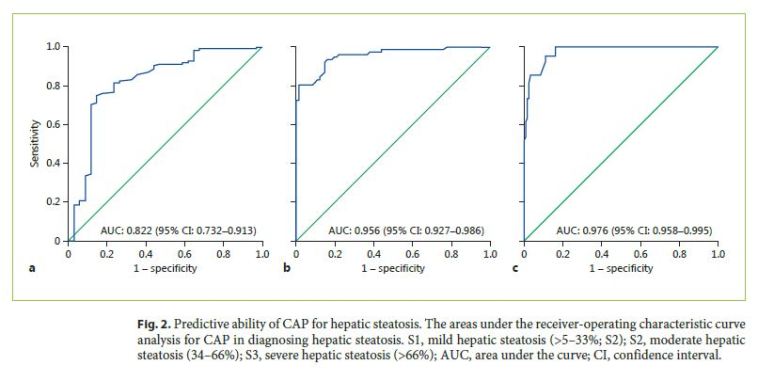
Optimal CAP cutoff values for detecting steatosis ≥ S1, ≥ S2, and ≥ S3 were 206.5 dB/m, 232.5 dB/m, and 282.5 dB/m, respectively. Table 5 shows CAP optimal cutoff values and corresponding sensitivity (Se), specificity (Sp), positive predictive value (PPV) and negative predictive value (NPV) for different steatosis thresholds. CAP was more accurate for predicting higher grades of steatosis: AUROC 0.822 for ≥ S1 (Se 81.6%, Sp 76.5%, PPV 92.7%, NPV 53.6%), 0.956 for ≥ S2 (Se 93.5%, Sp 84.1%, PPV 84.6%, NPV 93.2%), and 0.976 for ≥ S3 (Se 95.1%, Sp 89.0%, PPV 75.0%, NPV 98.1%). ROC curves for CAP performance for detecting steatosis ≥ S1, ≥ S2, and ≥ S3 are shown in Figure 2. AUROCs for distinguishing between each of the steatosis grades were 0.795 (0.700–0.890) for S0 versus S1, 0.975 (0.939–1.000) for S0 versus S2, 1.000 (1.000–1.000) for S0 versus S3, 0.868 (0.791–0.944) for S1 versus S2, 0.951 (0.887–0.992) for S1 versus S3, and 0.826 (0.735–0.917) for S2 versus S3, respectively.
Discussion
In our study, applying CAP in everyday clinical practice, CAP performed well as a noninvasive tool for quantifying steatosis in patients with CLDs.
We found that CAP had an excellent accuracy for diagnosing steatosis, with an AUC of 0.956 and 0.976 for steatosis ≥ S2 and ≥ S3, respectively. CAP performance for diagnosing steatosis ≥ S1 was lower, with an AUC of 0.822. In a meta-analysis assessing the CAP accuracy for steatosis detection, the AUROCs were 0.85, 0.88, and 0.87 for ≥ S1, ≥ S2, and ≥ S3, respectively [25]. Compared with the cited meta-analysis CAP accuracy for steatosis detection was higher in our study, which may be explained by the small number of patients with a BMI >30 (only 17.0%). Indeed, some studies have shown that CAP accuracy is impaired by an increased BMI [26, 27]. CAP accuracy varies among studies, some of them showing a better diagnostic performance of CAP to identify severe steatosis grades and others showing that CAP is more accurate in assessing less severe hepatic steatosis [18, 25–29]. Furthermore, Myers et al. [21] reported that the diagnostic performance of CAP to identify severe steatosis was suboptimal, and the ability to differentiate between steatosis grades 2 and 3 was not satisfactory in the studies by Sasso et al. [17] and de Ledinghen et al. [19]. In addition, Jung et al. [30] showed a high steatotic burden (steatosis grade 3 or high CAP values) was selected as the independent risk factor of discordant results between LB and CAP. It has been known that LS values become more reliable when advanced fibrosis or cirrhosis exists, thus the opposite phenomenon of LS and CAP needs to be clarified. Jung et al. [30] hypothesized that the correlation between ultrasonic attenuation and the amount of hepatic steatosis may be diminished, especially when the steatosis is severe. However, only a small proportion of patients had a S3 grade in their study, which may have lowered the diagnostic performance of CAP in patients with a high steatotic burden, thus these results need to be confirmed in larger prospective studies.
In the above-cited meta-analyses assessing CAP accuracy for steatosis detection, the summarized sensitivity and specificity values were 0.78 and 0.79 for ≥ S1, 0.85 and 0.79 for ≥ S2, and 0.83 and 0.79 for S3 [25]. In our study, the sensitivity and specificity were 81.6/76.5%, 93.5/84.1%, and 95.1/89.0% for the median optimal CAP cutoff values of 206.5 dB/m, 232.5 dB/m, and 282.5 dB/m for prediction of ≥ S1, ≥ S2, and S3 steatosis grade, respectively. One must highlight that CAP cutoff values vary among studies depending on liver disease etiology, prevalence of different BMIs, prevalence of different steatosis grades in the study group and the desired objective (maximum specificity and sensitivity, maximum accuracy, cutoff to obtain a greater specificity for a sensitivity higher than 0.90, etc.). In our study, the optimal cutoff values were defined by maximizing the sum of sensitivity and specificity (maximum Youden index). In this study, the PPV of CAP for steatosis ≥ S2 and ≥ S3 was 84.6 and 75.0%, respectively. However, the NPV was excellent (93.2 and 98.1%, respectively), which suggests that CAP may be a useful clinical tool to help exclude, rather than confirm, the presence of moderate or severe steatosis.
In the present study, CAP did not correlate with the grade of fibrosis or necroinflammatory activity in histology. Similar results have been reported in other studies, confirming the utility of CAP for diagnosing steatosis independently of the disease stage or necroinflammatory activity [26, 28, 30]. The value of CAP positively correlated with arterial hypertension, dyslipidemia, type 2 DM, and BMI (all components of metabolic syndrome evaluated in this study) and in the multivariate analysis, BMI >25 (OR 48.4, 95% CI 23.78–72.95, p < 0.001) and serum total cholesterol (OR 3.803, 95% CI 2.203–13.889, p = 0.008) were independently associated with higher CAP values. Ledinghen et al. also reported similar findings in a prospective study involving 5,323 examinations and suggested that these findings may have important implications for current and future applications in patients with metabolic syndrome, especially with NAFLD [31]. In fact, it seems that the evolution of CAP values can be related to the evolution of the metabolic syndrome, and thus CAP may allow us to easily follow the evolution of patients with metabolic syndrome or NAFLD.
Our study has some limitations. First, we included patients with CLD due to various etiologies. Considering that the diagnostic performance can vary according to the etiology, the results may have been influenced. However, recent studies have shown that the accuracy of CAP was similar among different etiologies including viral hepatitis and NAFLD, suggesting that heterogeneous etiologies may not have a major influence on our results. Second, in our cohort, only a small proportion of patients (17.0%) had a BMI >30, which may have influenced CAP performance. This was due to the fact that, at our center at the time of the study, CAP measurement software was not installed in the XL probe that was specially designed to assess LS in overweight and obese patients. Finally, we could not show the relation between CAP and waist circumference since this parameter was not consistently evaluated.
In conclusion, CAP had excellent diagnostic accuracy for diagnosing moderate and severe steatosis in patients with diverse CLD, which can noninvasively follow patients with distinct liver diseases. CAP performance was not influenced by the degree of fibrosis or inflammatory activity in histology. Due to the excellent NPV, CAP may be a useful clinical tool to help exclude, rather than confirm, the presence of moderate or severe steatosis.
References
1 Blachier M, Leleu H, Peck-Radosavljevic M, Valla DC, Roudot-Thoraval F: The burden of liver disease in Europe: a review of available epidemiological data. J Hepatol 2013;58:593–608. [ Links ]
2 Bellentani S, Saccoccio G, Masutti F, Croce LS, Brandi G, Sasso F, et al: Prevalence of and risk factors for hepatic steatosis in Northern Italy. Ann Intern Med 2000;132:112–117. [ Links ]
3 Leandro G, Mangia A, Hui J, Fabris P, Rubbia-Brandt L, Colloredo G, et al: Relationship between steatosis, inflammation, and fibrosis in chronic hepatitis C: a meta-analysis of individual patient data. Gastroenterology 2006;130:1636–1642. [ Links ]
4 Lazo M, Clark J: The epidemiology of non-alcoholic fatty liver disease: a global perspective. Semin Liver Dis 2008;28:339–350. [ Links ]
5 Williams CD, Stengel J, Asike MI, Torres DM, Shaw J, Contreras M, et al: Prevalence of non-alcoholic fatty liver disease and non-alcoholic steatohepatitis among a largely middle-aged population utilizing ultrasound and liver biopsy: a prospective study. Gastroenterology 2011;140:124–131. [ Links ]
6 Wong RJ, Aguilar M, Cheung R, Perumpail RB, Harrison SA, Younossi ZM, et al: Nonalcoholic steatohepatitis is the second leading etiology of liver disease among adults awaiting liver transplantation in the United States. Gastroenterology 2015;148:547–555. [ Links ]
7 Farrell G, Larter C: Nonalcoholic fatty liver disease: from steatosis to cirrhosis. Hepatology 2006;43:S99–S112. [ Links ]
8 Powell EE, Jonsson JR, Clouston AD: Steatosis: co-factor in other liver diseases. Hepatology 2005;42:5–13. [ Links ]
9 Starley BQ, Calcagno CJ, Harrison SA: Nonalcoholic fatty liver disease and hepatocellular carcinoma: a weighty connection. Hepatology 2010;51:1820–1832. [ Links ]
10 Rockey DC, Caldwell SH, Goodman ZD, Nelson RC, Smith AD; American Association for the Study of Liver Diseases: Liver biopsy. Hepatology 2009;49:1017–1044. [ Links ]
11 Ratziu V, Charlotte F, Heurtier A, Gombert S, Giral P, Bruckert E, et al: Sampling variability of liver biopsy in nonalcoholic fatty liver disease. Gastroenterology 2005;128:1898–1906. [ Links ]
12 Bohte AE, van Werven JR, Bipat S, Stoker J: The diagnostic accuracy of US, CT, MRI and 1H-MRS for the evaluation of hepatic steatosis compared with liver biopsy: a meta-analysis. Eur Radiol 2011;21:87–97. [ Links ]
13 Lupşor-Platon M, Stefănescu H, Mureșan D, Florea M, Szasz ME, Maniu A, et al: Noninvasive assessment of liver steatosis using ultrasound methods. Med Ultrason 2014;16:236–245. [ Links ]
14 Schwenzer NF, Springer F, Schraml C, Stefan N, Machann J, Schick F: Non-invasive assessment and quantification of liver steatosis by ultrasound, computed tomography and magnetic resonance. J Hepatol 2009;51:433–445. [ Links ]
15 Dasarathy S, Dasarathy J, Khiyami A, Joseph R, Lopez R, McCullough AJ: Validity of real time ultrasound in the diagnosis of hepatic steatosis: a prospective study. J Hepatol 2009;51:1061–1067. [ Links ]
16 Hernaez R, Lazo M, Bonekamp S, Kamel I, Brancati FL, Guallar E, et al: Diagnostic accuracy and reliability of ultrasonography for the detection of fatty liver: a meta-analysis. Hepatology 2011;54:1082–1090. [ Links ]
17 Sasso M, Beaugrand M, de Ledinghen V, Douvin C, Marcellin P, Poupon R, Sandrin L, et al: Controlled attenuation parameter (CAP): a novel VCTETM guided ultrasonic attenuation measurement for the evaluation of hepatic steatosis: preliminary study and validation in a cohort of patients with chronic liver disease from various causes. Ultrasound Med Biol 2010;36:1825–1835. [ Links ]
18 Sasso M, Miette V, Sandrin L, Beaugrand M: The controlled attenuation parameter (CAP): a novel tool for the non-invasive evaluation of steatosis using Fibroscan. Clin Res Hepatol Gastroenterol 2012;36: 13–20. [ Links ]
19 de Ledinghen V, Vergniol J, Foucher J, Merrouche W, le Bail B: Non-invasive diagnosis of liver steatosis using controlled attenuation parameter (CAP) and transient elastography. Liver Int 2012;32:911–918. [ Links ]
20 Ratziu V, Bellentani S, Cortez-Pinto H, Day C, Marchesini G: A position statement on NAFLD/NASH based on the EASL 2009 special conference. J Hepatol 2010;53:372–384. [ Links ]
21 Myers RP, Pollett A, Kirsch R, Pomier-Layrargues G, Beaton M, Levstik M, et al: Controlled Attenuation Parameter (CAP): a noninvasive method for the detection of hepatic steatosis based on transient elastography. Liver Int 2012;32:902–910. [ Links ]
22 Sasso M, Tengher-Barna I, Ziol M, Miette V, Fournier C, Sandrin L, et al: Novel controlled attenuation parameter for noninvasive assessment of steatosis using Fibroscan®: validation in chronic hepatitis C. J Viral Hepat 2012;19:244–253. [ Links ]
23 Mi YQ, Shi QY, Xu L, Shi RF, Liu YG, Li P, et al: Controlled attenuation parameter for noninvasive assessment of hepatic steatosis using Fibroscan®: validation in chronic hepatitis B. Dig Dis Sci 2015;60:243–251. [ Links ]
24 Kumar M, Rastogi A, Singh T, Behari C, Gupta E, Garg H, et al: Controlled attenuation parameter for non-invasive assessment of hepatic steatosis: does etiology affect performance? J Gastroenterol Hepatol 2013; 28:1194–1201. [ Links ]
25 Shi KQ, Tang JZ, Zhu XL, Ying L, Li DW, Gao J, et al: Controlled attenuation parameter for the detection of steatosis severity in chronic liver disease: a meta-analysis of diagnostic accuracy. J Gastroenterol Hepatol 2014;29:1149–1158. [ Links ]
26 Shen F, Zheng RD, Mi YQ, Wang XY, Pan Q, Chen ML, et al: Controlled attenuation parameter for non-invasive assessment of hepatic statosis in Chinese patients. World J Gastroenterol 2014;20:4702–4711. [ Links ]
27 Chan WK, Nik Mustapha NR, Mahadeva S: Controlled attenuation parameter for the detection and quantification of hepatic steatosis in nonalcoholic fatty liver disease. J Gastroenterol Hepatol 2014;29:1470–1476. [ Links ]
28 Lupșor-Platon M, Feier D, Stefănescu H, Tamas A, Botan E, Sparchez Z, et al: Diagnostic accuracy of controlled attenuation parameter measured by transient elastography for the non-invasive assessment of liver steatosis: a prospective study. J Gastrointestin Liver Dis 2015;24:35–42. [ Links ]
29 Cardoso AC, Beaugrand M, de Ledinghen V, Douvin C, Poupon R, Trinchet JC, et al: Diagnostic performance of controlled attenuation parameter for predicting steatosis grade in chronic hepatitis B. Ann Hepatol 2015;14:826–836. [ Links ]
30 Jung KS, Kim BK, Kim SU, Chon YE, Chun KH, Kim SB, et al: Factors affecting the accuracy of controlled attenuation parameter (CAP) in assessing hepatic steatosis in patients with chronic liver disease. PLoS One 20149:e98689. [ Links ]
31 de Ledinghen V, Vergniol J, Capdepont M, Chermak F, Hiriart JB, Cassinotto C: Controlled attenuation parameter (CAP) for the diagnosis of steatosis: a prospective study of 5323 examinations. J Hepatol 2014;60:1026–1031. [ Links ]
Statement of Ethics
According to the ethical guidelines of the 1975 Declaration of Helsinki, the Ethics Committee of Centro Hospitalar São João approved this study.
Disclosure Statement
The authors have no conflicts of interest to disclose.
* Corresponding author.
Dr. Patrícia Andrade
Department of Gastroenterology, Faculty of Medicine
Centro Hospitalar São João, University of Porto
Alameda Prof. Hernani Monteiro, PT–4200-319 Porto (Portugal)
E-Mail anapatriciarandrade@gmail.com
Received: October 10, 2016; Accepted after revision: November 11, 2016
Author Contributions
P.A. and S.R. were responsible for study design. P.A. and R.G. collected data. J.L. was responsible for histological data. E.R.-P. was responsible for statistical analyses. P.A. and S.R. wrote the manuscript. S.L. and G.M. revised and approved the final manuscript.

