


Serviços Personalizados
Journal
Artigo
 Inglês (pdf)
 Artigo em XML
 Referências do artigo
 Enviar este artigo por email
Indicadores
-
 Citado por SciELO
 -
 Acessos
Links relacionados
-
 Similares em
SciELO
Similares em
SciELO
Compartilhar

 Permalink
Tourism & Management Studies
versão impressa ISSN 2182-8458versão On-line ISSN 2182-8466
TMStudies vol.14 no.2 Faro jun. 2018
https://doi.org/10.18089/tms.2018.14207
MANAGEMENT: SCIENTIFIC PAPERS
Efficiency determinants in Portuguese banking industry: an application through fractional regression models
Fatores determinantes da eficiência do setor bancário em Portugal: uma aplicação através de modelos de regressão fracional
Ana Isabel Martins*
*University of Algarve, School of Management, Hospitality and Tourism, Campus da Penha, 8005-139 Faro, Portugal, aimartin@ualg.pt
ABSTRACT
The participation in the Euro area and the current financial crisis substantially conditioned the development of the Portuguese banking industry, for which is expected a continuous fall in income and a growing competitive pressure, improving the need to look carefully to issues as efficiency as an essential survival factor. Efficiency indicators of the main banks operating in Portugal were measured through DEA methodology. The application of two-stage models allowed circumventing the usual problems inherent to the coexistence of the production and intermediation approaches. The application of regression for proportions, more appropriate than traditional linear and Tobit regressions, to deal with the fractional nature of the DEA scores, allowed the identification of efficiency determinant factors for the main banks operating in Portugal. The fractional regression models demonstrate evidence of improved specification comparing to traditional regression models. The variables that appear to major influence on overall efficiency are internationalization, size and type of ownership of capital.
Keywords: DEA models, banking efficiency, fractional regression, efficiency determinants.
RESUMO
A participação na área Euro e a atual crise financeira têm condicionado substancialmente o setor bancário português, para o qual se prevê a continuação de quebras significativas nos rendimentos e uma crescente pressão competitiva, sendo a eficiência um fator imprescindível para a sobrevivência. Foram avaliados diversos indicadores de eficiência dos principais bancos a operar em Portugal, através da metodologia DEA. A aplicação de modelos bietápicos permitiu contornar a habitual problemática inerente à coexistência das abordagens de produção e intermediação. A aplicação de regressões para proporções, mais apropriadas que as tradicionais regressões lineares ou que o modelo Tobit, para lidar com a natureza fracionaria dos índices DEA, permitiu a identificação dos fatores determinantes da eficiência dos principais bancos a operar em Portugal. Os modelos de regressão fracional mostram evidências de melhor especificação relativamente aos modelos de regressão tradicionais. As variáveis que parecem exercer maior influência sobre os níveis de eficiência bietápica global são as variáveis internacionalização, dimensão e tipo de propriedade do capital.
Palavras-chave: Modelos DEA, eficiência bancária, regressões fracionais, determinantes de eficiência.
1. Introduction
The severe international economic and financial crisis forced financial institutions to adopt policies to contain operating expenses, through a rigorous rationalization of productive factors and reengineering of resources, where efficiency and risk management, as well as the maintenance of market share, have come to play a key role. An increasing competitive pressure on the banking sector is likely to lead to even narrower margins and increased efficiency in order to maintain market share. In addition, banks will have to optimize their risk profile by reducing weighted average assets and increasing capital ratios. The findings of Pedro et al. (2017) suggest that the bank's high debt and a country's low GDP growth rate as the major determinants of banking crises. Also Tan and Floros (2013) report that GDP growth rates have positive impacts on bank productivity in China.
Participation in the Euro area and the consequent financial integration into a broad monetary union significantly conditioned the evolution of the banking system in Portugal. The globalization of markets and the transposition of EU directives resulting from the Basel Agreements were the main drivers of the unstable climate and the main challenges that have been placed on the banking sector in recent years. The Portuguese economy was marked in 2011 by the request for international economic and financial assistance, due to the progressive deterioration of the conditions of access to the international financing markets. The activity of the Portuguese banking system developed in a context of scarce financing, intensification of the sovereign debt crisis and increase of credit risk.
There are several techniques applied in the study of efficiency, however the Data Envelopment Analysis (DEA) methodology has been widely used in the most diverse industries, given its mathematical simplicity and non-parametric nature. In general terms, the DEA methodology is a linear mathematical programming technique that converts multiple inputs and outputs into efficiency measures. The conversion is done by comparing the inputs used and the outputs in each Decision Making Unit (DMU) in relation to all other DMU under study, allowing to identify the most efficient units in a population and, based on them, to provide a measure of relative inefficiency for the remaining ones.
Several studies applied to efficiency frontiers carry out, in a second stage, complementary analyzes to identify the determinants of business efficiency. Coelli et al. (1998) were the main drivers of the identification of efficiency determinants, using the DEA efficiency scores, calculated as dependent variables in Tobit regressions, in a first step, in order to identify the variables with greater explanatory power over these scores, in a second step. This two-stage methodology, which combines the calculation of DEA efficiency scores with the Tobit regression, was subsequently used in numerous studies applied to several industries, including the banking sector. Given that the DEA efficiency scores assume continuous values in the interval ]0; 1], the Tobit regression was considered by many authors to be more appropriate instead of simple linear models, which should be imposed a two-limit constraint. However, despite the extensive application of Tobit regression models to DEA efficiency scores, recent studies report this technique as a poor specification because there is a positive probability that the scores assume a value equal to 1, but the probability of the value equal to 0 is zero. Several authors report that although the Tobit model may be appropriate to describe data censored in the interval [0, 1], it is not appropriate to apply to the DEA efficiency scores, since these are obtained naturally, derived from its calculation method, and not by any kind of censorship (Papke and Wooldrigde, 1996) (Hoff, 2007) (McDonald, 2009) (Ramalho et al., 2010). Papke and Wooldridge (1996) started the study of appropriate regressions to this type of data, and promoted the creation of a new group of regressions, which have been frequently called by researchers by fractional regression models, whose dependent variables assume values in the interval [0; 1]. Ramalho et al. (2009; 2010; 2011) test several alternative regression models to deal with the fractional nature of DEA scores, namely: Logit, Probit, Loglog and Cloglog regressions.
This research intends to contribute to the study of this topic, since (i) we do not know empirical studies applied to the banking sector in Portugal, in which efficiency scores are estimated through a two-stage DEA model similar to the one applied; (ii) nor do we know the existence of empirical studies in which the efficiency determinants of the banking sector in Portugal are identified through fractional regressions. The main objective of this study is to evaluate the efficiency and identify the efficiency determinants of the main banks operating in Portugal, which are estimated in an integrated and more demanding way, which surpasses the traditional standard efficiency models. The efficiency scores were estimated based on a two-stage model and, at a later stage, the main determinants of bank efficiency were identified based on the application of fractional regressions. These alternative models are effectively more appropriate to deal with the fractional nature of DEA scores.
2. Literature review2.1 Efficiency evaluation through DEA
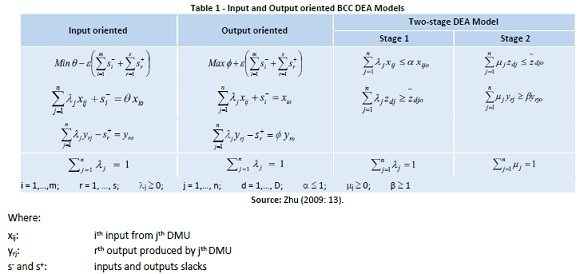
The first definition of technical efficiency has been developed by Koopmans (1951), based on the works of Debreu (1951) who proposed the first measure of productive efficiency: the coefficient of resource utilization. These studies led Farrell (1957) to develop a methodology to empirically calculate the relative efficiency of different production units, allowing the decomposition of productive efficiency in technical efficiency and allocation efficiency. Charnes, Cooper and Rhodes (1978) developed the CCR model (named relative to the initials of their authors) based on the model proposed by Farrell (1957), converting the technical efficiency measure obtained by the initial model (based on a single input/output process) to a multiple inputs/outputs process (Martins, 2009; 2010). In this context, DEA methodology was developed by Charnes et al. (1978; 1981) consisting of a mathematical linear programming technique that converts multiple inputs and outputs in efficiency measures. The conversion is performed by comparing the resources (inputs) used and the results (outputs) produced in each DMU with all the other DMU under study. The DMU are organizational units with similar characteristics, in any industry (manufacturing plants, schools, banks, hospitals, businesses, etc.). The application of DEA methodology identifies the most efficient units in a population and, based on these provide, a measure of inefficiency for all the others, measuring the relative efficiency. DEA also evaluates the economies of scale present in the production process through the use of different models. We can identify two main variants: CCR model, which considers the lack of a significant relationship between the operations scale and the efficiency level, assuming constant returns to scale, that is, the model assumes that an increase in output is proportional to the increase in inputs at any scale of production (Charnes et al., 1978) and BCC model, which considers variable returns to scale and does not assume proportionality between inputs and outputs (Banker, Charnes and Cooper, 1984 - BCC model, also named relative to the initials of their authors). The DEA methodology is classified as non- parametric since it does not use a predefined production function identically to all organizations for the analysis of the relationship among input - output - efficiency factors. Through linear programming techniques, DEA determines an efficient frontier based on the best practice companies. Companies located below the frontier are considered inefficient. Its main objective is to identify the efficient DMU and to evaluate the necessary adjustments of the amount of inputs and/or outputs from inefficient DMU, in order to promote their efficiency levels. The main point is that DEA methodology allows calculating quantitatively the relative efficiency of DMU, identifying the sources and amounts of each DMU relative inefficiency and maximizing the efficiency of each DMU. For each inefficient DMU, DEA identifies the efficient DMU marked as a reference to them and their contribution to the calculation of their (in)efficiency ratio. For each DMU, DEA defines the weights that maximize its efficiency in relation to other units. Each DMU obtains a score of their relative performance, being possible to determine the levels of consumption (input) and production (output) that would make them efficient. The scores ranges between 0 and 1 (equivalent to 0% and 100%), and the efficient units have a score value equal to 1 (equivalent to 100%). It should be noted however, that having an efficiency level of 1 does not necessarily correspond to be an absolute efficient DMU, but just to be more efficient than the other DMU in the sample. The DEA models can be applied to minimize the level of inputs to achieve a given level of output target (input oriented) or to maximize the level of output given a certain fixed level of input (output oriented) (Thanassoulis, 2003) and derive from the linear programming problems, for the BCC model type, described in Table 1.
There are, specifically for the banking sector, several approaches to evaluate efficiency, which differ mainly in the basic foundations that support the identification of input and output variables to include in the models. The approaches referred as production, intermediation and modern are traditionally applied by the vast majority of authors. A careful selection of input/output variables for inclusion in the DEA model is particularly relevant in the banking sector, since two major approaches coexist, associated to the main type of activity inherent to the business: the intermediation approach where banks are regarded as financial intermediaries whose primary business is the gathering of resources from savers (savings/deposits) and the mobilization of these funds to others for investment activities in the form of loans, by carrying out a income (interest, commissions, etc.); and the production approach where banks are considered institutions that use capital and labor to provide services, or to provide loans and manage deposits. In this context, the main problem surrounds the deposits classification, since in the intermediation approach deposits are considered inputs and in the production approach are considered outputs.
The study by Wang et al. (1997), on the impact of information technologies on bank performance, introduced the notion of a two- stage model. The two-stage models assume that the productive process is composed of sub processes (or stages) and have as particularity to use the outputs of the model of step 1 as inputs (exclusive) of the model of step 2. The variables common to both models are denominated, in this context, as intermediate measures. Chen and Zhu (2004) develop the study carried out by Wang et al. (1997) based on the assumption that the (in)efficiency of one step influences the (in)efficiency of the other, due to the existence of common intermediate measures. In this context, the two-stage model derives from the assumption of variable returns to scale. Kao and Hwang (2008) incorporate some relationships between the two steps and demonstrate that the overall efficiency level Ek (overall efficiency) of the two-step model calculated on the basis of the product between the efficiency levels of the two steps,

is a more appropriate indicator than the indicator calculated according to the notion of Wang et al. (1997).
2.2 Efficiency determinants through regression analysis
Coelli et al. (1998) spread the application of a two-stage approach to the study of efficiency calculating DEA efficiency scores in the first stage and identifying the variables which influence those scores of efficiency in the second stage, through the application of Tobit regressions, in which the DEA efficiency score corresponds to the dependent variable. The independent variables may correspond to input variables used in the DEA model or incorporate other variables. In recent years, many DEA applications have employed the two-stage methodology. In the banking sector this approach was applied by Casu e Molyneux (2000), Jackson and Fethi (2000), Sufian e Majid (2007).
Since the DEA efficiency scores assume continuous values in the interval ]0; 1] and can register several values close or equal to 1, many authors consider that to the application of the Tobit model, in a second stage for the determination of the efficiency determinants, should be imposed a two-limit constraint. However, several recent studies consider that this technique is not appropriate for DEA scores since there is a positive probability that the scores assume the upper limit value (equal to 1) but the probability of assuming the lower limit value (equal to 0) is null. Moreover, the parameters of the Tobit regression do not allow to directly determine the effect of the variables on the DEA efficiency scores, an often neglected fact. Several authors, such as Papke and Wooldrigde (1996), Hoff (2007), McDonald (2009) and Ramalho et al. (2009; 2010; 2011), argue that the Tobit model may be appropriate to describe data censored in the interval [0, 1], but not to DEA efficiency scores, since they are derived naturally from its calculation form and not from any type of censorship.
In this context, Papke and Wooldridge (1996) started the study of regressions considered more appropriate to the DEA scores, and promoted the creation of so-called fractional regressions, whose dependent variables assume values in the interval [0; 1]. Its model does not require transformations to the original data and allows the direct estimation of the dependent variable. The method used is considered totally robust and relatively efficient according to the premises of the generalized linear model. The main disadvantage of this model is that it requires specific programming since it is more complex than traditional ones (McDonald, 2009).
Hoff (2007) compares different two-stage modeling approaches for DEA scores against exogenous variables for the following models: Tobit (with two-limits), Papke-Wooldridge, unit inflated beta and simple linear regression estimated by Ordinary Least Squares - OLS. The author concluded that the Tobit model or the OLS model may be sufficient to model the DEA scores against exogenous variables, although none of them is well specified. Their conclusions reveal that the OLS model performs as well as the Tobit and Papke-Wooldridge models, since Taylor's first-order approximation for non-linear models, i.e. OLS, may in many cases be sufficient for the application of the second step in DEA models. McDonald (2009) also considers the OLS regression as a consistent estimator.
3. MethodologyIn order to identify the efficiency factors of the banks under study, a period of 6 years (2005 to 2010) was used, given the reduced size of the sample for an annual study period. The DEA efficiency scores were calculated for a balanced panel of 26 banks, on a total of 156 observations obtained.
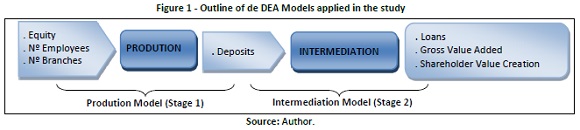
Performance is evaluated through two models denominated Production Model and Intermediation Model, based on the model created by Seiford and Zhu (1999) and innovated by Martins (2009). The Production Model incorporates as input variables equity, number of employees and number of branches and as output variable the amount of deposits. The Intermediation Model incorporates deposits as input variable and as output variables loans, gross value added and shareholder value created.
Overall efficiency scores were obtained through the two-stage model under the concept of Chen and Zhu (2004), adapted by Martins (2009), applied as stated in figure 1. This model also allows to evaluate the significance of intermediate measure (Deposit), main connector among savers and investors.
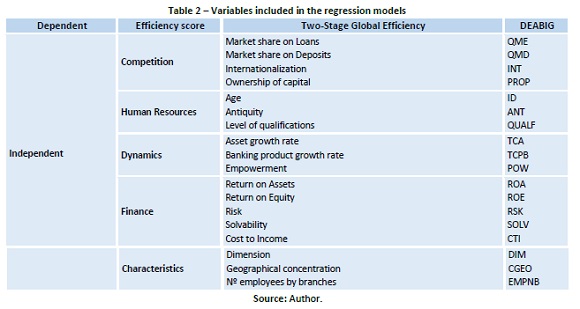
In order to identify the efficiency determinants of the banks under study, 18 independent variables were selected, which are considered potentially explanatory of the efficiency levels under study. These variables were obtained from the banks' annual reports, Portuguese Bank Association (APB) bulletins, rating levels attributed by the main financial advisors (Standard & Poor's, Moody's and Fitch), market risk premiums, real interest rates on treasury bonds, and aggregate sectoral information. All monetary variables were deflated at 2005 values, based on inflation rates on the website of the National Statistical Institute (INE). The independent variables were created based on 5 groups of factors, namely: (1) competition, which includes variables related to market shares, degree of internationalization and ownership of capital; (2) human resources, which include variables that characterize employees related to domestic activity, such as age, antiquity and level of qualifications; (3) dynamics, which include variables that characterize the company's growth rates and its production capacity against available resources; (4) financial variables, which include variables such as asset yield, return on equity, risk, solvency and productivity, and (5) miscellaneous characteristics, which include variables that characterize the bank in terms of size, geographic concentration and number of employees by branches. The variables included in the various regression models are summarized in table 2.
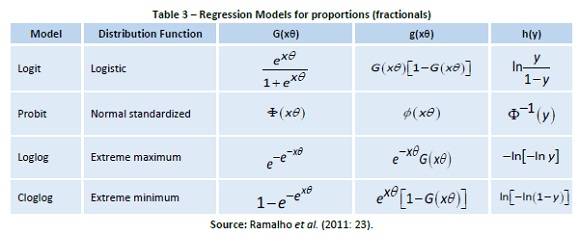
The identification of the efficiency determinants of the banks under study was made through the application of fractional regressions to the overall efficiency scores obtained from the two-stage DEA model (which simultaneously involves production and intermediation efficiency). It was considered more appropriate to apply the alternative approaches, which consider the fractional nature of the dependent variable, according to the models for proportions proposed by Ramalho et al. (2009; 2010; 2011) and Murteira and Ramalho (2016). The regressions were applied to proportions according to the Logit, Probit, Loglog and Complementary Loglog (Cloglog) functions according to the models and functions presented in table 3. The results of the Linear and Tobit regressions are also presented in the range [0; 1], with the objective of comparing the results obtained from the fractional models with other existing studies on this topic. It is considered that these models cover the whole of the notions of efficiency, which it was intended to evaluate, in a more robust and demanding way. The different types of regressions were first applied to all the independent variables considered as potential determinants of efficiency (in table 2), essentially in order to analyze the type of relationship of each of them with the dependent variable. The model composed of all variables studied is considered the non-restricted model.
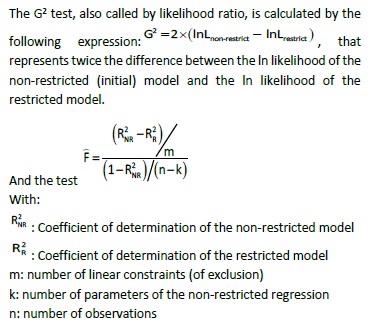
Later, in order to identify the variables with greater explanatory power over the dependent variables, the following procedure of variable selection was applied: from the non-restricted model (composed by all variables) order the variables in order of decreasing significance; compose a new regression including only the variables considered statistically significant; verify if this restricted version of the model does not result from the imposition of false (exclusion) restrictions through the G2 test (for Fractional and Tobit regressions) and F test (for linear regression); in case of rejection of the null hypothesis (H0: bi =0) compose a new regression including the next variable that presents the highest level of significance in the non-restricted (initial) model; proceed in the same way until the constrained model does not reject the null hypothesis.
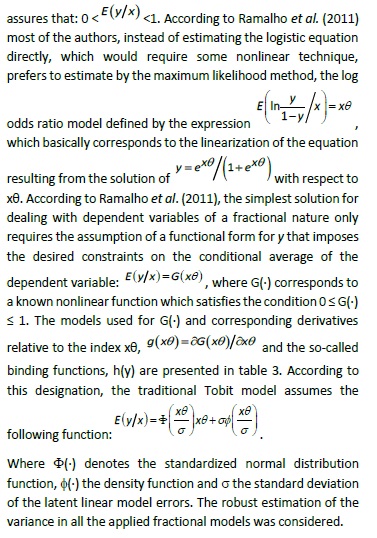
To test the specification of the restricted model obtained, the RESET test was applied, which tests the possibility of significant variables excluded from the regression. All analyzes of the significance of the explanatory variables were performed at a significance level of 95%. The application of the regressions was done through the STATA software. In order to specify the several fractional models developed by Ramalho et al. (2009; 2010; 2011) and Murteira and Ramalho (2016), summarized in table 3, consider y the fractional variable under study (with 0 ≤ y ≤ 1), x the vector of co-variables and θ the respective vector of parameters to be estimated. One of the main approaches generally applied to estimate fractional variables ignores the limited nature of y and assumes a linear type model, i.e.:

. However, since y is strictly limited to [0; 1] it is not reasonable to assume that the marginal coefficient associated with a given explanatory variable is constant over the entire interval. This is in fact why this linear type specification does not guarantee that the predicted values for y lie within the range. To circumvent this question, several authors chose to assume the logistic distribution function.
The logistic regression thus appears as an appropriate choice for proportions, given that, contrary to the linear model, it
4. Main results
The global two-stage model (DEABIG), which involves both production and intermediation efficiency, shows an average efficiency level of 69,7% and a standard deviation of 0,143.
It was considered important to compare the results obtained by the traditional regression models (Linear and Tobit) with the new fractional approach, in order to test the robustness of the results. Table 4 presents the summary of the results obtained by the application of the different types of regression models to all independent variables (non-restricted model).
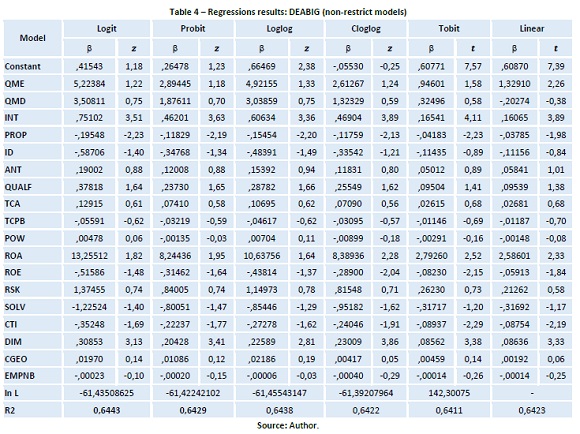
It is verified that the regression model for Logit proportions presents the highest values in relation to the determination coefficient (R2 = 64,43%), but the values obtained in the several models are quite similar. The effect of the explanatory variables is similar in all models for all variables except the POW variable that registers a positive effect on the Logit and Loglog models and negative on the other models and the QMD variable that has a negative effect on the Linear model and positive on other models.
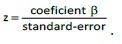
It should be noted that in the results of the fractional models the z statistic is presented for the evaluation of the significance of the variables. The statistic z reported by STATA corresponds to the Wald (W) statistic and is evaluated in a similar way to the traditional t's, namely:
All models register a significant influence on the overall two-stage efficiency levels of the INT and PROP (competitive factors group) and dimension (DIM) variables. Some variables in the financial factors group, namely ROA, ROE and CTI, are also significant in the Cloglog, Tobit and Linear models. The variables INT, ROA and DIM have a positive influence on the overall two- stage efficiency levels, while the variables PROP, ROE and CTI have a negative influence. The dimension (DIM) is one of the variables with the highest level of significance and presents a positive relation with the levels of efficiency. These results demonstrate that larger banks have higher levels of overall efficiency. The same phenomenon occurs in relation to the variable INT. The percentage of international branch offices affects overall efficiency levels in a positive way, probably because the greater dispersion of branches favors a greater ease to capture more funds from clients. These results are confirmed by the results of market share variables which, while not statistically significant, also affect efficiency levels in a positive way. There seems to be evidence that larger banks, with high levels of lending and greater capacity to raise funds, tend to have higher levels of overall efficiency.
According to other studies in this area, there is a significant positive relationship between ROA and efficiency levels. Sufian and Majid (2007) and Casu and Molyneux (2000) also show a positive relationship between efficiency levels and one of the profitability indicators and a weak explanatory power of capital ratios. Solvability (SOLV) has an inverse relationship with overall efficiency levels but is not statistically significant. Jackson and Fethi (2000) also reported this type of relationship. This can be explained by the typical risk-return trade-off of the banking sector, namely: banks with a higher capital adequacy ratio and lower risk portfolios are probably less efficient because they may eventually prefer safer (less risk) but less profitable portfolios to more profitable but riskier portfolios. The negative effect of the CTI ratio is consistent with the general financial theory that low levels of operating expenses increase efficiency and therefore increase the profitability of a financial institution.
One of the results considered unexpected is the significant negative relationship between the PROP variable and the overall efficiency levels. The results show that banks listed on the Portuguese stock exchange (or whose capital is majority owned by a listed bank) (PROP) have lower levels of overall efficiency. These results do not agree with the results obtained by other authors, such as Girardone et al. (2006) or Casu and Molyneux (2000), for example, who found that quoted banks had the highest level of efficiency. In fact, there are several studies that show a significant positive relationship between efficiency levels and indicators related to the value of stock prices, suggesting some "added value" in terms of efficiency for listed banks (Casu and Molyneux, 2000) (Girardone et al., 2006) (Beccalli et al., 2006) (Pasourias et al., 2008) (Majid e Sufian, 2009) (Hadad et al., 2011). This divergence of results can be explained by the divergence in the definition of the variable, namely: whereas in several other studies this type of variable corresponds to the exclusive classification of listed banks, in this study we also classified banks whose capital is mostly owned by a bank quoted. In this way, it is also included in this classification smaller banks, specialized in certain business segments. Given that, as noted above, larger banks are the most efficient in terms of intermediation, this "break" in efficiency can be justified by the entropy effect of smaller banks belonging to the same economic group. Saghi-Zedek (2016) has found that bank ownership structure has a major effect on its performance. Her findings do not support the conjecture that ultimate controlling shareholders encourage diversification of activities to enhance their ability to extract private benefits. Instead, consistent with the conjecture of ownership breadth expertise, pyramidal ownership structure mitigates diseconomies of activity diversification, making banks enjoy higher profits and suffer fewer cost increases and lower risk when they diversify their activities. Also Tan and Floros (2013) report that Chinese bank productivity is lower in a higher developed stock market.
One of the results to highlight is the negative relationship between the ROE variable and the overall two-stage efficiency levels. The current global economic environment, which has led to increased pressures, both in regulation and in the market, to increase capital levels, implicitly reveals the low level of capital of banks. On the other hand, spending reduction policies, which are currently considered essential for the survival of institutions, have promoted the increase of results and, consequently, the joint effect of these two issues, has led to an increase in ROE in recent years. If the cut in expenditures was not restricted to expenditures associated only with non- productive and non-value-added activities, i.e., if the cuts were applied to nuclear activities and vital for the provision of banking services, the effect of these budget constraint policies may have had a very negative impact on the overall efficiency of banking institutions. The results also show that banks with a higher percentage of younger employees (ID) have lower levels of efficiency. Lack of professional experience may explain these results. This fact seems to be confirmed by the results of the antiquity variable (ANT), which, although it has no explanatory power, has a positive effect in all models.
Given the high number of independent variables with no explanatory power, i.e. with levels of significance below the critical value of 1,96 (critical value for a significance level of 5%), it was considered necessary to determine only the variables with significant explanation power over the dependent variables. Table 5 shows the results obtained in the restricted models. It is verified that the Cloglog and Linear models do not pass the RESET test, evidencing bad specification. The effect of explanatory variables is similar across all models for all variables.
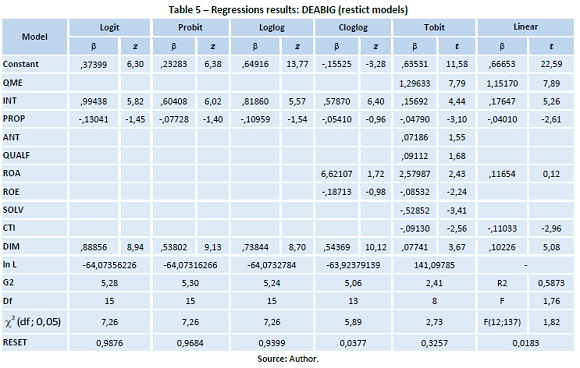
Regarding the models that do not show bad specification: all models have a significant positive influence on the overall two- stage efficiency levels of the INT and DIM variables. The variable PROP, which registers a negative influence, is included in all models but is only statistically significant in the Tobit model.
The variables QME and ROA are positive and significantly related to the overall efficiency and the ROE, SOLV and CTI variables have a significant negative influence only in the Tobit model.
5. Conclusion
In summary, and in relation to the nature of the effects or relationships between the explanatory variables and the overall two-stage efficiency level, the following results are highlighted by the application of the different types of regression models:
- Fractional regression models show evidence of better specification relative to the linear model;
- Regression models for Logit and Loglog ratios show the highest values of determination coefficient (R2 = 64,4%) in the non-restricted model, but the values obtained in the several fractional models are quite similar;
- The effect of explanatory variables is similar in all models for all variables, except for QMD and POW variables, but these variables are not significant in any model;
- Restricted models have a significant positive influence on the overall two-stage efficiency levels of the INT and DIM variables and the non-significant negative of the PROP variable.
The significant positive influence of the DIM and INT variables reflects that larger banks (DIM) and greater percentage of international branches representations (INT) present higher levels of overall two-stage efficiency. The greater dispersion of branches seems to favor a greater easiness to capture funds from clients, with Portuguese banks benefiting from the competitive advantages usually aimed to internationalization.
The fact that the maintenance of a distribution network consisting of numerous branches represents, from a resource management perspective, a higher level of operational expenditure, seems to contradict the results obtained. One possible explanation may be the weak level of use of the Internet or other means of distance communication registered in the Portuguese banking sector. According to the study by Seidel and Almqvist (2008), the most efficient European banks, essentially the Nordic ones, rely on a high degree of use of the Internet as a sales channel and other services. According to this study, Portugal has one of the lowest Internet usage rates in the sample of banks analyzed. In this way, a greater number of branches is the alternative way to compensate the fundraising and provision of services to the clients.
One of the results considered unexpected is the negative relation between the PROP variable and the efficiency levels. There is the idea that listed banks will necessarily be more efficient due to the greater public exposure of their market indicators, which may exert more pressure on bank managers to manage more efficiently in terms of efficiency indicators. As mentioned previously, these unexpected results can be explained by the inclusion in this classification of the smaller banks belonging to the same economic group, specialized in certain business segments, which, being less efficient, promote some entropy effect in the process.
The direct comparison of the results obtained with the results of other empirical studies was difficult or, in most cases, impossible to do, given the inexistence of studies that combine the application of the fractional regression models with the complementary DEA scores in the banking sector. On the one hand, we do not know the existence of studies using complementary DEA scores, such as the overall two-stage efficiency scores. The difficulty in comparing results derives from the fact that the same variable registers different effects in different efficiency levels and/or in different regression models, and the direct comparison between studies with different methodological applications is not correct.
REFERENCES
Banker, R., Charnes & Cooper (1984). Some models for estimating technical and scale inefficiencies in data envelopment analysis. Management Science, 30(9), 1078-1098. [ Links ]
Beccalli, E., Casu & Girardone (2006). Efficiency and stock performance in European Banking. Journal of Business Finance & Accounting, 33(1- 2), 245-262. [ Links ]
Casu, B. & Molyneux (2000). A comparative study of efficiency in European banking. Financial Institutions Center, Working Papers nº 17. [ Links ]
Charnes, A., Cooper & Rhodes (1978). Measuring the efficiency of decision making units. European Journal of Operational Research, 2, 429-444. [ Links ]
Charnes, A., Cooper & Rhodes (1981). Evaluating program and managerial efficiency: an application of Data Envelopment Analysis to program follow through. Management Science, 27(6), 668-697. [ Links ]
Chen, Y. & Zhu (2004). Measuring Information Technology's indirect impact on firm performance. Information Technology and Management, 5(1-2), 9-22. [ Links ]
Coelli, T., Rao & Battese (1998). An Introduction to Efficiency and Productivity Analysis. Kluwer Academic Publishers. [ Links ]
Debreu, G. (1951). The coefficient of resource allocation. Econometrica, 19(3), 273-292. [ Links ]
Farrell, M. (1957). The measurement of productive efficiency. Journal of the Royal Statistical Society, 120, 253-281. [ Links ]
Girardone, C., Molyneux & Gardener (2006). Analyzing the determinants of bank efficiency: the case of Italian banks. Instituto Valenciano de Investigaciones Económicas, Retrieved February 7, 2011 from http://www.ivie.es/downloads/ws/ireb/ponencia04.pdf. [ Links ]
Hadad, M., Hall, Kenjegalieva, Santoso & Simper (2011). Banking efficiency and stock market performance: an analysis of listed Indonesian banks. Review of Quantitative Finance and Accounting, 37(1), 1-20. [ Links ]
Hoff, A. (2007). Second stage DEA: Comparison of approaches for modeling the DEA score. European Journal of Operational Research, 181(1), 425-435. [ Links ]
Jackson, P. & Fethi (2000). Evaluating the technical efficiency of Turkish commercial banks: an application of DEA and Tobit analysis. Efficiency and Productivity Research Unit, University of Leicester.
Kao, C. & Hwang (2008). Efficiency decomposition in two-stage Data Envelopment Analysis: an application to non-life insurance companies in Taiwan. European Journal of Operational Research, 185(1), 418-429. [ Links ]
Koopmans, T. (1951). An analysis of production as an efficient combination of activities, Activity Analysis of Production and Allocation. Cowles Commission for Research in Economics, Monograph 13, New York: Wiley.
Majid, M. & Sufian (2009). Bank efficiency and share prices in China: empirical evidence from a three-stage banking model. International Journal of Computational Economics and Econometrics, 1(1), 23-47. [ Links ]
Martins, A. (2009). Measuring the Efficiency of Banks using a Two-stage DEA Model. Encontros Científicos - TMS, 5, 114-129. [ Links ]
Martins, A. (2010). Banks in Portugal: service producers or financial intermediaries? Encontros Científicos - TMS, 6, 131-145. [ Links ]
McDonald, J. (2009). Using least squares and Tobit in second stage DEA efficiency analyses. European Journal of Operational Research, 197(2), 792-798. [ Links ]
Murteira, J. & Ramalho (2016). Regression analysis of multivariate fractional data. Econometric Reviews, 35(4), 515-552. [ Links ]
Papke, L. & Wooldridge (1996). Econometric methods for fractional response variables with an application to 401(k) plan participation rates. Journal of Applied Econometrics, 11(6), 619-632. [ Links ]
Pasourias, F., Liadaki & Zopounidis (2008). Bank efficiency and share performance: evidence from Greece. Applied Financial Economics, 18(14), 1121-1130. [ Links ]
Pedro, C., Ramalho & Silva (2017). The main determinants of banking crises in OECD countries. Review of World Economics, https://doi.org/10.1007/s10290-017-0294-0. [ Links ]
Ramalho, E. & Ramalho (2009). Alternative regression models for explaining DEA efficiency scores. Departamento de Economia - CEFAGE EU, Universidade de Évora, April.
Ramalho, E., Ramalho & Henriques (2010). Fractional regression models for second stage DEA efficiency analyses. Journal of Productivity Analysis, 34(3), 239-255. [ Links ]
Ramalho, E., Ramalho & Murteira (2011). Alternative estimating and testing empirical strategies for fractional regression models. Journal of Economic Surveys, 25(1), 19-68. [ Links ]
Saghi-Zedek, N. (2016). Product diversification and bank performance: Does ownership structure matter? Journal of Banking & Finance, 71, 154-167. [ Links ]
Seidel, G. & Almqvist (2008). Value in Focus - Achieving cost-efficiency in the European banking sector. Arthur D. Little - Financial Services. [ Links ]
Seiford, L. & Zhu (1999). Profitability and marketability of the top 55 US commercial banks. Management Science, 45(9), 1270-1288. [ Links ]
Sufian, F. & Majid (2007). Bank Mergers Performance and the Determinants of Singaporean Banks Efficiency - an application of two- stage banking models. Gadjah Mada International Journal of Business, 9(1), 19-39. [ Links ]
Tan, Y. & Floros (2013). Risk, capital and efficiency in Chinese Banking. Journal of International Financial Markets, Institutions & Money, http://dx.doi.org/10.1016/j.intfin.2013.07.009. [ Links ]
Thanassoulis, E. (2003). Introduction to the Theory and Application of Data Envelopment Analysis: a foundation text with integrated software. 2nd Edition, Kluwer Academic Publishers. [ Links ]
Wang, C., Gopal & Zionts (1997). Use of DEA in assessing Information Technology impact on firm performance. Annals of Operations Research, 73, 191-213. [ Links ]
Zhu, J. (2009). Quantitative Models for Performance Evaluation and Benchmarking - Data Envelopment Analysis with Spreadsheets. 2nd Edition, Springer. [ Links ]
Received: 15.12.2017
Revisions required: 12.02.2018
Accepted: 10.04.2018

