


Serviços Personalizados
Journal
Artigo
 Inglês (pdf)
 Artigo em XML
 Referências do artigo
 Enviar este artigo por email
Indicadores
-
 Citado por SciELO
 -
 Acessos
Links relacionados
-
 Similares em
SciELO
Similares em
SciELO
Compartilhar

 Permalink
Tourism & Management Studies
versão impressa ISSN 2182-8458versão On-line ISSN 2182-8466
TMStudies vol.13 no.2 Faro jun. 2017
TOURISM: SCIENTIFIC PAPERS
Predicting hotel booking cancellations to decrease uncertainty and increase revenue
Previsão de cancelamentos de reservas de hotéis para diminuir a incerteza e aumentar a receita
*Nuno Antonio, ** Ana de Almeida. *** Luis Nunes
*ISCTE, Instituto Universitário de Lisboa, Av. das Forças Armadas, 1649-026 Lisbon, Portugal, nuno_miguel_antonio@iscte.pt
**ISCTE Instituto Universitário de Lisboa, CISUC, Av. das Forças Armadas, 1649-026 Lisbon, Portugal, ana.almeida@iscte.pt
***ISCTE, Instituto Universitário de Lisboa, Instituto de Telecomunicações, ISTAR, Av. das Forças Armadas, 1649-026 Lisbon, Portugal, luis.nunes@iscte.pt
ABSTRACT
Booking cancellations have a substantial impact in demand-management decisions in the hospitality industry. Cancellations limit the production of accurate forecasts, a critical tool in terms of revenue management performance. To circumvent the problems caused by booking cancellations, hotels implement rigid cancellation policies and overbooking strategies, which can also have a negative influence on revenue and reputation.
Using data sets from four resort hotels and addressing booking cancellation prediction as a classification problem in the scope of data science, authors demonstrate that it is possible to build models for predicting booking cancellations with accuracy results in excess of 90%. This demonstrates that despite what was assumed by Morales and Wang (2010) it is possible to predict with high accuracy whether a booking will be canceled.
Results allow hotel managers to accurately predict net demand and build better forecasts, improve cancellation policies, define better overbooking tactics and thus use more assertive pricing and inventory allocation strategies.
Keywords: Data science, hospitality industry, machine learning, predictive modeling, revenue management.
RESUMO
O cancelamento de reservas tem um impacto substancial nas decisões de gestão da procura na industria hoteleira. Os cancelamentos limitam a produção de previsões precisas, uma ferramenta crítica em termos de desempenho de gestão da receita. Para limitar os problemas causados pelo cancelamento de reservas, os hotéis implementam políticas de cancelamento rígidas e estratégias de overbooking, as quais podem vir a ter influência negativa sobre a receita e reputação social. Usando conjuntos de dados de quatro hotéis de resort e abordando a previsão de cancelamento de reservas como um problema de classificação no âmbito da Data Science, os autores demonstram que é possível construir modelos para prever cancelamentos de reservas com resultados superiores a 90%. Estes resultados permitem demonstrar que apesar do que foi assumido por Morales e Wang (2010) é possível prever com alta precisão se uma reserva será cancelada. Os resultados permitem que os hoteleiros prevejam com melhor precisão a procura líquida e construam melhores previsões, melhorem as políticas de cancelamento, definam melhores táticas de overbooking e usem estratégias de alocação de inventário com preços mais assertivos.
Palavras Chave: Data science, hotelaria, aprendizagem automática, modelos preditivos, gestão da receita.
1. Introduction
Revenue management is defined as “the application of information systems and pricing strategies to allocate the right capacity to the right customer at the right price at the right time” (Kimes & Wirtz, 2003, p. 125). Originally developed in 1966 by the aviation industry (Chiang, Chen, & Xu, 2007), revenue management was gradually adopted by other services industries, such as hotels, rental cars, golf courses, and casinos (Chiang et al., 2007; Kimes & Wirtz, 2003). In the hospitality industry (rooms division), revenue management definition was adapted to “making the right room available for the right guest and the right price at the right time via the right distribution channel” (Mehrotra & Ruttley, 2006, p. 2).
Since hotels have a fixed inventory and sell a perishable “product”, as a way to make the right room available to the right guest, at the right time, hotels accept bookings in advance. Bookings represent a contract between a customer and the hotel (Talluri & Van Ryzin, 2004). This contract gives the customer the right to use the service in the future at a settled price, usually with an option to cancel the contract prior to the service provision. Although advanced bookings are considered the leading predictor of a hotel's forecast performance (Smith, Parsa, Bujisic, & van der Rest, 2015), this option to cancel the service puts the risk on the hotel, as the hotel has to guarantee rooms to customers who honor their bookings but, at the same time, has to bear with the opportunity cost of vacant capacity when a customer cancels a booking or does not show up (Talluri & Van Ryzin, 2004). Even tough there are some differences between no-shows and cancellations, for the purpose of this research both will be treated as cancellations. A cancellation occurs when the customer terminates the contract prior to his or her arrival and a no-show occurs when the customer does not inform the hotel and fails to check in.
Certainly, some of these booking cancellations occur by comprehensible reasons: business meetings changes, vacations rescheduling, illness, bad weather conditions and other factors. But, as identified by Chen and Xie (2013) and Chen, Schwartz, and Vargas (2011), nowadays, a big part of these cancellations occur because of deal-seeking customers who are determined in the search for best deals. Sometimes, these customers continue to search for better deals of the same product/service after having placed a booking. In some cases, customers even make multiple bookings to preserve their options and then cancel all except one (Talluri & Van Ryzin, 2004). As Talluri and Van Ryzin (2004, p. 130) explain “customers also value the option to cancel reservations. Indeed, a reservation with a cancellation option gives customers the best of both worlds-the benefit of locking-in availability in advance and the flexibility to renege should their plans or preferences change”.
As a way to manage the risk associated to booking cancellations, hotels implement a combination of overbooking and cancellation policies (C.-C. Chen et al., 2011; C.-C. Chen & Xie, 2013; Mehrotra & Ruttley, 2006; Smith et al., 2015; Talluri & Van Ryzin, 2004). However, both overbooking and cancellation policies can be prejudicial to the hotel. Overbooking, by not allowing the customer to check in at the hotel he or she previously booked, forces the hotel to deny service provision to the customer, which can be a terrible experience for the customer. This experience can have a negative effect on both the hotel's reputation and immediate revenue (Noone & Lee, 2011), not to mention the potential loss of future revenue from discontent customers who will not book again to stay at the hotel (Mehrotra & Ruttley, 2006). Cancellation policies, especially non-refundable policies, have the potential not to only reduce the number of bookings, but to also to diminish revenue due to their significant discounts on price (Smith et al., 2015).
To overcome the negative impact caused by overbooking and the implementation of rigid cancellation policies to cope with booking cancellations, that can represent up to 20% of the total bookings received by hotels (Morales & Wang, 2010) or up to 60% in airport/roadside hotels (Liu, 2004), it is proposed by the authors the use of a technological framework grounded in a booking cancellation prediction model, developed in the scope of data science. This model, by predicting the probability of each booking to be canceled, could help produce better forecasts and reduce uncertainty in management decisions. This is very important in the context of revenue management, for inventory allocation and pricing decisions (Mehrotra & Ruttley, 2006; Talluri & Van Ryzin, 2004), but also important in other management contexts like staffing, supplies purchases or profitability/cash flow decisions (Hayes & Miller, 2011). At the same time, by developing a classification prediction model, i.e., a model that classifies each booking likelihood of being canceled, enable hotels to act upon those specific bookings to try to avoid their cancellation, or in some cases, force it.
Development of a booking cancellation prediction model is in accordance to what was recognized by Chiang et al. (2007) that revenue management should make use of mathematical and forecast models to take better advantage of the available data and technology. This is also supported in a study carried out on five hundred revenue management professionals by Kimes (2010). This study shows that revenue management will be increasingly strategic and technologically oriented and that revenue management professionals should have better analytical and communication skills. The study identified that all revenue management professionals should possess analytical and communication skills, which are precisely the skills that are at the root of data science: applied mathematics, operational research, machine learning, statistics, databases, data mining, data visualization, and excellent communication/presentation fluency, complemented with a deep understanding of the problem domain (Dhar, 2013; O'Neil & Schutt, 2014; Yangyong & Yun, 2011). As a fairly new discipline, data science takes advantage of the vast amounts of data at our disposal and the availability of better and cheaper computational power. These factors made possible the improvement of existing prediction algorithms and contributed to the development of new and better algorithms, particularly in the field of machine learning.
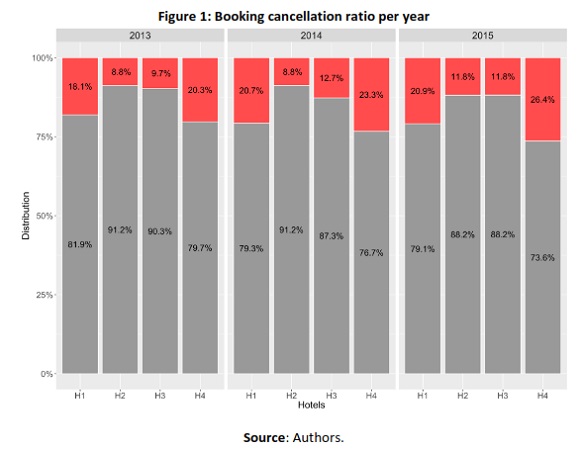
Using uncensored data from four resort hotel's Property Management Systems (PMS) (region of Algarve, Portugal) representing this tendency for hotels to have increasingly higher booking cancellations rates (illustrated in Figure 1), this paper aims to demonstrate how data science can be applied in the context of hotel revenue management to predict bookings cancellations. Moreover, show that booking cancellations do not necessarily mean uncertainty in forecasting room occupation and forecasting revenue. This is achievable by:
1. Identifying which features in hotel PMS's databases contribute to predict a booking cancellation probability.
2. Building a model to classify bookings with high cancellation probability and using this information to forecast cancellations by date.
3. Understanding if one prediction model fits all hotels or if a specific model has to be built for each hotel.
2. Literature review
Mehrotra and Ruttley (2006) recognized that “Good demand forecasting is a key aspect of revenue management” (p. 8). Talluri and Van Ryzin (2004) also acknowledged forecasting importance in revenue management declaring that revenue management systems require forecast of quantities and that “its performance depends critically on the quality of these forecasts” (p. 407). These authors and others like Ivanov and Zhechev (2012) or Morales and Wang (2010), identified demand forecast as one the aspects where forecasting is important. Behind this need to forecast demand are booking cancellations, because, in the hospitality industry as in other service industries that work with advanced bookings, these do not represent the true demand for their services, since there is frequently a considerable number of cancellations (Liu, 2004; Morales & Wang, 2010). Net demand - demand discounted of cancellations needs to be accurately forecasted so that appropriate demand-management decisions can be made.
Booking cancellations already have a well known body of knowledge in the scope of revenue management applied to service industries, and in particular to the hospitality industry. Nevertheless, in recent years, with the increasingly influence of the internet on the way customer's search and buy travel services (Anderson, 2012; C.-C. Chen et al., 2011; Noone & Lee, 2010), research in this topic has increased, particularly research on topics related to the controls used to mitigate the effects of cancellations in revenue and inventory allocation, cancellation policies and overbooking (Hayes & Miller, 2011; Ivanov, 2014; Talluri & Van Ryzin, 2004). Nevertheless, there is few literature on the subject of booking cancellation forecast for the hospitality industry. Apart from the works of Huang, Chang, Ho, & others (2013) who uses restaurant data, Yoon, Lee, and Song (2012), who uses hotel simulated data, and Liu (2004), who uses real hotel data, all other works use PNR-Personal Name Record data-a standard developed by the International Air Transport Association (International Civil Aviation Organization, 2010). Use of PNR data is not a strange practice as cancellations forecast research is mostly available for the airline industry or is non-industry specific but uses airline data (Garrow & Parker, 2008; Gorin, Brunger, & White, 2006; Hueglin & Vannotti, 2001; Iliescu, Freisleben, & Gleichmann, 1993; Lawrence, 2003; Lemke, Riedel, & Gabrys, 2009; Neuling, Riedel, & Kalka, 2004; Subramanian, Stidham, & Lautenbacher, 1999; Yoon et al., 2012).
This predominance of works concerning the airline industry could be explained not only because of the longer application of revenue management but also because of the high rate of cancellations and no-shows on airline bookings, which represent 30% (Phillips, 2005) to 50% (Talluri & Van Ryzin, 2004) of all bookings. Although air travel and hospitality are both service industries and have many similarities, there are aspects that distinguish them, such as the factors that drive customers to select their service providers. In the airline industry key factors are price, quality of service (in flight), airline image (specially in terms of safety), loyalty programs, and accessibility to transport hubs at the end destination (A. H. Chen, Peng, & Hackley, 2008; Park, Robertson, & Wu, 2006), while in the hospitality industry the importance of these factors changes and other factors, such as social reputation, location, cleanliness, come into play.
In the scope of data science, specifically in the field of machine learning, supervised predictive modeling problems are usually divided in two type of problems (Hastie, Tibshirani, & Friedman, 2001): regression, when the outcome measurement is quantitative (e.g. forecasting bookings cancellation percentage of the total of bookings), or as a classification, when the outcome is a class/category (e.g. predicting if a specific booking “will cancel” or “will not cancel”).
While some of the previous published works on booking cancellations prediction approach it as a classification problem, most works consider it a regression problem. Yet, even some of the former, such as Morales and Wang (2010), focused on global cancellation rate forecast and not on each booking cancellation probability. In fact, Morales and Wang stated that “it is hard to imagine that one can predict whether a booking will be canceled or not with high accuracy simply by looking at PNR information” (p. 556). However, as presented in the following sections, classification of whether a booking will be canceled is possible, especially if suitable PMS data is used in combination with the current existing machine learning prediction algorithms. One other reason to treat bookings' cancellation forecast as a classification prediction problem is that, from the class/category prediction outcome, is possible to reach a quantitative outcome as well. For example, the sum of bookings predicted as “will cancel” in a particular day can be deduct from demand and obtain net demand, or calculate bookings cancellation rate, by dividing the total of bookings predicted as likely to be canceled by the total number of bookings for the day.
Morales and Wang (2010) also stated that “in the revenue management context, the classification or even probability of cancellation of an individual booking is not important” (p. 556), which is not in accordance with what is commonly asserted in revenue management theory. In revenue management, registering cancellations, at least by market segments or type of bookings, is an essential tool to identify patterns and with it create better forecasts (Ivanov, 2014; Mehrotra & Ruttley, 2006) and better overbooking and cancellation policies. In terms of overbooking, as described by Talluri & Van Ryzin (2004), the reason for this, “from a historical standpoint, overbooking is the oldest - and, in financial terms, among the most successful - of revenue management practices” (p. 129). In the past, some authors considered rigid cancellations policies an effective tool against cancellations (DeKay, Yates, & Toh, 2004) (policies that required full payment or some sort of warranty at the moment of booking or, at least, imposed some kind of financial penalties in case of cancellation). Nowadays, cancellation policies that impose these kind of penalties or impose strict cancellations terms are considered a sales inhibitor and can have negative impact on revenue (C.-C. Chen et al., 2011; Smith et al., 2015; Xie & Gerstner, 2007).
By using data science to develop a model to forecast booking cancellations as an increasingly important problem in the context of revenue management, and as a part of a revenue system framework, this research demonstrates the prominence of combining science and technology in the decision making process, taking advantage of was recognized by Talluri and Van Ryzin (2004) that “science and technology now make it possible to manage demand on a scale and complexity that would be unthinkable through manual means” (p. 5).
3. Methodology
3.1 Data characterization and used methods
As mentioned previously, this paper uses real booking data from four hotels located in the resort region of the Algarve, Portugal. Data spans from the years of 2013 to 2015. Since, as would be expectable, all hotels required anonymity, hereinafter they will be designated as H1 to H4. For the sake of better understanding the demand and market of these hotels, some details on facilities and services are provided. All four hotels are four-star and five-star resort hotels, ranging in size from 86 to 180 rooms. All four hotels have at least one bar and one restaurant. H2 and H3 are mixed-ownership units-besides renting units owned by the hotels' management companies, these hotels also rent units that were sold in timeshare or factional ownership schemes. Summer months, from July to September, are considered high season. H1 closes temporarily during low season, but not regularly. H4 also closed for renovations during a small period of time.
CRoss-Industry Standard Process for Data Mining (CRISP-DM) (Chapman et al., 2000) was the applied methodology in the execution of this research. CRISP-DM is one of the most-used process models in predictive analytics projects (Abbott, 2014). CRISP-DM provides a six-step process: business understanding, data understanding, data preparation, modeling, evaluation, and deployment. The following sections offer a succinct description of the execution of each of these steps.
3.2 Business understanding
As presented in Figure 1, in the four studied hotels, booking cancellations have been increasing since 2013, with thw exception of H3 when, from 2014 to 2015, the hotel imposed a more rigid cancellation policy. In 2015, booking cancellation rates ranged from 11.8% to 26.4%, which are in harmony with what was observed by Morales & Wang (2010).
Forecast demand in long term (in a period much longer than the average lead time), should be treated as a regression problem because it will most likely build a prediction model based on historic cancellation rates and not on bookings “on-the-books”. This type of prediction modeling is where most research is focused. By contrast, to determine a more accurate forecast, one should forecast demand in the short-to midterm and view it as a classification prediction problem (i.e., “Is this booking going to be canceled?”).
Acting on bookings marked as having a high probably of being canceled can go from offering hotel services (e.g., spa treatments, free dinner or airport transfer) to discounts in certain services or entrances to local amusement parks. These actions could mitigate booking cancellations and therefore reduce the hotel's risk. These actions generate costs for the hotel, but by reducing the need to overbook, or at least, by enabling a better overbooking policy, the costs related to .
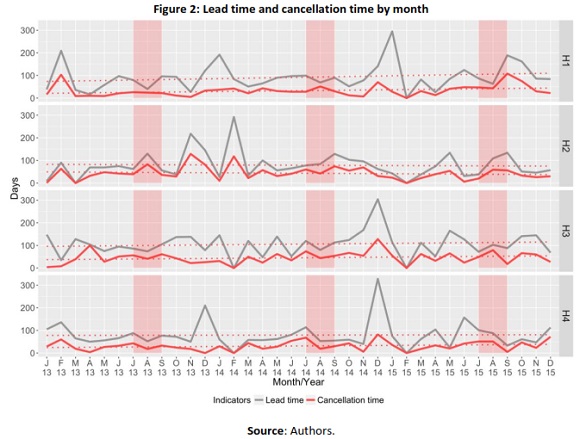
overbooking will also decrease. Moreover, by reducing uncertainty, pressure is taken from pricing and inventory allocation decisions. Acting on bookings marked with a high probability of being canceled should occur in the time gap between the time the booking is placed at the hotel and the expected arrival date. As illustrated in Figure 2, on average, for each of the four hotels, during the span of the 3 years, cancellations occurred respectively, 25, 54, 33, and 55 days after bookings were made. Surprisingly, it is not during months of high demand (the high-season months highlighted in Figure 2) that lead time and cancellation time are higher. In fact, these times are higher when there are special events in the region than during high season.
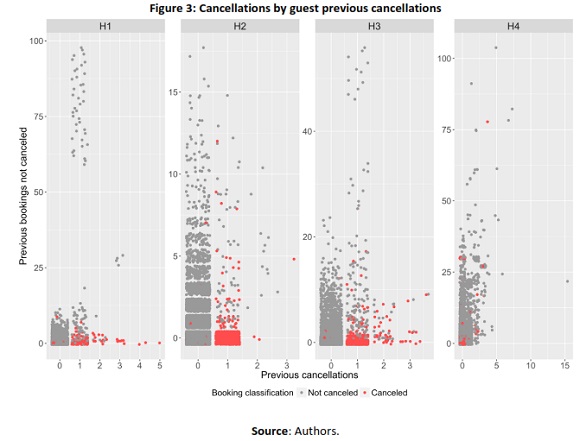
Other examples on how booking cancellations patterns are different in each hotel, could be seen in Figure 3 and in Figure 4. In both these figures, each dot represents a booking. In Figure 3 it is possible to see that most cancellations were made by guests who had already had one previous cancellation and also had less than 5 non canceled bookings. It was also possible to see that customers with a high number of previous bookings at the hotel, rarely canceled. Yet, the maximum number of cancellations per guest or previous bookings are different in each hotel.
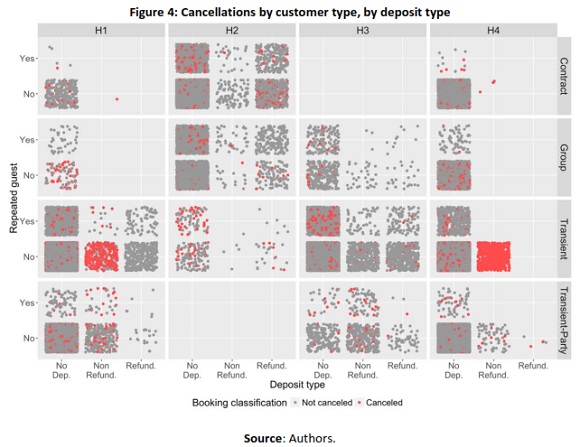
In Figure 4 it is possible to verify that the type of customer (contract, group, transient or transient-party) and the deposit type made by them to guarantee the booking (no deposit, non-refundable/paid totally in advance or partially paid) as also different behaviors in terms of cancellations.
As shown in Figure 3 and Figure 4, data visualization, is an essential tool of data science to better understand the business aspects, in this case, booking cancellations patterns. Understanding cancellation patterns is one of the reasons why the development of a model for classifying bookings with high cancellation probability is important. To accomplish this and to help further a better understanding of net demand, model(s) should achieve a prediction accuracy above 0.8 and an area under the curve (AUC) also above 0.8, which is commonly considered a good prediction result (Zhu, Zeng, & Wang, 2010)
3.3 Data understanding
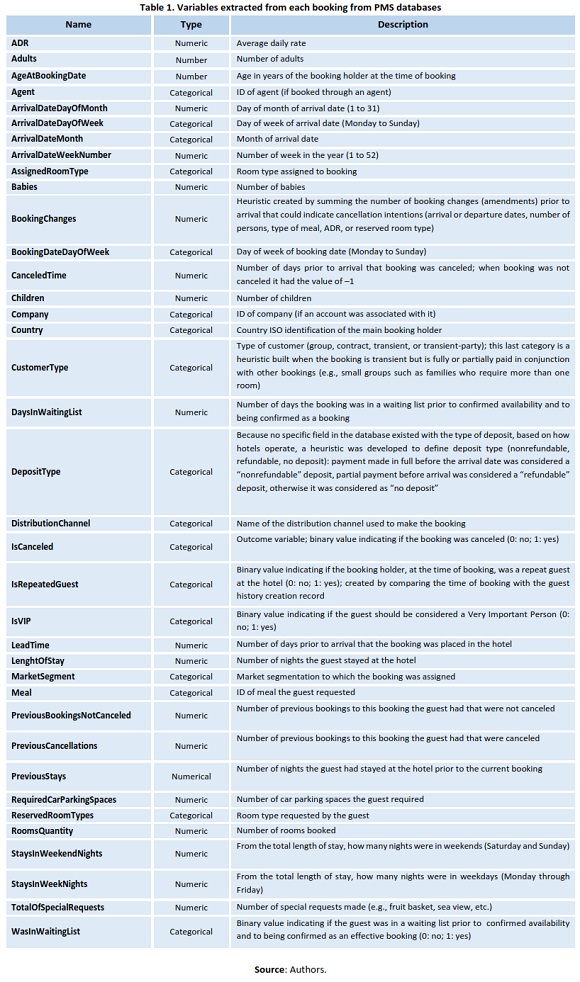
Data were collected directly from the hotels' PMS databases using Microsoft SQL Server. All hotels used the same PMS application and therefore had the same database structure, but it was necessary to understand the database design and particularities of each hotel's data prior to building the data extraction queries. Selection of features to predict the probability of a booking being canceled started here. Table 1 presents a list of all variables extracted. These variables were chosen based on prior literature, but they also took into account the richness of data available in the PMS databases when compared to a PNR database. PNR database structure was built for the airline industry and thus it does not have fields or variables that are specific to the hotel industry. But, as recognized in data science and advocated by Guyon and Elisseeff (2003), extensive domain knowledge was fundamental to understand this data and to conduct a good variable selection.
As acknowledged in data science literature, domain knowledge is essential to select the best predictor variables and to avoid some prediction model “traps”:
• The curse of dimensionality: when the amount of data conjugated with a high number of predictor variables requires a high computational cost (Abbott, 2014). As a consequence, as advised by O'Neil and Schutt (2014), only variables that were considered relevant and useful for prediction were selected.
• Correlation: as described by Guyon and Elisseeff (2003): “Perfectly correlated variables are truly redundant in the sense that no additional information is gained by adding them” (p. 1164). Therefore, some variables were not included as they would be perfectly correlated (e.g., all studied hotels only assign room numbers to bookings on guest arrival; consequently, all non canceled bookings would have a room number and canceled bookings would not). Even so, some known high correlated variables were selected because, in some cases, this high correlation “does not mean absence of variable complementarity” (Guyon & Elisseeff, p. 1164).
• Leakage: all created variables considered the possible leaking of future information. All created variables represent the value at the time of booking and not the value at the time of data extraction. For example, “IsRepeatedGuest,” a binary indicator if a customer prior to a particular booking stayed at the hotel, should have the value of 0 (no) in the first booking of that specific guest. Only on subsequent bookings from the same guest should this variable assume the value of 1 (yes).
Exploration of the resulting data sets was executed in R. Resulting data sets had 20 522, 9 809, 9 365, and 33 445 observations, respectively, from H1 to H4. This exploration revealed both differences and similarities among the hotels, particularly in: marketing/segmentation classification, meal types, cancellation ratios, correlation of variables and operations similarities. Data exploration also revealed that, over all of the hotels, the total amount lost due to cancellations in the years from 2013 to 2015 was in excess of 1.3, 2.2, and 2.7 millions of Euros, per year, respectively.
This data-mining step was complemented with a data quality verification. To do that, R package “dataQualityR” was used. This verification showed some data quality problems, some of which were common to all of the hotels: “LeadTime,” “LenghtOfStay,” and “PreviousStays” were positively skewed in terms of distribution. This is a problem usually solved by implementing a transformation function (e.g., Log10), but in this case the authors found that algorithms worked better without transformation. “ReservedRoomType” and “AssignedRoomType” did not seem to have any correlation to booking cancellations. “IsVIP” had very few observations.
There were also data quality problems specific to some of the hotels. “ADR,” “Country,” “ReservedRoomType,” and “AssignedRoomType” variables had missing values or outliers. Higher numbers of “Adults” and “Children” in some of the hotels, were related to higher numbers in “RoomsQuantity” and canceled bookings.
Finally, it was also verified that some variables were not used in some of the hotels, such as “MarketSegment,” “RequiredCarParkingSpaces,” “TotalOfSpecialRequests,” and “DaysInWaitingList.”
3.4 Data preparation
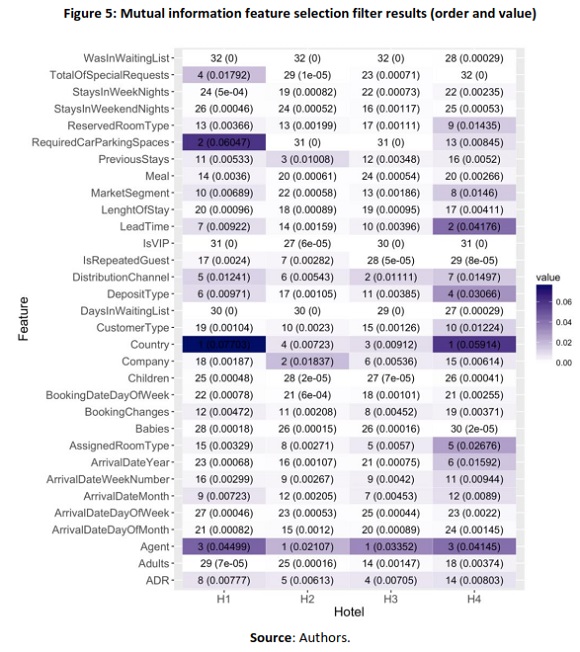
This step took advantage of the data exploration and quality verification made earlier to create the final data sets to be used in the prediction model development. It started with the removal from the original data sets of observations (rows) and variables (columns) based on the previous considerations. To validate this process for data selection, the “mutual information feature selection filter” was used. This filter measures the contribution of a predictor variable toward uncertainty about the value of the outcome variable; it is a very effective filter in the selection of features for nonlinear models (Tourassi, Frederick, Markey, & Floyd, 2001). Application of this filter in each hotel data set, as illustrated in Figure 5, demonstrated that the order and importance of booking cancellations for each predictor variable differ from hotel to hotel.
Based on the additional information provided by the application of the chosen filter and the results of tests on the computational power required for the model, it was decided to remove the variables “BookingDateDayOfWeek” and “ArrivalDateDayOfWeek.” The columns “PreviousBookingsNotCanceled,” “PreviousCancellations,” and “PreviousStays” were also removed from all data sets and substituted with a derived feature called “PREPPreviousCancellationRatio” that was calculated by dividing “PreviousCancellations” by the sum of “PreviousBookingsNotCanceled” with “PreviousCancellations.”
3.5 Modeling and evaluation
Since features had different order of contribution and weights per hotel, specific models had to be built for each hotel. For this reason, as expected in the CRISP-DM methodology, some steps were not sequential and required going back and forth, which was the case of the modeling and evaluation steps.
Microsoft Azure Machine Learning Studio was the tool used to build these models. As different algorithms present different results, new models were developed using different classification algorithms and then selecting the one(s) that present better performance indicators. Because the label “IsCanceled” could only assume binary values (0: no; 1: yes), the following two-class classification algorithms were chosen:
• Boosted Decision Tree
• Decision Forest
• Decision Jungle
• Locally Deep Support Vector Machine
• Neural Network
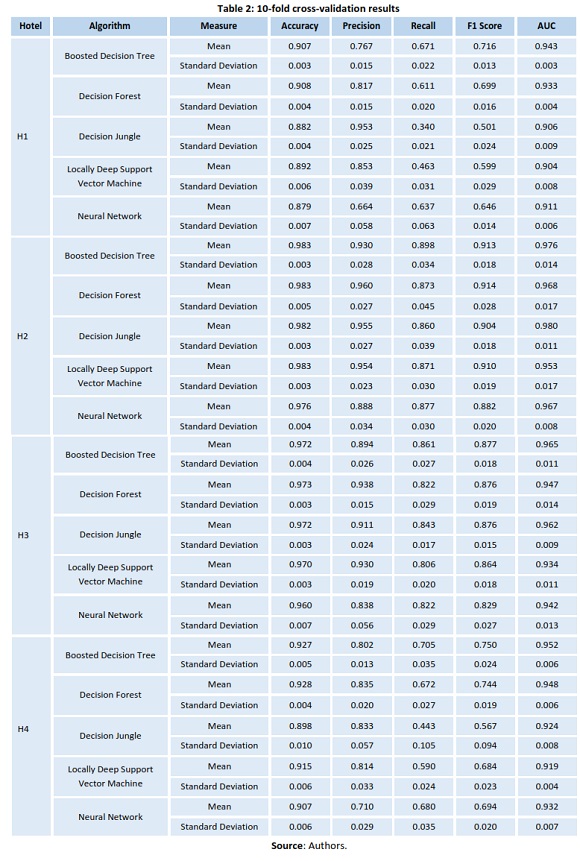
Cross-validation was used to evaluate the performance of each of the algorithms, specifically k-fold cross-validation, a well-known and widely used model assessment technique (Hastie et al., 2001). Although cross-validation can be computationally costly (Smola & Vishwanathan, 2010), it allows for the development of models that are not over fitted and can be generalized to independent data sets. K-fold cross validation works by randomly partitioning the sample data into k sized subsamples. In this research, data was divided in 10 folds - a typical number of chosen folds (Hastie et al., 2001; Smola & Vishwanathan, 2010). Then, each of the 10 folds were used as a test set and the data in the remaining 9 as training data. Performance measures were calculated for each of the 10 folds, and then, mean and standard deviation are calculated to assess the global performance of each algorithm. Table 2 presents the mean and standard deviation results by each of the algorithms.
The classification result is a continuous value between 0 and 1. It is the cutoff or threshold that defines to which class the outcome should be assigned. In this research, a fixed threshold of 0.5 was used, meaning results below 0.5 were classified as 0 (non-canceled) and all others as 1 (canceled).
Cross-validation results were auspicious. In all hotels, the lowest accuracy mean result was 87.9%, registered in H1 with the neural network algorithm, but, most algorithms reach mean accuracy values above 90%. If AUC is taken as the assessment measure this is even better, since all algorithms, for all all hotels, presented values above 90%, which are considered “excellent” values (Zhu et al., 2010). Standard deviation values also shown that there was low variance among the different folds and that the algorithms could be generalized to other data sets of the same hotel.
In terms of accuracy, Decision Forest (DF) algorithm was the best. In terms of precision, DF was also the best algorithm in 3 out of the 4 hotels. Boosted Decision Tree (BDT) presented slightly lower values in terms of accuracy and precision but was the best algorithm in 3 out of the 4 hotels regarding the other measures (Recall, F1Score and AUC). Hence, final models were built with each of these algorithms for a final assessment.
As is conventionally done in the construction of machine learning predictive models, the data set was divided into two stratified subsets, one with 70% of data for training (model learning) and another with the remaining 30% to test the developed model. The function “Tune model hyperparameters” was applied in the training set to test different combinations of each algorithm's parameters, and with that, determine the optimum parameters to use. Results of the two algorithms performance measures for the test sets are detailed in Table 3.
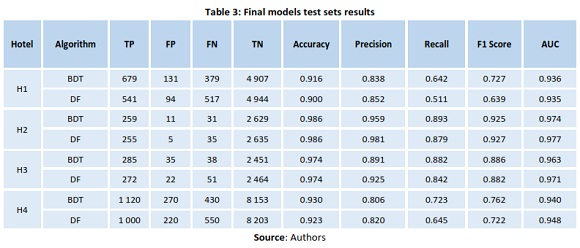
In terms of accuracy, BDT presented better or equal values than DF. In terms of F1Score, BDT also presented the better results in 3 of the 4 hotels. By contrast, in terms of AUC, DF presented the better results in 3 of the 4 hotels. Overall, although the two algorithms present slightly differences, performance of both is comparable. For H2 and H3, both reach accuracy values above 0.97 and AUC values above 0.96. For H1 and H4, results were lower than the former, but nonetheless, outstanding values.
Yet, another important measure is the number of false positives. Good results in terms of the number of false positives are important if a hotel wants to act on bookings classified as “going to be canceled”. In that case, the least “false predicts” the model generates, the least the hotel will spend in cash/services with bookings that would not have been canceled. If this is taken into account, DF algorithm should be chosen as the one to use, as it presents the lower number of false positives in all hotels.
Results seem to validate the findings of Fernández-Delgado, Cernadas, Barro, and Amorim (2014). These authors tested 179 classifiers from 17 families and concluded that the best results are usually obtained with the random forest algorithms family.
3.6 Deployment
Although the deployment of these models in a production environment was not in the scope of this research, the way they are deployed is critical to their success. For that reason, the elaboration of a framework (see Figure 6) to define how models are deployed is also an important duty of this research.
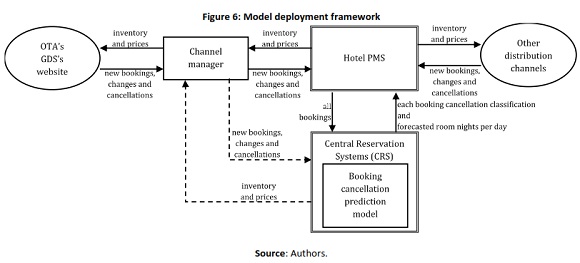
As represented in Figure 6, the booking cancellation prediction model should not be implemented by itself. In truth, if deployed independently of the hotel other systems, it is unlikely that it would present any valid results in terms of revenue management. Today's speed and complexity imposed on a hotels reservations department is such that advantages of using the model could not be clear if tasks related to the model inputs and outputs had to be done manually. For that reason, the model should be integrated on the hotel CRS. This will enable the CRS to have more accurate net demand forecasts and consequently, present better overall forecasts.
By being directly connected to the PMS, the CRS can pass to the PMS its adjusted inventory. This inventory could be then communicated by the PMS (or CRS as sometimes happens) automatically, directly or via a channel manager, to the different distribution channels (OTA's, GDS's, travel operators, hotel website, among others). This automation of the inventory allocation based on better net demand forecast enables the hotel to immediately react, in case of a booking cancellation or in case of a change in a booking cancellation classification, adjust its sale inventory and communicate it to the different distribution channels.
Regarding the deployment of these models brought attention to some considerations that should be underlined:
Some predictor variables vary with time (e.g., “LeadTime”) or can assume new values every day, as in the case of changes/amendments to bookings (e.g., “BookingChanges” or “Adults”). Thus, the model should be run every day so that all in-house bookings and results are evaluated on a daily basis.
As Abbott (2014) asserts, “Even the most accurate and effective models don't stay effective indefinitely. Changes in behavior due to new trends, fads, incentives, or disincentives should be expected” (p. 618). For example, when a hotel changes its marketing efforts and starts to capture more market from online travel agencies instead of traditional tour operators, this could influence many predictor variables, such as “MarketSegment,” “DistribuitonChannel,” and “LeadTime.” If the model is not revised, its performance will not stay at the same level.
4. Discussion
Despite what was alleged by Morales and Wang (2010), the presented results unquestionably demonstrate that features extracted and derived from bookings in the hotels' PMS databases are a good source to predict, with high accuracy, if bookings are going to be canceled. Accuracy reached 98.6% in H2 and reached values above 90% in all other hotels.
These results confirm that it is possible to identify bookings with a high likelihood of being canceled. This makes it possible for hotel managers to take measures to avoid these potential cancellations, such as offering services, discounts, entrances to shows/amusement parks, or other perks. However, this cannot be applied to all customers because some are insensitive to these kinds of offers (e.g., corporate guests). Yet, there is more to be gained from building and deploying this prediction model. By running the model each day against all in-house bookings, it is possible to obtain another important result: the number of room nights predicted to be canceled for each of the following days. It is only necessary to add the number of bookings predicted as going to be canceled by night. Hotel managers can deduce this value of their demand calculating their net demand. When provided with a more accurate value of net demand, hotel managers can develop better overbooking and cancellation policies, which would result in fewer costs and decreased risk.
Nevertheless, to build a booking cancellation model, suitable data and a good selection of features are crucial. As mentioned earlier and illustrated in Figure 5, not all features have the same order of importance, nor do they contribute the same way to predict if a booking is going to be canceled. This calls for a specific characterization from each hotel. Hotel location, services, facilities, nationality of guests, markets, and distribution channels are among the many features with different weight for predicting cancellation. One example of this is the feature “RequiredCarParkingSpaces.” It is ranked in second place for H1 and 13th for H4 but had no importance in terms of H3 and H4. This is easily understandable if one knows these hotels' operations, as H2 and H3 do not have such limited car parking spaces as H1 and H4. Therefore, hotel revenue management and general business domain knowledge are not enough to undertake a good selection of features. It is also essential to understand each hotel's particular operation and characteristics. This can make a difference in terms of final model performance and adequacy.
As with any other predictive analytics problem, developing a model to predict booking cancellations requires that data meet all of the attributes of quality data: accurate, reliable, unbiased, valid, appropriate, and timely (Rabianski, 2003). As previously mentioned, some of the data sets had variables with inaccurate values (e.g., “ADR” and “Country” in the H1 data set). This lack of quality can affect model performance. For this reason, hotels that want to build prediction models must ensure that a data quality policy is in place.
5. Conclusion
By using PMS data from four hotels over the typical PNR data in conjunction with the application of data science skills such as data visualization, data mining, and machine learning, was possible to answer the three main objectives of the research:
Identify which features contribute to predict a booking cancellation probability. Application of data visualization and data analytics techniques, together with the application of the mutual information filter, allowed the understanding of feature's predictive relevance. It was found that different features differ in importance depending on the hotel, and some features are not required for some of the hotels. It was established that, depending on the hotel, around 30 features are enough to build a good prediction model.
Build a model to classify bookings likely to be canceled and with that build a better net demand forecast. All models built reached accuracy values above 90%, with models for H2 and H3 reaching 98.6% and 97.4%, respectively. All models reached AUC values above 93.5% which is considered excellent. This demonstrates that machine learning algorithms, in this case, the decision forest algorithm, using datasets with the rightly identified features, is a good technique to build booking cancellations prediction models. This validates and answers what was challenged by Chiang et al. (2007): “as new business models keep on emerging, the old forecasting methods that worked well before may not work well in the future. Facing these challenges, researchers need to continue to develop new and better forecasting methods” (p. 117).
Understand if one model could be applied to all hotels. Model development revealed that features had different weights and different importance accordingly to the hotel, meaning that one model could not fit all hotels and therefore, each hotel should have its own model.
These prediction models enable hotel managers to mitigate revenue loss derived from booking cancellations and to mitigate the risks associated with overbooking (reallocation costs, cash or service compensations, and, particularly important today, social reputation costs). Booking cancellations models also allow hotel managers to implement less rigid cancellation policies, without increasing uncertainty. This has the potential to translate into more sales, since less rigid cancellation policies generate more bookings.
These models allow hotel managers to take actions on bookings identified as “potentially going to be canceled”, but also to produce more precise demand forecasts. Due to the direct influence of forecast accuracy in the performance of revenue management (Chiang et al., 2007), the authors are confident that the implementation of these booking cancellation prediction models, in the context of a revenue management system framework as depicted in Figure 6, could represent a major contribution to reduce uncertainty in the inventory allocation and pricing decision process.
Concurrently, development of these models should contribute to improve hotel revenue management as its use of technology and mathematical/scientific models is in accordance with the works of Chiang et al. (2007) and Kimes (2010). In fact, as Talluri & Van Ryzin (2004) said “this combination of science and technology applied to age-old demand management is the hallmark of modern revenue management” (p. 5).
5.1 Limitations and future research
This research employed data from four resort hotels that use the same PMS, which raises some questions that further research could help explain:
Can similar results be obtained from other PMS's databases? (since not all applications record the same information, with the same level of detail).
Can the same level of model performance be achieved if more hotels are integrated into the research?
Are the results specific of the type of hotels integrated into the research?
Consequently, additional research, with different PMS data, additional hotels, and additional types of hotels could contribute to a better understanding of the topic of booking cancellation prediction.
Further research could also make use of features from additional data sources, such as weather information, competitive intelligence (prices and social reputation), or currency exchange rates, to improve model performance and measure the influence of these features in booking cancellations.
Finally, deployment of these predictive models in a production environment, in hotels, with the purpose of executing A/B testing, could contribute to measure the effect of having previous knowledge of which bookings have a high cancellation probability.
REFERENCES
Abbott, D. (2014). Applied predictive analytics: Principles and techniques for the professional data analyst. Indianapolis, IN, USA: Wiley.
Anderson, C. K. (2012). The impact of social media on lodging performance. Cornell Hospitality Report, 12(15), 4-11. [ Links ]
Chapman, P., Clinton, J., Kerber, R., Khabaza, T., Reinartz, T., Shearer, C., & Wirth, R. (2000). CRISP-DM 1.0: Step-by-step data mining guide. Retrieved September 10, 2015, from https://the-modeling-agency.com/crisp-dm.pdf [ Links ]
Chen, A. H., Peng, N., & Hackley, C. (2008). Evaluating service marketing in airline industry and Its Influence on student passengers' purchasing behavior using Taipei-London route as an example. Journal of Travel & Tourism Marketing, 25(2), 149-160. [ Links ]
Chen, C.-C., Schwartz, Z., & Vargas, P. (2011). The search for the best deal: How hotel cancellation policies affect the search and booking decisions of deal-seeking customers. International Journal of Hospitality Management, 30(1), 129-135. [ Links ]
Chen, C.-C., & Xie, K. (Lijia). (2013). Differentiation of cancellation policies in the U.S. hotel industry. International Journal of Hospitality Management, 34, 66-72.
Chiang, W.-C., Chen, J. C., & Xu, X. (2007). An overview of research on revenue management: current issues and future research. International Journal of Revenue Management, 1(1), 97-128. [ Links ]
DeKay, F., Yates, B., & Toh, R. S. (2004). Non-performance penalties in the hotel industry. International Journal of Hospitality Management, 23(3), 273-286. [ Links ]
Dhar, V. (2013). Data science and prediction. Communications of the ACM, 56(12), 64-73. [ Links ]
Fernández-Delgado, M., Cernadas, E., Barro, S., & Amorim, D. (2014). Do we need hundreds of classifiers to solve real world classification problems? The Journal of Machine Learning Research, 15(1), 3133-3181. [ Links ]
Freisleben, B., & Gleichmann, G. (1993). Controlling airline seat allocations with neural networks. Proceeding of the Twenty-Sixth Hawaii International Conference on System Sciences, 4, 635-642.
Gorin, T., Brunger, W. G., & White, M. M. (2006). No-show forecasting: A blended cost-based, PNR-adjusted approach. Journal of Revenue and Pricing Management, 5(3), 188-206. [ Links ]
Guyon, I., & Elisseeff, A. (2003). An introduction to variable and feature selection. The Journal of Machine Learning Research, 3, 1157-1182. [ Links ]
Hastie, T., Tibshirani, R., & Friedman, J. (2001). The elements of statistical learning. Springer series in statistics Springer, Berlin. Retrieved from http://statweb.stanford.edu/~tibs/book/preface.ps [ Links ]
Hayes, D. K., & Miller, A. A. (2011). Revenue management for the hospitality industry. Hoboken, NJ, USA: John Wiley & Sons, Inc.
Huang, H.-C., Chang, A. Y., Ho, C.-C., & others. (2013). Using artificial neural networks to establish a customer-cancellation prediction model. Przeglad Elektrotechniczny, 89(1b), 178-180. [ Links ]
Hueglin, C., & Vannotti, F. (2001). Data mining techniques to improve forecast accuracy in airline business. In Proceedings of the seventh ACM SIGKDD international conference on knowledge discovery and data mining (pp. 438-442). ACM. Retrieved from http://dl.acm.org/citation.cfm?id=502578 [ Links ]
Iliescu, D. C., Garrow, L. A., & Parker, R. A. (2008). A hazard model of US airline passengers' refund and exchange behavior. Transportation Research Part B: Methodological, 42(3), 229-242. [ Links ]
International Civil Aviation Organization. (2010). Guidelines on Passenger Name Record (PNR) data. Retrieved February 17, 2016, from https://www.iata.org/iata/passenger-data-toolkit/assets/doc_library/04-pnr/New%20Doc%209944%201st%20Edition%20PNR.pdf [ Links ]
Ivanov, S. (2014). Hotel revenue management: From theory to practice. Varna, Bulgary: Zangador. [ Links ]
Ivanov, S., & Zhechev, V. (2012). Hotel revenue management-A critical literature review. Turizam: Znanstveno-Strucnicasopis, 60(2), 175-197. [ Links ]
Kimes, S. E. (2010). The future of hotel revenue management. Cornell Hospitality Reports, 10(14). Retrieved from https://www.hotelschool.cornell.edu/chr/pdf/showpdf/1535/chr/research/kimesrmfuture.pdf [ Links ]
Kimes, S. E., & Wirtz, J. (2003). Has revenue management become acceptable? Findings from an International study on the perceived fairness of rate fences. Journal of Service Research, 6(2), 125-135. [ Links ]
Lawrence, R. D. (2003). A machine-learning approach to optimal bid pricing. In H. K. Bhargava & N. Ye (Eds.), Computational modeling and problem solving in the networked world (pp. 97-118). Springer US. [ Links ]
Lemke, C., Riedel, S., & Gabrys, B. (2009). Dynamic combination of forecasts generated by diversification procedures applied to forecasting of airline cancellations. In IEEE Symposium on Computational Intelligence for Financial Engineering, 2009. CIFEr '09 (pp. 85-91).
Liu, P. H. (2004, January 1). Hotel demand/cancellation analysis and estimation of unconstrained demand using statistical methods. In I. Yeoman & U. McMahon-Beattie (Eds.), Revenue management and pricing: Case studies and applications (pp. 91-101). Cengage Learning EMEA.
Mehrotra, R., & Ruttley, J. (2006). Revenue management (second ed.). Washington, DC, USA: American Hotel & Lodging Association (AHLA).
Morales, D. R., & Wang, J. (2010). Forecasting cancellation rates for services booking revenue management using data mining. European Journal of Operational Research, 202(2), 554-562. [ Links ]
Neuling, R., Riedel, S., & Kalka, K.-U. (2004). New approaches to origin and destination and no-show forecasting: Excavating the passenger name records treasure. Journal of Revenue and Pricing Management, 3(1), 62-72. [ Links ]
Noone, B. M., & Lee, C. H. (2010). Hotel overbooking: The effect of overcompensation on customers' reactions to denied service. Journal of Hospitality & Tourism Research, 35(3), 334-357. [ Links ]
O'Neil, C., & Schutt, R. (2013). Doing data science. Sebastopol, CA, USA: O'Reilly Media.
Park, J.-W., Robertson, R., & Wu, C.-L. (2006). Modelling the Impact of airline service quality and marketing variables on passengers' future behavioural intentions. Transportation Planning and Technology, 29(5), 359-381. [ Links ]
Phillips, R. L. (2005). Pricing and revenue optimization. Stanford, CA, USA: Stanford University Press.
Rabianski, J. S. (2003). Primary and secondary data: Concepts, concerns, errors, and issues. Appraisal Journal, 71(1), 43 (13). [ Links ]
Smith, S. J., Parsa, H. G., Bujisic, M., & van der Rest, J.-P. (2015). Hotel cancelation policies, distributive and procedural fairness, and consumer patronage: A study of the lodging industry. Journal of Travel & Tourism Marketing, 32(7), 886-906. [ Links ]
Smola, A., & Vishwanathan, S. V. N. (2010). Introduction to machine learning. Cambridge; UK: Cambridge University Press. [ Links ]
Subramanian, J., Stidham Jr, S., & Lautenbacher, C. J. (1999). Airline yield management with overbooking, cancellations, and no-shows. Transportation Science, 33(2), 147-167. [ Links ]
Talluri, K. T., & Van Ryzin, G. (2004). The theory and practice of revenue management. Boston, MA, USA: Kluwer Academic Publishers.
Tourassi, G. D., Frederick, E. D., Markey, M. K., & Floyd, C. E. (2001). Application of the mutual information criterion for feature selection in computer-aided diagnosis. Medical Physics, 28(12), 2394. [ Links ]
Xie, J., & Gerstner, E. (2007). Service escape: Profiting from customer cancellations. Marketing Science, 26(1), 18-30. [ Links ]
Yangyong, Z., & Yun, X. (2011, June 16). Dataology and data science: Up to now. Retrieved January 1, 2014, from http://www.paper.edu.cn/en_releasepaper/content/4432156 [ Links ]
Yoon, M. G., Lee, H. Y., & Song, Y. S. (2012). Linear approximation approach for a stochastic seat allocation problem with cancellation & refund policy in airlines. Journal of Air Transport Management, 23, 41-46. [ Links ]
Zhu, W., Zeng, N., Wang, N., & others. (2010). Sensitivity, specificity, accuracy, associated confidence interval and ROC analysis with practical SAS implementations. NESUG Proceedings: Health Care and Life Sciences, Baltimore, Maryland, 1-9.
Terms and definitions
Accuracy: Measure of outcome correctness. Measures the proportion of true results (True Positives and True Negatives) among the total number of predictions. Formula: (TP+TN)/(TP+FP+FN+TN).
AUC (Area Under the Curve): Measure of success calculated from the area under the plot of true positive rate against false positive rate.
Cancellation Time: Time (usually measured in days) between a booking's date of cancellation and the guest's expected arrival.
CRS: A computerized system used to centralize, store and retrieve information related to hotel reservations.
F1 Score: Measure of prediction accuracy, which is the harmonic means of precision and recall. Formula: 2×(Precision × Recall)/(Precision+Recall).
FN (False Negative): The outcome prediction was false and the actual value was true (e.g., the booking was predicted as “has not canceled” but in fact it was canceled).
FP (False Positive): The outcome prediction was true and the actual value was false (e.g., the booking was predicted as “has a cancellation” but in fact it was not canceled).
Lead Time: Time (usually measured in days) between a booking's date of placement in the hotel and the guest's expected arrival date.
Outcome: A variable which one's want to predict. Also known as response variable, dependent variable, or label.
PMS (Property Management System): A computerized system used to facilitate the management of hotels and other types of properties. Considered equivalent to Enterprise Resource Planning systems in other types of industries.
Precision: Measures the proportion of True Positives against the sum of all positive predictions (True Positives and False Positives). Formula: TP/(TP+FP).
Predictor: A variable that explains the potential reasons behind the outcome variable variations. Also known as independent variable, explanatory variable, or feature.
Recall: Measure of relevant predictions that are retrieved. It can be interpreted as the probability of a randomly selected prediction could be a True Positive. Formula: TP/(TP+FN).
TN (True Negative): The outcome prediction was false and the actual value was false (e.g., the booking was predicted as “has not canceled” and it was not canceled).
TP (True Positive): The outcome prediction was true and the actual value was true (e.g., the booking was predicted as “has a cancellation” and it was canceled).
Received: 28.6.2016
Revisions required: 15.07.2016
Accepted: 15.11.2016

