


Serviços Personalizados
Journal
Artigo
 Inglês (pdf)
 Artigo em XML
 Referências do artigo
 Enviar este artigo por email
Indicadores
-
 Citado por SciELO
 -
 Acessos
Links relacionados
-
 Similares em
SciELO
Similares em
SciELO
Compartilhar

 Permalink
Tourism & Management Studies
versão impressa ISSN 2182-8458
TMStudies vol.12 no.1 Faro mar. 2016
https://doi.org/10.18089/tms.2016.12105
TOURISM: SCIENTIFIC PAPERS
Customer satisfaction in catering industry: Contrasts between Lithuania and Portugal
Satisfação do cliente na indústria da restauração: Contrastes entre Lituânia e Portugal
Lina Pileliene1, Nuno Almeida2, Viktorija Grigaliunaite3
1Vytautas Magnus University, Faculty of Economics and Management, S. Daukanto st. 28, Kaunas 44246, Lithuania. E-mail: l.pileliene@evf.vdu.lt
2Polytechnic Institute of Leiria, School of Tourism and Maritime Technology, Santuário de NossaSenhora dos Remédios, 2520–641 Peniche, Portugal. E-mail: nunoalmeida@ipleiria.pt
3Vytautas Magnus University, Faculty of Economics and Management, S. Daukanto st. 28, Kaunas 44246, Lithuania, viktorija. E-mail: grigaliunaite@fc.vdu.lt
ABSTRACT
This paper analyzes the differences among customer satisfaction in catering industry in two different countries: Lithuania and Portugal. The adjusted European Customer Satisfaction Index is applied for the measurement of the customer satisfaction in the catering industry. The data are collected in 2014, with the aim to identify the key factors that could affect the customer satisfaction in the catering industries in these two countries. The results indicated that the determinants of customer satisfaction with catering facilities are quite similar in both countries. Eight structural relations are significant: image influences expectations and loyalty; expectations influence perceived quality; perceived quality influences perceived value and satisfaction; perceived value influences satisfaction; and satisfaction influences loyalty and complaints. Three statistically non-significant direct causal relations are the same: complaints do not influence loyalty; expectations do not influence perceived value as well as satisfaction. Only one country-specific relation is detected: the effect of image on satisfaction is statistically significant only for Portuguese consumers.
Keywords: Catering facilities, customer expectations, customer satisfaction, perceived quality, tourism marketing.
RESUMO
Este artigo analisa as diferenças entre a satisfação dos clientes na indústria da restauração em dois países diferentes: Lituânia e Portugal. O European Customer Satisfaction Index é aplicado para medir a satisfação do cliente. Os dados foram recolhidos em 2014 visando conseguir identificar o fator chave que afeta a satisfação do cliente com serviços de restauração nos dois países. Os resultados da investigação revelam que os determinantes da satisfação dos clientes com serviço de restauração são bastante semelhantes em ambos os países. Oito relações estruturais são significativas: influências da expetativa de imagem e de fidelidade, influência da expectativa de qualidade percebida, influências da qualidade percetível, valor percebido e satisfação, satisfação percebida, influências de valor, influências de satisfação de lealdade e reclamações. Três relações estatisticamente não significativos causais diretas: Reclamações não influenciam a lealdade; expectativas não influenciam o valor percebido assim como não influenciam a satisfação. Apenas foi detetada uma relação específica do país: o efeito de imagem na satisfação é estatisticamente significativa apenas para os consumidores portugueses.
Palavras-chave: Instalações de restauração, as expectativas do cliente, satisfação do cliente, qualidade percebida, marketing turístico.
1. Introduction
In a framework of intense competition in various business sectors in entire world, customer satisfaction is widely considered as a companys competitive advantage and an effective measure for business development. Scientific literature provides a substantial evidence of its benefits (Chiung-Ju & Wen-Hung, 2004; Chu-Mei, Chien-Jung, & Mei-Liang, 2014, etc.), the relevance to measure the customer satisfaction (Al-Nasser, Al-Rawwash, & Alakhras, 2011; Calleros et al., 2012, etc.), as well as manage it (Ha & Park, 2013). Numerous factors affecting customer satisfaction are analysed; moreover, various customer satisfaction indices are designed and verified (e.g., European Customer Satisfaction Index, American Customer Satisfaction Index, and many national indices).
The food is considered as a necessary good for human existence and wellbeing. However, being framed by the stress of life and busyness, and having an opportunity of choice eating at home or at a public place, many people choose the latter one. However, the competition in catering industry is growing, as well. Dissatisfied customers have a large choice of catering facilities for consideration. Thus, customer satisfaction management becomes indispensable.
Considering the existence of a national and trans-national diversity in the customer satisfaction indices, the interest of the authors of this research was fulfilled by the application of the wide-known adjusted European Customer Satisfaction Index (ECSI) for the measurement of the customers satisfaction in the catering industry in two European countries: Lithuania and Portugal. The scientific problem of the research can be solved by answering two questions: are there any differences in the indicators of customer satisfaction with catering services in Lithuania and Portugal? and what are the factors that determine the customer satisfaction in the catering industry in these two countries? Accordingly, the aim of the research is to reveal the similarities and differences between these two European countries (Lithuania and Portugal) in terms of the customer satisfaction in the catering industry. The identification of the key determinants in the customer satisfaction will help organizations to allocate their resources to improve their competitiveness; moreover, the research will help to validate the inevitability for the adaptation to the local markets requirements.
Attaining to reach the aim of the research, customers attitudes and evaluations towards catering services in Lithuania and Portugal were determined. The survey was provided using the questionnaire research. Structural equation modelling (SEM) using partial least squares (PLS) path modelling methodology was applied for statistical analysis.
2. Theoretical substantiation
One of the first among marketing scholars who started analyzing customer satisfaction was Cardozo (1965). His presumption that customer satisfaction with product leads to repeat purchases, acceptance of other products in the same product line, and favourable word-of-mouth publicity has been approved by many subsequent researches in various industries. However, growing attention to customer satisfaction emerged only with the origination of Swedish Customer Satisfaction Barometer (SCSB) in 1980s (Fornell, 1992; Lopes, Pereira, & Vieira, 2009); subsequently, many countries (e.g., Germany, Israel, Taiwan, New Zealand, etc.) started developing their national customer satisfaction indices. However, the worldwide mostly known and applied customer satisfaction indices are American Customer Satisfaction Index (ACSI) created in 1994 (Anderson, Fornell, & Lehmann, 1994) and European Customer Satisfaction Index (ECSI) presented in 1999 (Johnson et al., 2001). Thus, the assumption can be made that customer satisfaction can be assessed above the national level, using the same instruments.
Shin (2015) structures all customer satisfaction models as normally including the attributes that: (I) describe a product or service, (II) the benefits of consequences these attributes provide to customers (groups I and II measure the antecedents of customer satisfaction), (III) a customers overall evaluation of their purchase and using experience (general satisfaction), and (IV) the intentions (consequences of customer satisfaction).
The analysis of existing customer satisfaction indices (American Customer Satisfaction Index (Anderson, Fornell, & Lehmann, 1994), European Customer Satisfaction Index (Johnson et al., 2001), Swedish Customer Satisfaction Barometer (Fornell, 1992), Mexican User Satisfaction Index (IMSU, Calleros et al., 2012), Jordanian Customer Satisfaction Index (JCSI, Al-Nasser, Al-Rawwash, & Alakhras, 2011), Malaysian Customer Satisfaction Index (MCSI, Abdullah, Husain, & El-Nassir, 2001), Hong Kong Consumer Satisfaction Index (HKCSI, Yanqun, Chan, & Siu-Keung, 2008), etc.) enables noticing that many variables overlap or are the same. Therefore, the most widely used antecedents (or determinants) of customer satisfaction are: Perceived Quality (in ACSI, ECSI, MCSI, JCSI, IMSU); Perceived Value (in SCSB, ACSI, ECSI, MCSI, HKCSI); Customer Expectations (in all customer satisfaction indices); Corporate Image (in ECSI, JCSI); Customer Characteristics and Assessed performance (in HKCSI).
The main consequences of customer satisfaction are Customer Loyalty (in all customer satisfaction indices) and Complaints (in SCSB, ASCI, HKCSI, and JCSI).
The assumption can be made that the differences in the structure of customer satisfaction indices is determined by socio-cultural differences among the countries. E.g., the hugest dissimilarities (in comparison with others) can be detected in the Hong Kong Customer Satisfaction Index and the Mexican User Satisfaction Index (in terms of determinants of customer loyalty measured), and in the Mexican User Satisfaction Index and the Malaysian Customer Satisfaction Index (in terms of customer satisfaction consequences). Therefore, considering the possibility of application of the ECSI for the satisfaction measurement in all the European countries, we hypothesize that the structure of the index models is country-specific and differs even between European countries.
Analyzing the restaurant industry, Mathe-Soulek, Slevitch, and Dallinger (2015) emphasize that there has been little agreement on the primary drivers of customer satisfaction, for the reason of existing of the differences in expectations for the product and service within different segments. However, Line, Hanks, and Kim (2016) propose that consumers compare restaurants in terms of a set of some salient characteristics. Considering the specifics of catering services, Johns and Pine (2002) propose that all satisfaction-related factors (or characteristics) can be divided into the following groups: food, physical provision, the atmosphere, auxiliary services. Therefore, all the determinants of customer satisfaction in catering industry have to reflect latter industry-specific characteristics.
3. Research methodology
Considering the aim and the problem of the research, the questionnaire research in Lithuania and Portugal was provided. For the research it was decided to apply the adjusted European Customer Satisfaction Index model, which involves latent variables that are excluded by American Customer Satisfaction Index and European Customer Satisfaction Index models (Customer Complaints and Image), and is expressed by six structural equations representing the adjusted ECSI model (Bayol et al., 2000):
(1)Customer Expectations = ß20 + ß21Image + ζ 2
(2)Perceived Quality = ß30 + ß32Customer Expectations + ζ 3
(3)Perceived Value = ß40 + ß42Customer Expectations + ß43Perceived Quality + ζ 4
(4)Customer Satisfaction = ß50 + ß51Image + ß52Customer Expectations + ß53Perceived Quality+ ß54Perceived Value + ζ 5
(5)Customer Complaints = ß60 + ß65Customer Satisfaction + ζ 6
(6)Customer Loyalty = ß70 + ß71Image + ß75Customer Satisfaction + ß76Customer Complaints + ζ 7
7 latent variables were measured by 22 manifest variables. During the research, 10-point evaluation scale was applied for the questionnaire and the total sample sizes were 250 respondents from Lithuania and 228 respondents form Portugal. The survey was conducted on the summer of 2014. Considering the fact that the research was provided in two countries (Lithuania and Portugal) national levels, the results were supposed to reflect the whole populations. Lithuania was divided into 10 counties with different socio-demographic characteristics and Portugal was divided into 18 districts, the distribution of respondents was estimated according to the population in each county / district given that the total sample size is 228 for each country. Stratified sampling method was used (sample error 7 per cent), the respondents were randomly chosen in the catering facilities, where they filled the questionnaire. All the respondents belonged to the age category over 18; the main condition was that all of them were customers of the catering industry.
Respondents distribution in samples by gender was: in Portugal 45 percent of male and 55 percent of female participated in the survey in Portugal, while in Lithuania 31 percent of male and 69 percent of female participated in the survey.
Structural equation modelling (SEM) using partial least squares (PLS) path modelling methodology was applied for statistical analysis. SmartPLS V.2 (Ringle, Wende, & Will, 2005) and IBM SPSS Statistics V.20 software packages were applied for the analysis.
4. Research results
The analysis of the research results revealed that theoretical model contained statistically non-significant direct causal relations between the latent variables regarding both countries (two-tailed test, significance level = 5 per cent). According to Hair, Ringle, and Sarstedt (2011), non-significant path coefficients do not support the hypothesized causal relationship. In the case of Lithuania, there were four statistically non-significant direct causal relations: complaints did not influence loyalty; expectations did not influence perceived value as well as satisfaction; image did not influence satisfaction. In the case of Portugal, three statistically non-significant direct causal relations were the same as in the case of Lithuania: complaints did not influence loyalty; expectations did not influence perceived value as well as satisfaction; however, the effect of image on satisfaction was statistically significant regarding Portuguese consumers (see Table 1). Thus, latter relation could be assessed as country-specific, because it was the only one effect, which was statistically significant just in one country.
As statistically non-significant path coefficients did not support the proposed causal relationships, these direct relations were eliminated from the general model.
The reflective measurement model (revealing that changes in the latent variables were reflected in the changes in the corresponding manifest variables) was assessed as reliable and valid based on four criteria in both countries (Lithuania and Portugal):
• Internal consistency reliability: Cronbachs Alpha and Composite Reliability values of all endogenous variables were above 0.7 (see Table 2);
• Indicator reliability: all indicator loadings were above 0.7 and statistically significant;
• Convergent validity: Averaged Variance Extracted (AVE) values of all endogenous variables were above 0.5 (see Table 2);
• Discriminant validity:
• Fornell-Larcker criterion (each constructs squared root AVE value was higher than its correlations with other latent variables);
• Cross-Loadings (all indicators loadings with their corresponding latent constructs were higher than their loadings with all the remaining constructs).
Moreover, the quality of the measurement model was assessed by the communality index. All of the communality values being high above 0.5 indicated the good quality of the measurement model.
The structural model exhibited predictive relevance in both Lithuanian as well as Portuguese cases (Stone-Geissers Q2 values for endogenous latent variables were above zero). Moreover, predictors variables variance inflation factor (VIF) was lower than 5, thus there was no problem of multicollinearity.
The exogenous variable image had no statistically significant effect on variable satisfaction in the case of Lithuania, although latter relation was statistically significant in the case of Portugal. Despite this, even though it was significant, the effect size of variable image on variable satisfaction was low in the case of Portugal (Cohen f2 = 0.032).
The amount of explained variance of each endogenous latent variable, revealed by coefficient of determination (R2), was higher in the case of Portugal in comparison with the case of Lithuania (see Table 2). Despite this, amount of explained variance was sufficient regarding both cases.
The standardized root mean square residual (SRMR) value of the model in the case of Portugal equals to 0.046, while in the case of Lithuania latter measure equals to 0.05. Thus, model predictions match the data well enough in both cases.
Path Coefficients and their statistical significances of the new PLS Path model are presented in Table 3. As it can be seen, in the case of Lithuania as well as in the case of Portugal, the highest direct effect on consumer satisfaction has perceived quality. Moreover, perceived quality has a very high direct effect on perceived value regarding Lithuania as well as Portugal. Perceived value has a high direct effect on customer satisfaction in both cases as well. Perceived quality is affected by consumers expectations, which are influenced by the image. Moreover, image has a moderate influence on customer loyalty in Lithuania as well as Portugal. Customer satisfaction positively and directly influences their perceived complaint handling level and customer loyalty. Image has a weak direct effect on customer satisfaction in the case of Portugal, while in the case of Lithuania latter effect is statistically non-significant and is eliminated from the general model.
In addition to the direct effects between variables, all of the total effects (the sum of direct effect and all indirect effects of one latent variable on another (Henseler, Ringle, & Sinkovics 2009)) are statistically significant in the general model as well (see Table 4). Customers expectations have indirect effects on customers complaint handling level, loyalty, perceived value and satisfaction in both countries. Moreover, the image indirectly influences customers complaint handling level, perceived quality and perceived value; perceived quality has an indirect effect on complaint handling level and loyalty; perceived value indirectly influences complaint handling level and loyalty in both countries as well. The effect of image on customer loyalty and the effect of perceived quality on customer satisfaction are direct and indirect; thus, the total effects are higher than direct effects regarding both countries. In the case of Lithuania, image has only an indirect effect on customer satisfaction. Contrarily, image has a direct as well as indirect effect on customer satisfaction in the case of Portugal.
As presented in Table 5 below, perceived complaint handling level, perceived quality, perceived value and customer satisfaction were higher in Portugal, but customers expectations, image of catering facilities, customer loyalty were higher in Lithuania. Thus, it could be stated, that Lithuanian customers were more loyal, but less satisfied with catering facilities in comparison to the Portuguese customers.
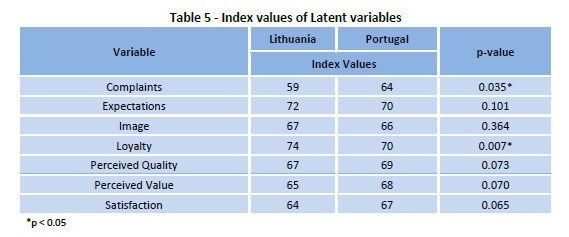
As variables were not normally distributed (p < 0.05 in Kolmogorov-Smirnov and Shapiro-Wilk tests), the Mann-Whitney U test was applied to compare differences in evaluations of variables between two independent groups. The analysis revealed that the only two significant differences were perceived complaint handling level, which was statistically significantly better in Portugal; and, customer loyalty to catering facilities, which was statistically significantly higher in Lithuania.
Consequently, it can be stated that there is a requisite for Portuguese catering facilities to improve the most important factors affecting customer loyalty; on the other hand Lithuanian catering facilities can take the example of Portuguese catering facilities for managing complaint handling level.
Consequently, the analysis of the research results substantiates the fact that all of the latent variables in the model are more or less important and directly and / or indirectly related to each other. Nevertheless, the priority factors are those having the highest influence on customer satisfaction and / or loyalty and provisory low evaluations of customers.
5. Discussion
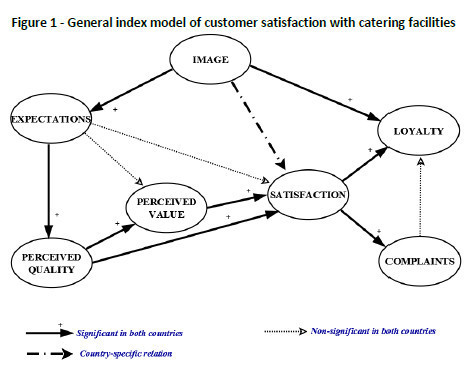
The analysis of the research results leads to the formation of the general index model of customer satisfaction with catering facilities (see Figure 1 below). Latter model illustrates eight direct, positive and statistically significant relations characteristic to both countries: Lithuania and Portugal. These relations involve effects of the image on expectations and loyalty, of the expectations on perceived quality, of perceived quality on perceived value and satisfaction, of perceived value on satisfaction, and of satisfaction on loyalty and complaints. Moreover, general index model of customer satisfaction with catering facilities illustrates three statistically non-significant relations characteristic to both countries (Lithuania and Portugal): expectations effect on perceived value and satisfaction, furthermore, complaints effect on loyalty. Latter results neglect the applicability of ECSI equally for all European countries (Johnson et al., 2001). Thus, the significant and non-significant relations between seven variables lead to the formation of guidelines applicable for Lithuanian and Portuguese catering industries. On the other hand, one relation in the elaborated model is country-specific: the effect of image on satisfaction, characteristic only for the market of Portuguese customers. Latter result substantiates the proposition by Mathe-Soulek, Slevitch, and Dallinger (2015) that the primary drivers of customer satisfaction might be different in various segments. The hypothesis that the structure of the index models is country-specific and differs even between European countries is approved.
As the analysis of the research results revealed, Lithuanian customers express more loyalty, but are less satisfied with catering facilities in their country in comparison with Portuguese customers. It can be stated, that the enhancement of customer satisfaction is essential for Lithuanian catering facilities; on the other hand, the enhancement of customer loyalty is essential for Portuguese catering facilities.
Satisfaction is strongly influenced by perceived quality and perceived value; moreover, latter variables are evaluated low in Lithuania when compared with Portugal. Hence, Lithuanian catering facilities need to allocate their investments into customers perceived quality and value. This could be achieved by enhancing quality of products and services, expanding product assortment and providing adequate value for money. On the other hand, as image of catering facilities in Portugal is lower when compared with Lithuania (moreover, in the case of Portugal, the image influences customer satisfaction as well as loyalty); Portuguese catering facilities need to allocate their investments into the enhancement of the image of catering facilities. This could be achieved by enhancing positive public image, promoting innovativeness, developing orientation to customers needs, gaining customers trust.
Consequently, by allocating investments into the specified field, the higher Lithuanian customer satisfaction and higher Portuguese customer loyalty could be attained with the relatively low costs.
6.Conclusions
In a framework of growing competition, catering companies are facing the problem of customer attraction and retention. Only those companies having loyal customers can remain competitive in the market. Customer satisfaction (as an antecedent of customer loyalty) is widely considered as a companys competitive advantage and an effective measure for the business development. Dissatisfied customers have a large choice of catering facilities for consideration. Thus, customer satisfaction management becomes indispensable.
Many indices are created worldwide for customer satisfaction measurement; however, the most popular remain European Customer Satisfaction Index and American Customer Satisfaction Index. As Lithuania and Portugal are both European countries, theoretically European Customer Satisfaction Index can be considered as the best suitable for customer satisfaction measurement.
The research provided in Lithuania and Portugal has revealed some contradictions with the theory. The main research hypothesis that the structure of the customer satisfaction index models was country-specific and different even between European countries was approved. Latter result provided a background for future research in terms of general testing of the possibility to apply the ECSI for all the European countries equally.
The research results reveal that in Lithuanian catering industry consumer complaints do not influence loyalty; the expectations do not influence perceived value as well as satisfaction; the image do not influence satisfaction. Also, in the case of Portugal, the same as in the case of Lithuania complaints do not influence loyalty; the expectations do not influence perceived value as well as satisfaction. However, all the latter relationships are approved by the ECSI. As a main difference between the antecedents of customer satisfaction in the two countries, the effect of the image on satisfaction is statistically significant in the case of Portugal. Latter result indicates the existence of differences between the segments. As the similarity of customer satisfaction antecedents, the research results reveal that satisfaction is strongly influenced by perceived quality and perceived value; moreover, latter variables are evaluated low in Lithuania when compared with Portugal.
As a country-specific differences it can be stated that Lithuanian customers are more loyal, but less satisfied with catering facilities in comparison with Portuguese customers. Thus, enhancement of customer satisfaction is essential for Lithuanian catering facilities, while enhancement of customer loyalty is essential for Portuguese catering facilities.
Lithuanian catering facilities need to enhance quality of products and services, expanding product assortment and providing adequate value for money. On the other hand, Portuguese catering facilities need to invest more into the enhancement of the image of catering facilities by enhancing positive public image, promoting innovativeness, developing orientation to customers needs, gaining customers trust.
References
Abdullah, M., Husain, N., & El-Nassir, A. D. (2001). Theory and Development of National Customer Satisfac-Tion Index: The Malaysian Index of Customer Satisfaction. Conference Proceedings from the Sixth TQM World Congress, 277-283. [ Links ]
Anderson, E. W., Fornell, C., & Lehmann, D. R. (1994). Customer Satisfaction, Market Share, and Profitability: Findings from Sweden. Journal of Marketing, 58(3), 53–66. [ Links ]
Al-Nasser, A. D., Al-Rawwash, M. Y., & Alakhras, A. S. (2011). An Approach to Setting up a National Customer Satisfaction Index: the Jordan Case Study. Journal of Applied Statistics, 38(9), 1977–1993. [ Links ]
Bayol, M.-P., Foye, A., Tellier, C., & Tenenhaus, M. (2000). Use of PLS Path Modelling to estimate the European Consumer Satisfaction Index (ECSI) model. Statistica Applicata, 12(3), 361–375. [ Links ]
Calleros, O., Rivera, H., Serrato, H., Delgado, M., León, C., Acevedo, A., & Ramírez, I. (2012). Development of the Mexican User Satisfaction Index (Imsu) to Evaluate Social Government Programs in Mexico: The Case of the Daycare Social Program. Journal of Consumer Satisfaction, Dissatisfaction & Complaining Behavior, 25, 118–129. [ Links ]
Cardozo, R., N. (1965). An Experimental Study of Customer Effort, Expectation, and Satisfaction. Journal of Marketing Research, 2, 244–249. [ Links ]
Chiung-Ju, L., & Wen-Hung, W. (2004). Attributes, Benefits, Customer Satisfaction and Behavioral Loyalty – An Integrative Research of Financial Services Industry in Taiwan. Journal Of Services Research, 4(1), 57–91. [ Links ]
Chu-Mei, L., Chien-Jung, H., & Mei-Liang, C. (2014). Relational Benefits, Customer Satisfaction, and Customer Loyalty in Chain Store Restaurants. International Journal Of Organizational Innovation, 7(1), 46–56. [ Links ]
Fornell, C. (1992). A National Customer Satisfaction Barometer: The Swedish Experience. Journal of Marketing, 56(1), 6–21. [ Links ]
Ha, Y., & Park, M. (2013). Antecedents of Customer Satisfaction and Customer Loyalty for Emerging Devices in the Initial Market of Korea: An Equity Framework. Psychology & Marketing, 30(8), 676–689. [ Links ]
Hair, J. F., Ringle, C. M., & Sarstedt, M. (2011). PLS-SEM: Indeed a silver bullet. Journal of Marketing Theory and Practice, 19(2), 139–151. [ Links ]
Henseler, J., Ringle, C. M., Sinkovics, R. R. (2009). The use of partial least squares path modeling in international marketing. Advances in International Marketing, 20, 277–319. [ Links ]
Johns, N., & Pine, R.. (2002). Consumer behavior in the food service industry: a review. International Journal of Hospitality Management, 21(2), 119–134. [ Links ]
Johnson, M. D., Gustafsson, A., Andreassen, T. W., Lervik, L., & Jaesung, C. (2001). The Evolution and Future of National Customer Satisfaction Index Models. Journal Of Economic Psychology, 22(2), 217–245. [ Links ]
Line, N. D., Hanks, L., & Kim, W. G. (2016). Hedonic adaptation and satiation: Understanding switching behavior in the restaurant industry. International Journal of Hospitality Management, 52, 143–153. [ Links ]
Lopes, H., Pereira, C., & Vieira, A. (2009). Comparação entre os Modelos Norteamericano (ACSI) e Europeu (ECSI) de Satisfação do Cliente: um Estudo no Setor de Serviços. Revista de Administração Mackenzie, 10(1), 161–187. [ Links ]
Mathe-Souleka, K., Slevitchb, L., & Dallingerc, I. (2015). Applying mixed methods to identify what drives quick service restaurant's customer satisfaction at the unit-level. International Journal of Hospitality Management, 50, 46–54. [ Links ]
Ringle, C. M., Wende, S., & Will, A. (2005). SmartPLS 2.0.M3. Hamburg: SmartPLS, http://www.smartpls.de. [ Links ]
Shin, D.-H. (2015). Effect of the customer experience on satisfaction with smartphones: Assessing smart satisfaction index with partial least squares. Telecommunications Policy, 39, 627–641. [ Links ]
Yanqun, H., Chan, L. K., & Siu-Keung, T. (2008). From consumer satisfaction to repurchase intention: The role of price tolerance in a competitive service market. Total Quality Management & Business Excellence, 19(9), 949–961. [ Links ]
Article history:
Submitted: 26.02.2015
Received in revised form: 10.01.2016
Accepted: 19.01.2016

