


Serviços Personalizados
Journal
Artigo
 Inglês (pdf)
 Artigo em XML
 Referências do artigo
 Enviar este artigo por email
Indicadores
-
 Citado por SciELO
 -
 Acessos
Links relacionados
-
 Similares em
SciELO
Similares em
SciELO
Compartilhar

 Permalink
Tourism & Management Studies
versão impressa ISSN 2182-8458
TMStudies vol.11 no.1 Faro jan. 2015
MANAGEMENT – RESEARCH PAPERS
Identification of critical success factors that maximise customers satisfaction: multivariate analysis
Identificação de fatores críticos de sucesso que maximizam a satisfação do cliente: uma análise multivariada
Hélder Pires Ferreira1; Paula Odete Fernandes2
1Polytechnic Institute of Bragança (IPB), School of Technology and Management, Campus Sta. Apolónia, 5301-857 Bragança, Portugal, helder.pires@sapo.pt
2Polytechnic Institute of Bragança (IPB), School of Technology and Management, Department of Economics and Management,UNIAG, NECE (UBI), 5301-857 Bragança, Portugal, pof@ipb.pt
ABSTRACT
This study was based on the identification of critical success factors (CSFs) that maximise customer satisfaction, as well as an analysis of customers degree of satisfaction and the importance that they attach to CSFs. For this purpose, 225 customers of the company Futurlab were surveyed, with a sampling error of 5.8% at a significance level of 5%. To identify the CSFs, we used exploratory factor analysis and, to analyse satisfaction and importance for the CSFs, we used an importance-satisfaction matrix. This study also sought to identify homogeneous groups of customers using cluster analysis.
Based on the results, seven CSFs were identified, and, in general, customers showed satisfaction with the performance of Futurlab. The cluster analysis identified four clusters according to the importance and satisfaction attributed to the CSFs.
Keywords: Importance-satisfaction matrix, critical success factors, customers, exploratory factor analysis, cluster analysis.
RESUMO
O presente estudo teve por base a identificação de Fatores Críticos de Sucesso (FCS) que maximizam a satisfação do cliente, bem como analisar o seu grau de satisfação e qual a importância que os mesmos atribuem aos FCS. Para tal, fizeram parte da amostra 225 clientes da empresa Futurlab, tendo-se assumido um erro amostral de 5,8%, a um nível de significância de 5%. Para a identificação dos Fatores Críticos de Sucesso recorreu-se à Análise Factorial Exploratória e para a análise da Satisfação e Importância utilizou-se a Matriz Importância-Satisfação. Pretendeu-se ainda identificar grupos homogéneos de clientes tendo‑se para tal utilizado a Análise de Clusters.
Dos resultados obtidos foram identificados 7 FCS e de um modo geral os clientes estão satisfeitos com o desempenho da Futurlab. Pela Análise de Clusters identificaram-se 4 Clusters de acordo com a importância e satisfação atribuída aos Fatores Críticos de Sucesso.
Palavras-chave: Matriz Importância-satisfação, fatores críticos de sucesso, cliente, análise factorial, análise de clusters.
1. Introduction
Marketing managers have increasingly adopted strategies of communication such as aggressive promotional campaigns to stimulate demand. Promotional campaigns include a wide variety of payment plans, discounts, home delivery services and other sales promotions to attract more customers, such as loan services with low interest rates and payment plans that benefit customers.
Companies need to provide the correct information about their products and services to customers, since the latter are increasingly informed at a competitive level (Fernandes & Correia, 2013; Moreno, Molina & Moreno, 2013). Thus, it is necessary to have the information to enable customers to meet their real needs and to discover the best way to satisfy and retain customers (Fernandes & Correia, 2013), as well as to follow consumer sentiment, which can provide early warnings of market conduct and performance (Fernandes & Pimenta, 2013). Therefore, only offer a product or service and make it available to the market is unsatisfactory to attract new customers and retain current customers (Batista, Couto, Botelho & Faias, 2014).
This study seeks to understand ways to retain customers and to identify their levels of satisfaction with Futurlab – Material de Laboratório, Lda (hereafter, Futurlab). The research also focused on helping managers assess and identify the major strengths and weaknesses of the current Critical Success Factors (CSFs) of the company and, finally, suggesting the modification of some of these so that the company can sustain and maintain the success it has achieved in the market.
Thus, the main objective of the present study was to identify the CSFs that maximise the satisfaction of Futurlab customers, analyse the degree of satisfaction and importance that customers assign to these CSFs and identify homogeneous groups of customers. For this purpose, research was carried out on Futurlab customers. The universe consisted of a total of 1,055 customers spread across various types of companies and/or business sectors. The data was collected between 2010 and 2012. The final sample size was 225 customers, and a sampling error of 5.8% was assumed at a significance level of 5%.
In terms of the methodology, data were collected using a previously validated questionnaire developed by the authors Wu, Tang and Shyu (2009). To process the data, descriptive, inferential and multivariate statistical analyses were used. To position the CSFs identified for Futurlab, the importance vs. satisfaction matrix adapted by Matzler, Heischmidt and Sauerwein (2003) was used. These authors based their work on the importance vs. performance matrix developed by Martilla and James (1977).
This paper not only provides a specific analysis of a case study but also summarises the companys strategies from a more practical point of view, in a real context. To this end, this paper is structured as follows. After this introduction, the next section is a literature review on the subject under study, which supports the empirical phase. The subsequent section details the methodology adopted to meet the objective of the study, followed by a presentation and discussion of results. Finally, this paper presents the most relevant conclusions and points out some future lines of research.
2. Literature review
In order to keep pace with technological, scientific and economic developments, companies today have increasingly been required to identify strategies that maintain their position in a competitive market, in particular, by defining and implementing promotional campaigns to stimulate demand. These offer payment plans, discounts, home delivery services and other sales promotions to attract more consumers, such as the provision of loan services with low interest rates and payment plans in instalments, among other benefits that might, somehow, please customers and at the same time not harm the company.
Within this type of marketing, companies must identify a limited number of practice areas where the results are satisfactory, ensuring successful competitive performance for the organisations. According to Rockart (1979), this includes defining which CSFs are clear indicators that can guide businesses to success. The concept of CSFs has been used by most managers, even if only implicitly, making it even more important to analyse CSFs in order to achieve organisational objectives.
Based on the variety of definitions found, CSFs cannot be defined in a narrow sense, otherwise researchers quickly find, as Quintella, Rocha and Alves (2005) point out, that CSFs are not a standardised set of measures, unlike what are often called key indicators, which can be applied in all departments of companies. CSFs are elements of high importance for managers in specific sectors of organisations at specific times, as these factors enable the successful achievement – or prevent this – of defined objectives in maintaining companies position in the market (Hofer & Schendel, 1978; Leidecker & Bruno, 1984; Boynton & Zmud, 1984; Koenig, 1990).
Clearly, CSFs, according to the aforementioned authors, allow companies to plan strategic initiatives directed at increasing their success, to maintain the quality of their services and, consequently, to satisfy their customers. This increases demand and allows companies to keep up with the rapid pace of development in todays economy (Bouquin, 1986; Garrette, 1993).
The factor satisfaction, according to Crato (2010), is the satisfaction of customers with services provided, which only happens when the customers evaluation of those services is equal to or higher than what they expected. Therefore, satisfaction equals perception minus expectations. It should be noted that consumer sentiment measures are intended to support and help managers to assess the likelihood of consumer spending rising or falling. In addition, these measures are more attitudinal in nature and assist marketing managers to develop a better understanding of the fields of satisfaction or dissatisfaction with marketing policies (Fernandes & Correia, 2013; Fernandes & Pimenta, 2013). Satisfaction emerges as one of the most important resources available to companies, allowing them always to achieve and enhance their competitiveness and ensure long-term success in an increasingly competitive environment, with increasingly demanding customers (Rigopoulou, Chaniotakis, Lymperopoulos & Siomkos, 2008; Fernandes & Pimenta, 2013).
Comparing importance and satisfaction with certain factors allows analysts to identify areas that are important to intervene in and focus on in terms of performance (Martilla & James, 1977; Matzler et al., 2003; Aktas, Aksu & Çizel, 2007; Abalo, Varela & Manzano, 2007; Silva & Fernandes, 2010). This framework permits the use of a management tool adapted by Matzler et al. (2003), where the authors replaced the dimension of performance with satisfaction and thus constructed an importance vs. satisfaction matrix. It needs to be noted that this matrix was based on the instrument developed by Martilla and James (1977), with which the cited authors measured the importance vs. performance of an organisation. This analysis uses a representation of findings on a Cartesian coordinate system to identify the areas where organisations should focus, reduce or maintain their efforts and also to assess the areas where the largest deviations occur between what is important to individuals and what is receiving the most attention.
Thus, in Figure 1, four quadrants on a Cartesian coordinate system allow the delineation of four distinct strategies, namely:
- Quadrant A – Concentrate efforts
- Quadrant B – Keep up the good work
- Quadrant C – Low priority
- Quadrant D – Superfluous effort
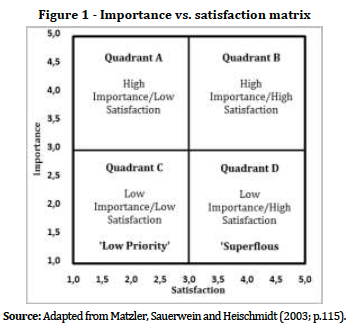
In addition, all the variables that are being studied can be used to measure importance vs. satisfaction, from the viewpoint of customers. This analysis presupposes that there is linearity between importance and satisfaction and that the intersection of the axes are averages based on the dimensions of importance and satisfaction.
From an analysis of the above figure, it can be said that (Martilla & James, 1977; Matzler et al., 2003; Silva & Fernandes, 2010):
- Quadrant A represents attributes that are extremely important, but whose level of satisfaction is evaluated as below average. To increase global satisfaction, the company needs to focus on these attributes.
- The attributes in Quadrant B are evaluated as of high importance and highly satisfactory and represent opportunities to gain or maintain competitive advantages.
- The attributes in Quadrant C are considered less important, and satisfaction levels are below average. Usually it is not necessary to focus on these attributes.
- The attributes in Quadrant D are evaluated as highly satisfactory but low in importance. This implies that resources committed to these attributes would be better used in other areas. High performance in attributes considered irrelevant indicates possibly exaggerated efforts.
3. Methodology and methods
In this research, a previously validated questionnaire was used that was the basis of the study by Wu et al. (2009), which aimed to identify CSFs for the E-Life Mall Corporation (Taiwan). In the present study, individual characterisation items were adapted for the Portuguese context, to be applied to customers of the company Futurlab (laboratory equipment). Nonetheless, studying the Portuguese context required also an examination of the internal consistency of data collection for the two dimensions of importance and satisfaction. In the present study, an analysis of importance obtained a Cronbachs alpha of 0.898, and satisfaction recorded a higher Cronbachs alpha of 0.910, which, according to the parameters, means the reliability of the instrument was good and very good for the respective dimensions.
The main objective of the study was to identify CSFs that maximise the satisfaction of Futurlab customers, as well as to observe the degree of their satisfaction. Therefore, the following research hypotheses were established:
Research Hypothesis 1: Futurlab customers are satisfied with all the CSFs.
Research Hypothesis 2: The CSFs are positioned in the quadrant Keep up the good work.
To this end, data were collected using a survey with a questionnaire composed of three parts. The first part served to collect data on the importance assigned to the services provided by Futurlab. The second part assessed the degree of satisfaction with the services provided by Futurlab. The third part sought to collect sociodemographic information that characterises the client companies and their representatives.
In the first and second part, qualitative variables were measured on a Likert ordinal scale with five points. In the third part, questions were presented in dichotomous, multiple-choice and open response formats.
To measure the importance of, and satisfaction with, the services provided by Futurlab, the Likert scale consisted of five points: 1 – Not important, 2 – A little important, 3 – Moderately important, 4 – Very important and 5 – Extremely important. The ordinal satisfaction scale was: 1 – Very dissatisfied, 2 – Dissatisfied, 3 – Unsure, 4 – Satisfied and 5 – Very satisfied.
In order to meet the objective of the present study, the following analyses were carried out:
- A descriptive exploratory analysis that allowed a characterisation of the sample under study and an inferential analysis to respond to the first research hypothesis.
- An importance vs. satisfaction matrix to respond to the second research hypothesis.
- Two multivariate statistical techniques – in an initial phase, exploratory factor analysis to observe the inherent structures among the variables under analysis, to examine their interrelationships and to help identify CSFs; in a second phase, clusters analysis to identify homogeneous groups of customers (these techniques helped respond to the research hypotheses and goal of the study).
4. Presentation of results and discussion
4.1 Population vs. sample
The study population was based on the universe of customers loyal to Futurlab as a supplier of laboratory equipment. This included, among others, respondents from schools; external analytical laboratories of water, food and other substances and the pharmaceutical and food industries. It is also important to note that this study also sought to examine what function the respondents play in their companies and what gender they are. Overall, all analyses were based on the responses of directors and managers of client companies of Futurlab.
Data were collected between 2010 and 2012, from a total list of 1,055 Futurlab customers who were random contacted, of which only 225 responded to the questionnaire. This represented 21% of the study population, following the distribution analysed in Table 1.
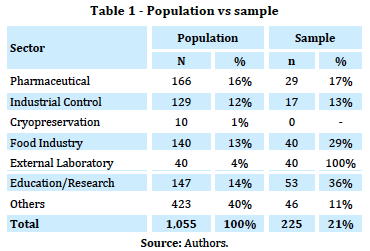
Curiously, of the 40 external laboratories, all responded to the questionnaire. Of the 140 food companies, 40 responded to the questionnaire, representing 29% of the sample; 17% of the sample came from the pharmaceutical industry and 36% were education institutions or research laboratories.
Through the analysis of the results in Table 1 and Table 2, it can be said that:
- The majority of Futurlab customers are essentially education or research organisations, with 23.8% of the responses, followed by the food industry and external laboratories with 17.9%. The pharmaceutical industry is also an important segment with 12.6%.
- Most of the respondents were located in the Lisbon and Tagus Valley Region (Zona de Lisboa e Vale do Tejo) with 59% of respondents, followed by the Oporto and North Region (Zona de Porto e Norte) with 18% of responses.
- With regard to the gender of the respondents, who were directors and managers of Futurlabs client companies, it was observed that the majority were female 61% and 39% were male. It is interesting to find this significant percentage of females, which shows the increasing tendency of women to work in management or to head departments.
- The largest percentage of respondents were young, belonging to the age group 31 to 35 years old, representing 24.9% of the respondents. It can also be noted that 93.8% of the individuals were less than or equal to 50 years old. Only 6.2% were older than 50 years. Of these respondents, only 0.9% were two individuals who were older than 56.
- The educational levels of the respondents corresponded to mostly university graduates (53.3%), for a total of 120 respondents. A large percentage of respondents also had a masters degree (25.3% or 57 respondents).
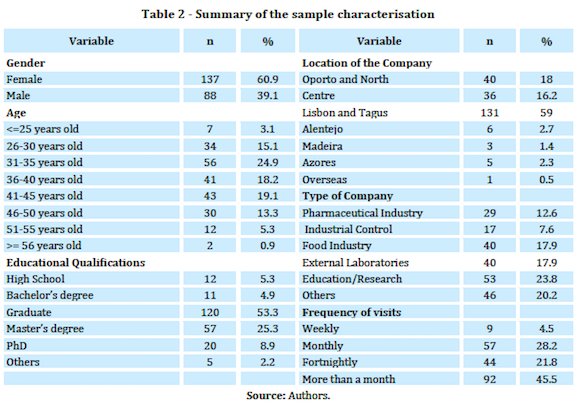
We also analysed the frequency of visits by Futurlab sales representatives to the client companies surveyed (see Table 2). From this analysis, it was possible to verify that the regularity with which sales representatives visited client companies proved to be 46% with visits spaced more than one month apart, monthly visits for 28% and fortnightly for 22%. Notably, only 4% of respondents received weekly visits.
4.2 Identification of CSFs of Futurlab
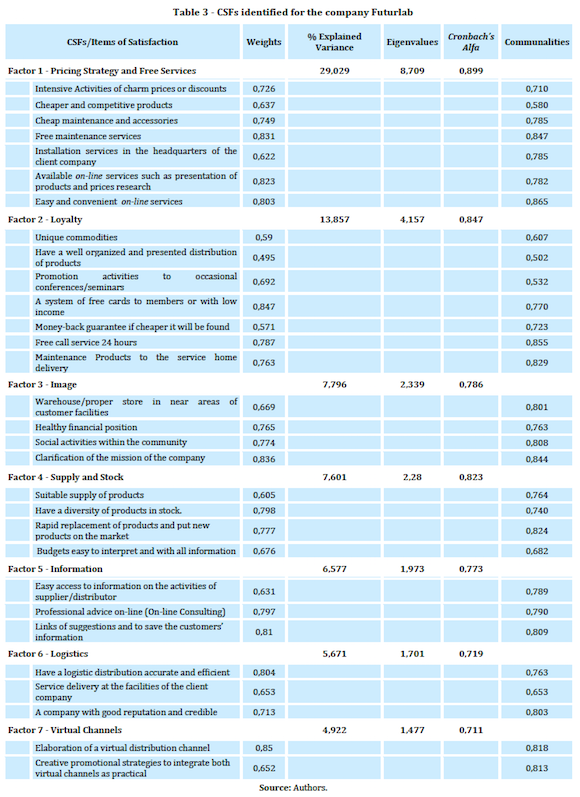
To identify CSFs that maximise the satisfaction of Futurlab customers, an exploratory factor analysis was carried out on the data. For this purpose, it was necessary to analyse the latent variable of satisfaction. The value for the Kaiser-Meyer-Olkin measure of sampling adequacy was 0.519. As this showed a value greater than 0.5, it was acceptable to apply exploratory factor analysis. Furthermore, Bartletts test of sphericity allowed the quality of the correlations between variables to be verified, so it was decided to proceed with the factor analysis – to meet the studys objective. Factor 1 explains 29.029% of the data structure, proving to be the most important factor in explaining the data analysis. The other factors are relatively less important in summarising the original variables. Factor 2 explains 13.857% of the variability of the data, Factor 3 corresponds to 7.796 % of the explanation, Factor 4 explains 7.601%, Factor 5 is responsible for about 6.577% of the explanation, Factor 6 explains 5.671% and, last, Factor 7 explains 4.922% of the total variance. This information can be observed in Table 3. As a measure of the reliability of the grouping variables, the coefficient Cronbachs alpha was found for each factor. As demonstrated by the values presented in Table 3, the factors showed levels of internal consistency between average (factors 3, 5, 6 and 7) and good (factors 1, 2 and 4) (Hill & Hill, 2009). It was possible to assign explanatory factors to behaviours, given the nature of the variables that most adequately explain each factor. Table 3 presents the seven CSFs identified for Futurlab.
To respond to the first research hypothesis, the following table presents the total values for each of the CSFs that maximise the satisfaction of Futurlab customers (see Table 4). Based on these values, the results verified that the maximum values obtained in the empirical study are quite close to the theoretical maximum values, which is considered an extremely satisfactory outcome for the company. In addition, comparing the values of the theoretical and empirical averages shows that the latter registered a value of 10.302 points above the theoretical average, which also is quite satisfactory for the company. Furthermore, the values recorded for the standard deviation for each CSF showed low values, revealing almost no variability among the answers given by respondents. Therefore, the customers are extremely satisfied with the following CSFs: pricing strategies and free services, loyalty and the companys image. The factors that present lower satisfaction are the virtual channels and logistics.
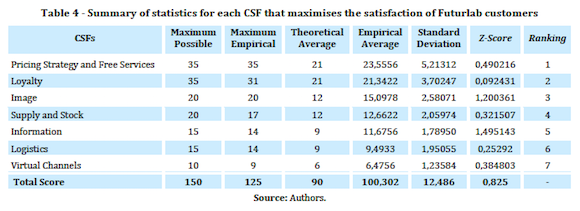
Based on the theoretical average of 90 points and an application of the Students t-test, a value of 12,377 (224 degrees of freedom) and a p-value less than 0.001 were obtained. Therefore, we can say that Research Hypothesis 1 was corroborated because there is sufficient statistical evidence to argue that the average is significantly above the theoretical average of 90 points and that Futurlab customers are satisfied with all the CSFs, assuming a significance level of 5%.
4.3 Importance vs. satisfaction analysis applied to CSFs
In order to observe the positioning of the CSFs identified for Futurlab in a quarterly analysis (to respond to Research Hypothesis 2), we used an importance vs. satisfaction matrix (see Figure 2). From this analysis, it can be seen that the factors were distributed in two quadrants (Quadrant B and Quadrant C).
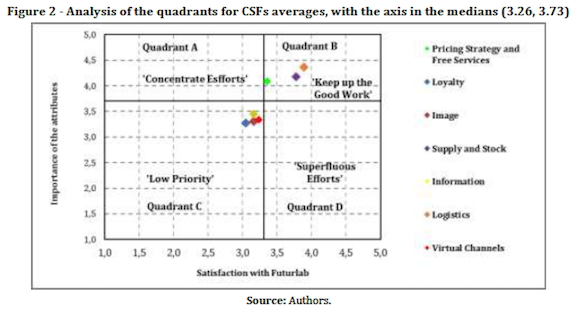
In Quadrant B, the CSFs logistics, supply and stock and prices strategy and free services appeared. These recorded high importance and satisfaction in the perceptions of Futurlab customers. Consequently, they are CSFs that represent opportunities to gain or maintain competitive advantage in the market where Futurlab operates. These factors are extremely important to customers, and they indicate good performance, so Futurlab should continue the good work reflected in the attributes that make up these factors. Quadrant C, representing low importance and satisfaction, included the CSFs information, virtual channels, image and loyalty, so these are low priority and there is no need to focus more effort in these areas.
It should be noted that, in the analysis of importance and satisfaction, as a measure of the intersection of the axes, median values obtained from the results of the questionnaires were used and not the midpoint of the range. This is because the global median values for the axes reveal the trend of the attributes, according Lynch, Carver and Virgo (1996) and Martilla and James (1977). According to the values presented, in the opinion of the authors of this paper, the directors of Futurlab must set priorities and act on the attributes that comprise the factors that appear in Quadrant C, since these CSFs present an explained variance of 33.15%.
Based on the results presented above, it can be said that Research Hypothesis 2 was not validated. In other words, only 43% of the factors are in the quadrant Keep up the good work, and 57% are in the quadrant Low priority.
4.4 Identifying homogeneous groups of customers
In order to complement this empirical study and to locate homogeneous groups of customers based on how much importance they give to Futurlabs CSFs, we chose to perform a classification analysis, namely cluster analysis, where we split the initial set of respondents – Futurlab customers – into various subsets or clusters.
A hierarchical cluster analysis was applied using the Euclidean distance between respondents and the method of aggregating farthest neighbours (i.e. complete linkage). In this method, after the first cluster is composed, the distance of this to other respondents is the largest of the distances of each of the constituent elements of this cluster to each other respondent (Marôco, 2010).
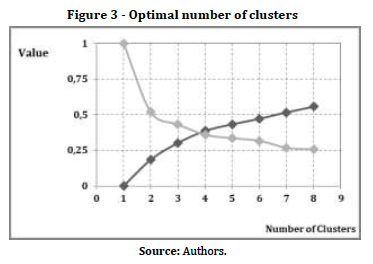
To define the optimal number of clusters to retain, we used the r2 criterion with the support of ANOVA one-way analysis to chart the relative distance between clusters and the coefficient of determination (r2). The criterion of r2 is a measure of the total variability that is retained in each of the possible clusters (Marôco, 2010).
Solutions of between two and eight clusters were examined. After applying the criteria mentioned above, an optimal solution of four clusters was chosen, as this explains about 39% of the total variability. To help validate this information, we used a graphical representation of the relative distances between clusters and the coefficient of determination (see Figure 3), reaching the conclusion that the optimal number of clusters is four.
Based on the grouping performed, the number of companies/cudtomers that fall into each cluster was extracted, which is shown in Table 5.
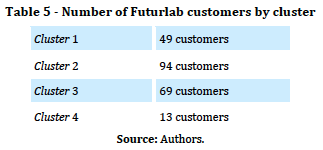
After an exhaustive analysis of the distribution of different customers by the identified homogeneous groups based on each of the attributes under study – as well as the identified CSFs – the extracted clusters were classified. In this classification, each of the CSFs was considered: when one was assigned to a cluster, this could not be repeated in subsequent analysis.
Within this framework, the results obtained were as follows:
- Analysis of Cluster 1 – Importance given to information and loyalty
This cluster consists of 49 clients who are directors and managers. Of these, 17 are male and 32 female, most are aged between 26 and 35 years old, and they mostly have university and/or masters degrees. These are customers who are laboratory technicians and research fellows. Their companies are teaching and/or research and foreign laboratories located in the centre of the country, in the Lisbon/Tagus region.
- Analysis of Cluster 2 – Importance given to image
This cluster consists of 94 customers. Of the directors/managers who answered the questionnaire, 34 are males and 60 females, mostly aged between 31 and 50 years old, and they mostly have university, masters and doctoral degrees. This is a set of customers who are laboratory technicians, purchasing technicians and laboratory directors. Their companies are food industry, pharmaceutical, education and/or research organisations located in the centre of the country and in the Lisbon/Tagus and Oporto and the North regions.
- Analysis of Cluster 3 – Importance given to supply and stock and virtual channels
This cluster consists of 69 customers. Of these directors and managers, 33 are males and 36 females, most aged between 31 and 50 years old, and mostly university graduates with masters and doctoral degrees. This is a set of customers who are laboratory technicians, teachers and purchasing technicians. The associated companies are external laboratories and education and/or research organisations located in the Lisbon/Tagus and Oporto and the North regions.
- Analysis of Cluster 4 – Importance given to pricing strategy and free services and logistics
This cluster consists of 13 clients. Among these, 4 directors or managers are male and 9 female. Most are aged between 26 and 55 years old, and most have masters degrees. These are individuals who are research fellows and professors. The companies are teaching and/or research organisations located in the Lisbon/Tagus area.
In order to analyse the importance that each cluster assigned to the CSFs identified for Futurlab, figure 4 was constructed. Thus, we were able to calculate for each cluster the average of the scores obtained for each CSF based on the dimension of importance.
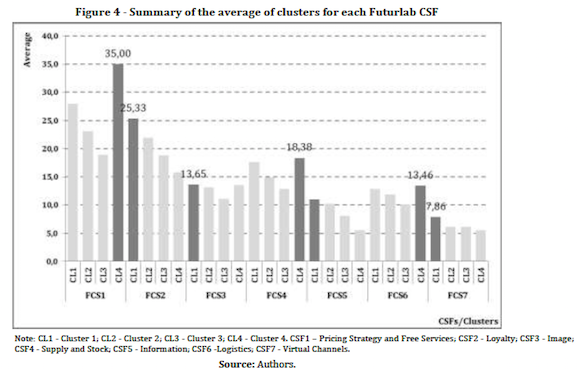
From the analysis of the values and information shown in the above figure and based on the degree of importance of each CSF, the following conclusions were drawn:
- CSF 1 Pricing strategy and free services – Cluster 4 was the group with the highest average, showing that it attributed the highest importance to this factor.
- CSF 2 Loyalty – Cluster 1 attributed particular importance to this.
- CSF 3 Image – Cluster 1 recorded the highest average importance for this CSF of all clusters, followed by Clusters 2 and 4.
- CSF 4 Supply and stock – Cluster 4 gave this CSF the highest average importance, followed by Cluster 1 and Cluster 2, which appeared in third place.
- CSF 5 Information – The clusters that recorded the highest average for this CSF were Cluster 1, followed by Clusters 2 and 3.
- CSF 6 Logistics – Cluster 4 recorded the highest importance average for this CSF, followed by Clusters 1 and 2.
- CSF 7 Virtual channels – Clusters that recorded higher averages for this were Cluster 1, followed by Clusters 3 and 2.
From this analysis, it can be concluded that the CSFs pricing strategy and free services, loyalty, supply and stock and image are the CSFs to which these companies attach special importance, as already noted in previous analyses. On the other hand, those CSFs that had lower averages for their importance were information, logistics and virtual channels.
It should also be noted that Clusters 1 and 4 gave higher values for the majority of CSFs. Based on these figures, it can be said that this group of lab technicians and research fellows customers are more demanding about the services provided.
5. Conclusion
This study sought to identify CSFs in the development of strategies that maximise customers satisfaction with the company Futurlab.
To assess which dimensions are most used by customers in assessing both the importance of certain attributes that a branch company must have and the quality of services provided by Futurlab, CSFs were identified using an exploratory factor analysis. Subsequently, the degree of satisfaction of Futurlab customers was analysed by applying an importance vs. satisfaction matrix to the identified CSFs. The results show that Futurlab has to keep up the good work in pricing strategy and free services, supply and stock and logistics. It needs to reformulate its strategies in loyalty, image, information and virtual channels, since these are factors that are not considered important and Futurlab should redefine these factors in order to make them more important and to improve their customers satisfaction.
This research makes an important contribution in that the level of satisfaction of Futurlab customers was identified, which had never been analysed until that time. In addition, the attributes and dimensions related to quality of services that influence customers satisfaction were found, offering an overview of the companys ability to attract, retain and engage their customers.
In this way, this study has also contributed to identifying CSFs that require the intervention of Futurlab managers, noting which should be given priority and attention, including loyalty, image, information and virtual channels. In the opinion of the authors of this paper, image is extremely important for the companys success, since general appearance is the first impression that customers get of companies. Therefore, it is essential that the sales network and corporate image of the company exceed the expectations of customers in order to retain customers and win new ones.
Furthermore, based on the results presented above, it can be said that Research Hypothesis 1 was corroborated because there is sufficient statistical evidence to argue that Futurlabs average is significantly above the theoretical average of 90 points and that Futurlab customers are satisfied with all the CSFs, at a significance level of 5%. Research Hypothesis 2 was not validated because only 43% of the factors are in the quadrant Keep up the good work and 57% are in the quadrant Low priority.
In the cluster analysis, four clusters were identified according to the importance assigned to the CSFs. These were Cluster 1 – Importance given to information and loyalty; Cluster 2 – Importance given to image; Cluster 3 – Importance given to supply and stock and virtual channels and Cluster 4 – Importance given to pricing strategy and free services and logistics.
In general, customers are satisfied with the performance of Futurlab, so this company has all the necessary conditions to provide quality services to attract new customers and retain its current ones. Satisfied customers contribute to loyalty to companies, returning to the companies they value for future purchases.
References
Abalo, J., Varela, J., & Manzano, V. (2007). Importance values for importance-performance analysis: a formula for spreading out values derived from preference rankings. Journal of Business Research, 60(2), 115-121. [ Links ]
Aktas, A., Aksu, A., & Çizel, B. (2007). Destination choice: an important - satisfaction analysis. Quality & Quality, 41, 265-273. [ Links ]
Batista, M., Couto, J., Botelho, D., & Faias, C. (2014). Tourist satisfaction and loyalty in the hotel business: An application to the island of São Miguel, Azores. Tourism & Management Studies, 10(1), 16-23. [ Links ]
Bouquin, H. (1986). Le contrôle de gestion. (1ére edition). Paris: Presses Universitaires de France. [ Links ]
Boynton, A., & Zmud, R. (1984). An assessment of critical success factors. Management Review, 25(4), 17-27. [ Links ]
Crato, C. (2010). Qualidade: condição de competitividade. Porto: SPI - Sociedade Portuguesa de Inovação Consultadoria Empresarial e Fomento da Inovação. [ Links ]
Fernandes, P., & Pimenta, R. (2013). The Portuguese consumer sentiment index toward marketing-mix in crisis context. Tourism & Management Studies, 9(1), 97-100. [ Links ]
Fernandes, P., Correia, L. (2013). Atitudes do consumidor em relação às práticas do marketing em Portugal. Tourism & Management Studies, 9(2), 86-92. [ Links ]
Garrette, B. (1993). Stratégie, structure, décision, identité: politique générale d'entreprise. 2éme edition. Paris: Interedition. [ Links ]
Hill, M., & Hill, A. (2009). Investigação por questionário. 2ª edição. Lisboa: Edições Sílabo. [ Links ]
Hofer, C., & Schendel, D. (1978). Strategy formulation: analytical concepts. St. Paul, MN: West Publishing Company.
Koenig, G. (1990). Management stratégique: vision, manoeuvres et tactiques. Paris: Nathan. [ Links ]
Leidecker, J., & Bruno, A. (1984). Identifying and using critical success factors. Long Range Planning, 17, 23-32. [ Links ]
Lynch, J., Carver, R., & Virgo, J. (1996). Quadrant analysis as a strategic planning technique in curriculum development and program marketing. Journal of Marketing for Higher Education, 7(2), 17-32. [ Links ]
Marôco, J. (2010). Análise Estatística com o PASW Statistics (ex-SPSS). 5ª edição. Pêro Pinheiro: Report Numbers. [ Links ]
Martilla, J., & James, J. (1977). Importance-performance analysis. Journal of Marketing, 41, 77-79. [ Links ]
Matzler, K., Sauerwein, E., & Heischmidt, K. (2003). Importance-performance analysis revisited: the role of the factor structure of customer satisfaction. The Service Industries Journal, 23(2), 112-129. [ Links ]
Moreno, M., Molina, C., & Moreno, R. (2013) Satisfacción, lealtad y colectivismo en destinos culturales. Tourism & Management Studies, 9 (2), 44-49. [ Links ]
Quintella, H., Rocha, H., & Alves, M. (2005). Projetos de veículos automotores: fatores críticos de sucesso no lançamento. Revista Produção, 15(3), 334-346. [ Links ]
Rigopoulou, I., Chaniotakis, I., Lymperopoulos, C., & Siomkos, G. (2008). After-sales service quality as an antecedent of customer satisfaction: the case of electronic appliances. Managing Service Quality, 18(5), 512-527. [ Links ]
Rockart, J. (1979). Chief executives define their own data needs. Harvard Business Review, 57, 81-83. [ Links ]
Silva, F., & Fernandes, P. (2010). Using Importance-Performance Analysis in Evaluating of Higher Education: A Case Study. ICEMT 2010 International Conference on Education and Management Technology. Cairo: IEEE. 121-123. DOI: 10.1109/ICEMT.2010.5657689.
Wu, H., Tang, T., & Shyu, W. (2009). A case of applying importance-performance analysis in identifying key success factors to develop marketing strategies. Quality & Quantity, 44(6), 1207-1218. [ Links ]
Article history:
Received: 30 May 2014
Accepted: 20 October 2014

