


Serviços Personalizados
Journal
Artigo
 Inglês (pdf)
 Artigo em XML
 Referências do artigo
 Enviar este artigo por email
Indicadores
-
 Citado por SciELO
 -
 Acessos
Links relacionados
-
 Similares em
SciELO
Similares em
SciELO
Compartilhar

 Permalink
Revista de Gestão Costeira Integrada
versão On-line ISSN 1646-8872
RGCI vol.15 no.4 Lisboa dez. 2015
https://doi.org/10.5894/rgci502
ARTICLE / ARTIGO
Use of geoindicators in vulnerability mapping for the coastal erosion of a sandy beach*
Uso de geoindicadores no mapeamento da vulnerabilidade à erosão costeira de uma praia arenosa
Eduardo Queiroz de Lima@, 1, 2; Ricardo Farias do Amaral1, 2, 3
@Corresponding author to whom correspondence should be addressed.
1Universidade Federal do Rio Grande do Norte, Programa de Pós-graduação em Geodinâmica e Geofísica (PPGG), CEP 59072-970, Natal, RN, Brasil. e-mail: Lima <limaqedu@gmail.com>.
2Universidade Federal do Rio Grande do Norte, Laboratório de Estudos Geoambientais (Legeo), CEP 59072-970, Natal, RN, Brasil.
3Universidade Federal do Rio Grande do Norte, Departamento de Geologia, CEP 59072-970, Natal, RN, Brasil.
ABSTRACT
Pititinga beach, located in the municipality of Rio do Fogo on the eastern coast of Rio Grande do Norte, Brazil, lives with the conflict between the actions of the sea and human occupation, giving rise to a striking landscape featuring the damaged waterfront homes of the Pititinga fishing community, which have been destroyed by the action of the sea. Thus, the coastal erosion of Pititinga beach was analysed according to the natural and human conditions and their mutual relations. The methodological procedure used a Digital Elevation Model (DEM) and a geoindicators coastal erosion map, which took account of shoreline parameters, the frontal and transgressive dunes, vegetation, and anthropogenic structures. An area was delimited for the generation of the DEM and to collect information for the production of the geoindicators map. The crossing of the DEM with the geoindicators map resulted in an erosion vulnerability map. The data and information obtained were integrated and stored in a Geographic Information System (GIS). The results show different behaviours in three sections along the shoreline studied, in accordance with the characteristics of each. When frontal and transgressive dunes occur, the vulnerabilities are medium and low, respectively, and when these are absent, as in the village of Pititinga, vulnerability is predominantly very high.
Keywords: Coastal erosion, Geoindicators, Coastal vulnerability, Geographical Information Systems (GIS).
RESUMO
A praia de Pititinga situada no município de Rio do Fogo, litoral Oriental do Rio Grande do Norte, Brasil, convive com o conflito entre a ação do mar e as ocupações humanas fixadas no local, resultando em uma paisagem impactante em que a comunidade de pescadores de Pititinga apresenta casas à beira-mar degradadas e destruídas pela ação do mar. Deste modo, a erosão costeira da praia de Pititinga foi analisada a partir de condicionantes naturais e humanos e suas relações mútuas. O procedimento metodológico utilizou um Modelo Digital de Elevação (MDE) e um Mapa de Geoindicadores de Erosão Costeira, o qual levou em conta parâmetros praiais (mais específicos da linha de praia), das dunes frontais e interiores, Vegetation e estruturas antrópicas. Foi delimitada uma área para a geração do MDE e para o levantamento de informações para a produção do mapa de Geoindicadores. O cruzamento do MDE com o Mapa de Geoindicadores resultou num Mapa de Vulnerabilidade à Erosão. Os dados e informações obtidos foram integrados e armazenados em um ambiente de Sistema de Informações Geográficas (SIG). Os resultados alcançados mostram comportamentos distintos em três trechos ao longo da linha de costa estudada, de acordo com as características de cada um. Quando ocorrem dunes frontais e transgressivas as vulnerabilidades são Medium e Low, respectivamente, e quando da ausência destas, como ocorre na vila de Pititinga (dotada de estruturas de engenharia), a vulnerabilidade apresentou-se predominantemente muito alta.
Palavras-chave: Erosão costeira, Geoindicadores, Vulnerabilidade costeira, Sistema de Informações Geográficas (SIG).
1. Introduction
The village of Pititinga is a beach community in the state of Rio Grande do Norte, whose traditional inhabitants are fishermen and their families. This community has incipient tourism with rudimentary infrastructure (a few low-quality hotels, boarding houses, restaurants, and commerce in general). With relatively little accommodation, the summer vacation season is not as thriving as that of other beaches in the same state.
The community is marked by the action of coastal erosion, which gives rise to a visual impact on the location, given that many residences have been totally destroyed and others are substantially threatened, all of which creates a serious social problem. For this reason, studies on the understanding of coastal erosion are of great relevance.
On the east coast of Rio Grande do Norte state, more specifically on the stretch between the municipalities of Natal and Touros, research and studies have been conducted which focused on the understanding of the coastal dynamics, notable examples being the works of Nunes (1987), Vital (2003), Vital (2006), Nogueira et al. (2006), Amaral (2008), Carneiro (2011), and Lima & Amaral (2013). However, there is still a lot to be done in order to underpin the elaboration of a rational policy for land use and occupation in the region.
It is possible to verify evidence of coastal erosive processes along the entire coast of the state of Rio Grande do Norte. The beaches are eroded when they lose more sediment than they receive from several sources. As the volume of beach material diminishes, the beach level is lowered and its width reduced (Bird, 2008). Coastal erosion is commonly an effect of a negative sedimentary balance. The reduction of the amount of sediments on the coast tends to cause the retreat of the shoreline in the direction of the continent, a process that signals a state of erosion.
It is important to highlight that Pititinga beach presents the configuration of a beach with a bay in the form of a “zeta”, called a zeta curve bay (Halligan, 1906), half-heart shaped bay (Silvester, 1960), or headland bay (Yasso, 1965), which when plotted, expresses the portion of the curve which is most closely linked to a promontory and a rectilinear portion or a gentler curvature separated from this promontory. In the case of Pititinga beach, Coconho Point performs the role of the promontory. Amaral´s work (2000) with regard to Rio Grande do Norte stands out; it studies the shoreline of the eastern coast of this state, observing the existence and functioning of the zeta curve bays there.
Coastal erosion can be analysed according to the susceptibility that a portion of the coast presents in the light of its physical and ecological characteristics and, especially, in the light of the tension between the hydrodynamic beach processes and the anthropogenic constructions along the coast. It is relevant to observe that if this tension promotes a negative sediment balance, the vulnerability of the coastal systems will be accentuated (Komar, 1983).
The term vulnerability assumes different meanings according to its use in the most distinct scientific fields. In Geography, the Geosciences, and the Environmental Sciences, Tagliani´s (2003) understanding of the term can be adopted, by which environmental vulnerability means the greater or lesser susceptibility of an environment to the potential impact provoked by any kind of anthropogenic use. The term susceptibility alludes to the tendency (denoting passivity) to undergo impressions, changes, or deformations or to acquire different qualities from those already possessed. Corroborating this, the “United Nations International Strategy for Disaster Reduction” - UNISDR - (2009) defines vulnerability, considering the characteristics and the circumstances of a community, system, or good that makes it susceptible to the negative effects of the hazard in question.
Cutter (2011) explains that vulnerability is the potential for loss. Santos and Caldeyro (2007), on the other hand, express a more geographical definition by taking into consideration that vulnerability corresponds to an intrinsic condition belonging to each fraction of the land, which in interaction with the type and magnitude of the event we induce, results in an amount of adverse effects.
In this article, the physical as well as the human and geographical factors were considered, encompassing vulnerability to coastal erosion as a term that highlights the importance of the existing conflict between the sea and the settlements established along the shoreline. In this way, it is not a formulation that considers exclusively aspects of a natural order. On the contrary, human actions are included, taking into consideration the nature and arrangement of settlements.
To carry out the analysis, geoindicators were employed, which act as an instrument for the assessment of the state of ecosystems exposed to human activity. Geoindicators are, according to Berger & Iams (1996), measurements (magnitudes, frequencies, rates, and tendencies) of geological processes and phenomena that occur in or near to the earth´s surface and are subject to changes and which are significant for the understanding of environmental alterations over a period of a hundred years or less.
The choice of using geoindicators to evaluate coastal erosion was especially due to the possibility of obtaining quick answers for the assessment of coastal risks (Bush et al., 1999). Geoindicators are qualitative instruments with scientific validity for the rapid identification of potential risk which also allow the quick generation of mitigation and management plans. The same authors explain that geoindicators are viable, low-cost alternatives, because they do not require the use of high technologies for historical analysis techniques and for environmental monitoring, which are often expensive and, when applied to the mapping of hazards and risk evaluation, normally occur on a regional scale, depending on incomplete global databases (Bush et al., 1999).
Given that scenario, this article produces information on Pititinga beach, observing characteristics of the physical environment and of the engineering structures with the aim of mapping, evaluating, and characterizing the degree of vulnerability to coastal erosion using geoindicators. For this, in the study, we (a) considered data and information of the hydrodynamics of this shoreline; (b) studied the parameters related to the geology, geomorphology, and vegetation; (c) observed the impacts on the engineering structures (constructions like houses, access points, and structures for containing the erosion process; and (d) mapped and zoned the areas vulnerable to erosion on the coast with the aid of geoindicators.
2. Material and methods
2.1. Location of the studied area
The study area is located on the east coast of the state of Rio Grande do Norte, more precisely in the municipality of Rio do Fogo – between the Ponta do Coconho, on the border of the municipality of Maxaranguape, to the south, and the lower course of the River Punaú to the north. It corresponds with Pititinga beach and the emerged adjacent coastal zone, in the east, bordering the BR-101 highway. It is around 50 km to the north of the city of Natal, the state´s capital, located at the UTM coordinates 234231.383 and 243588.683 mE and 9409181.617 and 9400886.067 mN (Datum WGS84) in the 25 M zone (Figure 1).
2.2. Geological and oceanographic characterization
For Nogueira (2008), the Cenozoic units that make up the Potiguar Basin are represented by the Barreiras Formation, Supra-Barreiras Rocks, Beachrocks, Deposits of Fixed and Mobile Dunes, Recent Beach Deposits, and Alluvial Deposits.
Nunes (1987), on considering lithological units of the eastern coast of Rio Grande do Norte situated to the north of Natal, subdivides the Cenozoic sediments into two groups: the Barreiras Group and the Recent Sediments, which encompass the Sub-Recent Beach Deposits, Recent Beach Deposits, Dune Deposits, and Alluvial Deposits. In this same study area, in geological mapping, Barreto et al. (2004) identify marine terrace deposits, active dunes (barchan, barcanoid crest, and parabolic), inactive dunes with clear morphology, inactive dunes with tenuous morphology, sand sheets, alluvial deposits, and pre-quaternary geology. More specifically on the Pititinga coast, Lima (2010) identifies the following geological units: sand sheets, alluvial deposits, lacustrine deposits, beach sediment deposits, aeolian deposits of fixed dunes, and aeolian deposits of mobile dunes.
On the east coast of the state in question, data on waves originating from long-duration direct measurements are not known. However, it is possible to find wave, current, and tide data in isolated studies that have been carried out on this coast. Thus, Souza (2004) explains that there are waves 0.2 to 1.5m high in the breaker zone and coastal currents of around 0.1 to 0.8 m/s, predominantly in the south–north direction.
In relation to the tides, records of tides on the coast of Natal show a maximum level varying from 2.85 to 2.95 m, an average level of 1.4m, and a registered minimum level between –0.05 and –0.25m. This characterizes the local tide as a meso-tide type with semi-diurnal regime and periodicity of around 12 h 42 min (Cunha, 2004).
2.3. Methodological aspects
This study is grounded in the interpretation of remote sensing data products, field visits to diagnose the beach situation according to the geoindicators, and the elaboration of a coastal erosion vulnerability map.
The materials used in the laboratory as well as in the field were: 1) digitalized orthophotos, rectified and georeferenced (resolution of 2 m), of PRODETUR produced in 2006; 2) planialtimetric charts of PRODETUR/NE (2006) with contour lines at an equidistance of 5 m; 3) ArcGIS 9.3 software; 4) Microsoft Office 2007 Excel spreadsheet; 5) Bush et al.´s (1999), Coburn´s (2001), and Rudorff´s (2005) geoindicator coastal erosion check-list; 6) a digital camera; and 7) mapping GPS and topographical equipment.
2.3.1. Production of the coastal erosion geoindicators map
For the evaluation of the vulnerability of Pititinga beach to coastal erosion, the method proposed by Rudorff (2005) was applied, using geoindicators for its evaluation. In that work, an index was elaborated by means of Multicriteria Evaluation, which is based on two types of indicators: geoindicators obtained by field checking and the fuzzy Digital Elevation Model (DEM).
The geoindicators were selected based on the works of Bush et al. (1999), Coburn (2001) and Rudorff (2005) and adapted for the geo-environmental framework of Pititinga beach. The geoindicators take into consideration two coastal environments along the beach profile: the shoreline and the transgressive dunes. In the first environment the following geoindicators were observed: 1) erosion rate; 2) height, type, and condition of the foredune; 3) wave energy; 4) foredune or backshore vegetation; 5) average width of the dry beach; and 6) engineering structures. In the case of the transgressive dunes, their condition (absence, scarp, or fragmented, high and well developed) was observed.
The matrix of the geoindicators contains the categories and weights of each category; the geoindicator and respective weights; normalized scoring; the attributes of each geoindicator; and the weights of each attribute and scoring. The weights of the categories and of the geoindicators were determined based on the weights attributed by Coburn (2001), although adapted to the characteristics of Pititinga beach (See Supporting Information SI.I and SI.II).
The normalized scoring is the result of the multiplication of the geoindicator´s weight by the weight of its category. The scoring was a result of the product of the normalized scoring and the weight of the attribute, and the total score was given by the sum of the scores of the geoindicators. The sum of the maximum scores of each geoindicator corresponds to a maximum score of 10.0.
Rudorff (2005) divided the indexes of susceptibility into five classes: very high susceptibility (8 < weight ≤ 10), high susceptibility (6 < weight ≤ 8), moderate susceptibility (4 < weight ≤ 6), low susceptibility (2 < weight ≤ 4), and very low susceptibility (weight ≤ 2).
Two field trips were conducted to diagnose the coast according to geoindicators. The first was on 15 November 2009 and the second, for new observations and rectifications, was on 18 April 2010. A GPS with positional accuracy estimated at around 7m was used for mapping, along with topographical equipment, a fieldwork check-list, and a map with the collection points previously defined along the studied beach at 150 m intervals. This was the fixed distance that best represented each modification of the beach environment, taking as reference the foredunes, residences, and transgressive coastal dunes.
The values of the geoindicators observed were inserted into a Microsoft Office 2007 Excel spreadsheet to carry out the calculations of the vulnerability indexes. Following that, the geoindicator data were input into the ArcGIS 9.3 software for visualization and spatial correction (transformation of the data from the spreadsheet into shapefiles) with the orthophotos and for the attribution of their respective indexes. The interpolation of the collected points with regular distribution along the beach generated a regular continuous grid with the values of the indexes along the shoreline.
For the interpolation of the geoindicators, the method of Inverse Distance Weighting (IDW) was adopted, which, according to Longley et al. (2005), is the interpolation method most commonly used in GIS. The IDW is a deterministic method for local effects in which each point of the surface is estimated only from the interpolation of closer samples; that is, the sampled points of locations next to the node to be estimated receive greater weight than the points sampled from more distant locations (Landim, 2000; Camargo et al., 2004). It is presupposed, then, that the merely local effects prevail, no other statistical hypothesis on spatial variability being made. Thus, a non-sampled point has the value of a “z” attribute as the expression of an average of the points that occur in the surroundings of the non-visited point and weighted according to the distances (Burrough & McDonnell, 1998).
The geoindicators – the average width of the dry beach and wave energy – were measured directly on the beach under study over twelve months (from May 2009 to April 2010) from the construction and analysis of transversal topographical profiles for the beach and the measurement of wave height, according to the methodology presented by Muehe (2005).
The geoindicator “rate of erosion” was determined from a check-list adapted from Bush et al. (1999). From this, the states of erosion of the beach were classified into categories from severe erosion to long-term stability (accretion).
2.3.2. Production of the Digital Elevation Model
Topography is understood as an important indicator of vulnerability to coastal erosion, given that a point situated on a high topography will certainly have fewer chances of suffering impact from the sea and will therefore be less vulnerable to hazard. On the other hand, the present relief is the result of a set of surface modelling processes, thereby being a beacon of dynamic interactions which have occurred.
This criterion was integrated into the vulnerability assessment by means of the theory of fuzzy sets, with the use of a fuzzy pertinence function in which the borders and edges between classes are undefined. In this way, fuzzy set theory fits for cases in which the limits of classes are not, or cannot be, well-defined. To generate the DEM, a PRODETUR/NE (2006) planialtimetric chart was used with contour lines at 5 m equidistant intervals. The contours and their elevations were transformed into points, from which they were interpolated by Ordinary Kriging, generating a DEM continuous surface (fuzzy logic).
The kriging method or geostatistics uses spatial dependence between neighbouring samples, which are revealed in the semivariogram, with the aim of estimating values at any position in the field; it generates unbiased estimates with minimum variance, and in this way it consists of an optimum estimator (Carvalho & Assad, 2005). According to Vieira (2000), the kriging is capable of generating better estimates in terms of interpolation, given that it is based on two basic premises: non-bias of the estimator and minimum variance of the estimates. Ordinary kriging is considered to be the best unbiased linear estimator. It is a linear estimator that can estimate an unknown value by linear combination of the weights of the values observed in the neighbouring samples; as well as being unbiased, it allows the global mean of errors, that is, the mean of differences between the estimated values and the observed values, to be null (Barros Filho, 2007).
With the application of fuzzy logic to the DEM, it was possible to obtain the fuzzy DEM. The criterion adopted is that altitudes with values close to 0 m have maximum susceptibilities, close to 10, and the greatest altitudes tend to have minimum susceptibilities, close to 0 (See Supporting Information SI.III).
2.3.3. Production of the coastal erosion vulnerability map for Pititinga
In order to characterize the vulnerability to coastal erosion, two raster planes, crossed by map algebra, were used: (a) the interpolated geoindicators and (b) the fuzzy DEM. For the crossing, each plane received a differentiated weight in accordance with Rudorff (2005): a weight of 0.8 was attributed to the interpolated geoindicators and a weight of 0.2 was attributed to the fuzzy DEM, resulting in the following function:
Susceptibility = (geoindicators × 0.8) +
The attribution of these weights follows the argument of Robin (2002), who, after consulting several specialists, concluded that topography has an order of importance of 0.22 in relation to other geoindicators, resulting in the weight of 0.2.
Susceptibility was classified by dividing it into five classes, as in the previous case for the geoindicators: very high susceptibility (8 < weight ≤ 10), high susceptibility (6 < weight ≤ 8), moderate susceptibility (4 < weight ≥ 6), low susceptibility (2 < weight ≤ 4), and very low susceptibility (weight < 2). The coastal erosion vulnerability map was elaborated on an original scale of 1:25,000. This scale allowed the whole study area to be encompassed.
3. Results and discussion
Other authors have studied coastal erosion vulnerability in nearby and similar coastal regions. Among these authors, Silva et al. (2013) and Mallmann and Araújo (2007) can be highlighted. Silva et al. (2013) assessed the coastal erosion vulnerability of the coast of Recife and Jaboatão dos Guararapes in Pernambuco. Using remote sensor data, they divided the study area into sectors. Fuzzy Modelling was applied in each sector, considering as input variables the following conditioning factors of vulnerability: backshore morphological conditions, natural attributes, coastal processes, and anthropic processes. From the input variables, some simulations were established and from these, modelling with 114 rules that are part of the fuzzy inference process was used, and an output variable, the thematic classification of vulnerability to erosion as low, moderate, high, and very high, was established.
Mallmann and Araújo (2007) developed a Coastal Vulnerability Index (CVI) that is calculated from the sum of five Partial Vulnerability Indexes (PVI), which are related to coastal morphology, to the presence of natural attributes, to marine influence, to coastal processes, and to anthropic factors (degree of urbanization of the beachfront, type of constructions, sector of the beach where the first strip of constructions is located, presence of coastal protection structures, and rate of demographic growth). The work carried out statistical calculations of the mean, median, mode, standard deviation, and quartile (first, second, and third), from which the coastal segments are classified regarding the degree of vulnerability as low, medium, or high.
Although they are interesting and have consistent parameters, the cited studies were set aside in our study, given our understanding that their methods present statistical analyses that are more complex and costly, which makes them more lengthy. Differently, the method proposed here exhibits simplicity in the collection and analysis of primary data, making it quicker, more practical, and cheaper, without the need for costly equipment, and it is therefore very useful to researchers who study coastal areas with scarce availability of secondary data.
Treating particularly the vulnerability of Pititinga beach to coastal erosion and based on the list of geoindicators obtained from field data, a cartographic product was generated that allows the visualization of zones of greater vulnerability and lower vulnerability to provoked erosion, mainly by the action of the sea.
Added to the interpolation of the geoindicators is another product, the DEM. The algebraic operation of these maps provides the supporting information to classify erosion by degree of vulnerability. The DEM assumes importance because altitude becomes a relevant factor to verify erosion for one simple reason: the higher the topographic compartments (natural) that interact with the beach, the greater will be the difficulty of erosion of the stretch of beach contained in this situation. The inverse also occurs: when the coast is low, without relevant topographic compartments, there is greater possibility of erosion. Therefore, the DEM acts by strengthening or softening the effects of erosion when added to the geoindicators.
Geoindicators supply information on the characteristics of geological, geomorphological, vegetation, and engineering structures, making it possible to obtain a framework of characteristics that reveal the zones that are more or less vulnerable to erosion. Thirty-five points along Pititinga beach were collected at approximately 150 m intervals between each point (Figure 2). It is possible to verify on this map that more to the north (between 21 and 35 points), the vulnerability to predominant erosion is “medium”, since it corresponds to an area dominated by foredunes that are relatively continual, from low proportions (generally lower than 2 m) and unoccupied but with ephemeral ground vegetation (of grasses distributed in a more or less regular way along the foredune – in some stretches there is no grass or just withered grass), characteristics that together produce, in this stretch, a picture of vulnerability to intermediate erosion (See Supporting Information photo F.1).
For the area between points 19 and 20, erosion remains intermediate, since even though there are buildings on this stretch, they are few and are protected by foredunes covered by herbaceous vegetation (See Supporting Information photo F.2). Between points 10 and 19 there is a zone of high and very high vulnerability. In this stretch, vulnerability increases due to the lack of a foredune and due to the dense occurrence of habitats with trees (coconut) which are fallen or about to fall, denoting a real zone of more intense erosion that is easily observable on a quick tour of the beach (Supporting Information photo F.3 and F.4). In this portion, there is the most severe and intense erosion of the beach under study, with some habitats on the seafront being extremely deteriorated or destroyed by the sea and the presence of some structures for protection from the sea, which themselves have also become desolate. The habitations, along with the non-existence of a foredune in this location, are the main factors that dictate the change in the degree of the beach´s vulnerability.
In the stretch of beach extending from points 1 to 10, a decrease in vulnerability was noted with a short stretch of medium vulnerability (represented by the colour yellow) and a bigger stretch of low vulnerability (in light green), within which another stretch of very low vulnerability is found (dark green). All of this stretch is marked by the absence of land occupation and by the presence of coastal dunes, with the sea reaching its windward slope. These dunes migrated from Maracajaú beach, a neighbouring beach to the south of Pititinga (considering the easterly direction of the coast of Rio Grande do Norte) (Supporting Information photos F.5 and F.6). However, around point 6 the medium vulnerability (in yellow) arises from the absence of coastal dunes; that is, between points 7 and 10 there are coastal dunes that interact with the sea; they are discontinuous at point 6 but arise again at point 5 and extend until point 1. Between points 3 and 5, the beach is wider, which contributes to the decrease in vulnerability of this stretch.
These differentiated characteristics allowed the zoning of the beach that characterized it in a way that is compatible with what is observable and probably compatible with what can be gauged in research of a more quantitative kind, such as surveys of transversal profiles.
The DEM was obtained from the interpolation of 1,199 points by the ordinary kriging method (Gaussian) (Figure 3). However, interpolations were also conducted using the Natural Neighbour method, for its characteristic of not generating information in areas lacking in data. Some mapped areas do not match the real ground surface, producing fewer subdivisions (classes) than the kriging classification. This method considers the number of points necessary to calculate a local mean and integrates the spatial characteristics of the sample points (size, orientation, and distribution form), permitting the creation of gentler surfaces that generate information in which there are no points or fewer samples (Landim, 2000).
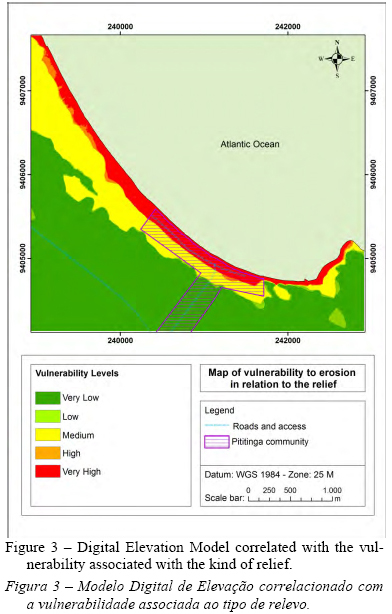
The DEM map contributes to the analysis of erosion vulnerability exclusively as a function of altitude. It should be emphasized that the DEM is not the final map of vulnerability to erosion, but it is a parameter that allows its analysis. Thus, the lower the altitude, the greater the vulnerability. It is possible to note that the nearer the sea, the greater will be the vulnerability, which decreases as the distance from the sea increases in the direction of the interior of the continent due to the increase in the altitude.
It was noted that the southern sector is the one that presents the highest altitudes close to the shoreline: altitudes are around 15 m. Along the most central beach sector, the shoreline presents low altitudes, close to zero, gently increasing in the direction of the interior and reaching an altitude of around 5 m at a distance between 120 and 150 m. The most northerly sector is marked by foredunes and deflation surfaces with altitudes between 5 and 7.4 m, which vary gently from the coast to the continent, resulting in a greater density of the colour yellow (intermediate altitudes) in an east–westerly direction. Such foredunes are always reached by the sea in the spring tides.
With the crossing of these two maps it was possible to generate a map of vulnerability to coastal erosion at Pititinga (Figure 4). Because a typically low coast is being referred to, the DEM, as a whole, reinforced the erosive characteristics revealed by the geoindicators, and with this, there was an increase in the general vulnerability of the beach and consequently, the reduction of less susceptible stretches, which can be observed on the map in Figure 4.
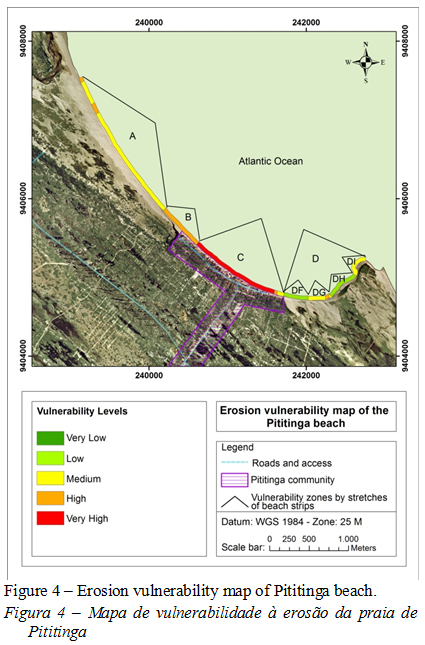
In the extreme north portion of Figure 4, in stretch A, there is a strip of beach that alternates between medium and high vulnerability, with predominance of the former. This area has already been exposed and is marked by the presence of foredunes, in the northwest–southeasterly (NW–SE) direction. In relation to the geoindicator map, the portions of low vulnerability ceased to appear, and the areas of medium vulnerability increased their size a little more.
According to Rebêlo & Brito (2004), the foredunes generally occur in the most indented part of the beach on a strip of sand that allows the embedding of vegetation, because it is far from the reach of the sea´s action, even during winter storms, and thus from the cycles of erosion and accretion that modify the beach´s profile. In the case of Pititinga, these dunes are in daily contact with the sea´s action as a function of the high tides, especially the spring tides. Thus, most of them are escarped (Figure 4), which is evidence of the erosion process in these stretches; however, at the same time there is a return to the beach of the sediments that were transported by the wind in the direction of the coast, which permits the formation of such dunes.
Still in the portion corresponding to stretch (A), there is a predominance of other characteristics that are evidence of the erosive process, such as the narrow beach (< 11 m), the presence of grassy vegetation on the foredunes (in a relatively continuous form, dried out at some points and absent on the escarped dune faces), and the lack of engineering structures.
Stretch (B) is marked by high vulnerability, since on this stretch the foredunes are smaller and exert less protection against corrosive action, as well as being further from the shoreline, which makes the topography (represented on the DEM) cause an increase in vulnerability in relation to the geoindicator map in this stretch. Near the transition stretch between strips (A), (B), and (C), there are some houses protected by foredunes smaller than 2m high (Supporting Information photo F.2).
In the most central portion of the studied area (Figure 4), in stretch (C), vulnerability is very high. The stretch of very high vulnerability (shown in the colour red) is that in which the sea acts directly on the habitations (constructions), being the most vulnerable area of the whole span under analysis. In this stretch, the beach exhibits severe erosion, there are no foredunes, vegetation is absent or fallen (coconut trees), the medium width of the dry beach is less than 11m or zero, there are holiday homes and local residents´ homes, some of which are very deteriorated and abandoned, and there are engineering structures aimed at containing the erosive action of the sea (Supporting Information photo F.4). At the end of stretch C, the colour gradually changes until it meets stretch (D).
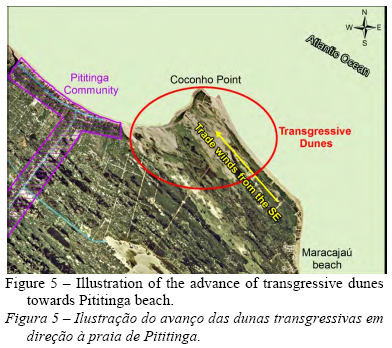
In the southeast portion of Figure 4, in stretch (D) the domiciles cease and there is a zone marked by the presence of transgressive dunes, which originate in Maracajaú beach (more to the south) and have migrated through the continent (over the point of Coconho) through the influence of trade winds from the SE, reaching Pititinga beach in such a way that its leeward slope interacts with the sea (Figure 5). There is, in this stretch, a beach–dune interaction that is a little different from that which occurs with the foredunes in the stretch discussed above.
Here the dunes are transgressive (Supporting Information photos F.5 and F.6), and currently there are restrictions regarding their sustenance by sediments originating from Maxaranguape beach (currently, sediment track located windward is substantially covered with vegetation which hinders the transport of sediments).
However, this dune field is still influenced by SE winds and consequently carries sediments to the sea; furthermore, these dunes are affected by the waves, which can cause more or less evident escarpments due to the dune dynamics and the oscillation of the tides.
In this way, they protect the beach and the continent from the erosive action of the waves and supply sediments to the beach, as do the foredunes. For this reason, in this study, they were studied from the same perspective as the foredunes, and so despite their distinct geneses, they play a similar role to geoindicators or coastal erosion. In the whole portion of the stretch (D), there are neither engineering structures nor housing.
According to the theory of the bays in zeta formation, the stretch D is the sector that suffers the greatest amount of erosion. In a zeta-form bay just after the Coconho Point, a vortex occurs which is caused by the interaction of the displacement of the longitudinal current (in this case, in a south–north direction) with a promontory or a tip. This vortex tends to generate greater erosion in this portion of the bay than in the portion further north, which is straighter (or less curved).
However, in stretch D, transgressive dunes occur that mitigate the erosive process through the exchange of sediments with the beach (by wind transport, which throws sediments into the sea, and removes sediments from the dune during contact of the sea with the dune in the high tide of syzygy), as well as by the imposition of the feature (a screen that protects the advance of the sea on the continent) (Figures 4 and 5).
Still regarding the effects of the vortex just downstream from Coconho Point (considering the direction of the longitudinal current), the portion of Pititinga beach occupied by anthropic structures suffers from erosion (Figure 5 – stretch C). The lack of a local screen – natural or anthropic – leaves the community more exposed to the coastal dynamics.
The strip of beach codified as DF is marked by the presence of the abovementioned dunes with the windward slope well developed. The stretch DG exhibits these less developed dunes and is situated between two deflation zones, which added with the effect of the DEM created a medium and high vulnerability zone. In the DH stretch, the dunes have vegetation and are lower (although they are still high); however there is an increase in the average width of the dry beach (greater than 18 m; this is the portion where this characteristic assumes greater width in the whole span of the study) and the beginning of the protection by beachrocks (which are not visible in the image used for this work, because they are covered by the seawaters). In the DI stretch, the dunes continue to have vegetation and are relatively lower, while the beachrocks are more developed the closer they get to Coconho Point and stand out because they reduce the energy of the waves that reach the present beach (Figure 5).
4. Conclusions
It is in the community of Pititinga that there exists the greatest concern regarding erosive processes. This is a reality that has existed for quite a while there, worrying the inhabitants and holidaymakers who have homes on the seafront.
In the studied area, medium and high vulnerability predominates. This is verified especially by the escarpment of the foredunes and by the destruction of buildings and engineering structures in the urban part of Pititinga on the coast.
Among the main consequences of erosion on Pititinga beach are: a) the reduction of the beach´s width; b) the disappearance or reduction of the backshore; c) the elevation in the frequency and magnitude of coastal inundations, caused by undertow (meteorological tides) or by very high spring tides; d) the loss of properties and goods along the shoreline; e) the destruction of artificial structures parallel and transversal to the shoreline; f) the loss in value of the coastal landscape, which consequently has a negative effect on the potential for tourism in the community and region.
In this context, it will be interesting to consider the preservation of the foredunes and the transgressive ones (in contact with the beach) as a feature or element of the reduction of vulnerability to coastal erosion on the beach in question. The foredunes protect the coastal zone, preventing the waves from reaching land beyond the backshore and avoiding the retrogradation of the shoreline.
The portion of the coast that has habitations should be reconstructed in such a way that measures and structures are adopted to avoid or minimize future problems arising from local coastal erosion. However, any solution in this sense, be it with the use of artificial structures or with the replacement of the beach, should be carefully studied so that the problem does not worsen with the adoption of inadequate measures.
Such recuperation should consider the conservation of the natural landscape of the beach so that it is possible to take advantage of its touristic potential. Tourism endeavours should be conducted by and for the community since in this way local customs and habits will be preserved.
The adoption of larger recesses in relation to the shoreline is a measure to be considered in urban planning.
This beach requires more studies on erosion, mainly regarding temporal analysis, taking into consideration that the testimonials of inhabitants of this region reveal that the sea has risen and has already been causing erosion and destruction for more than a decade.
The method employed also allowed a reasonable zoning of the beach regarding its vulnerability to erosion. However, there remains the need to define new parameters to refine the analysis by geoindicators. In the case of the Rio do Fogo coast and adjacent municipalities, it is noted that several beaches exhibit their destructive power attributed not only to the force of the waves but mainly to the wave and sea interaction. It is important to emphasize that Pititinga beach has a meso-tidal regime and it is noticed that during periods of full and new moons, the wave energy varies significantly between low and high tide. One way of considering the tide would be to attribute distinct weights to micro-tidal (lower weight), meso-tidal (intermediate weight), and macro-tidal (greatest weight) beaches.
It would also be interesting to consider data related to cliffs on the list of geoindicators. A comparison between studies previously conducted in the study area and the present study is unviable, since scientific studies have not been carried out previously at this beach with the aim of quantifying and assessing erosion. However, some studies conducted in nearby areas present similar results and can be integrated in an effort to unify methods.
References
Amaral, R.F. (2000) - Contribuição ao estudo da evolução morfodinâmica do litoral Oriental Sul do Rio Grande do Norte, entre ponta de Búzios e baía Formosa. 252p., Tese de doutorado, Universidade Federal do Rio Grande do Sul, Porto Alegre, RS, Brasil. Unpublished. [ Links ]
Barreto, A.M.F.; Suguio, K.; Bezerra, F.H.R.; Tatumi, S.H.; Yee M.; Guannini, P.C.F. (2004) - Geologia e geomorfologia do quaternário costeiro do Rio Grande do Norte. Geologia USP. Série Científica, 4(2):1–12. DOI: 10.5327/S1519-874X2004000200001
Barros Filho, M.N.M. (2007) - Krigagem ordinária aplicada à análise espacial da habitabilidade intra-urbana: o caso da cidade do Recife (Brasil). 10p. Anais do VII Seminário Internacional da Sociedade Latino-americana de Estudos Imobiliários, Latin American Real Estate Society (LARES), São Paulo, SP, Brasil. Available on-line at http://www.lares.org.br/2007/artigos/t039-barrosfilho.pdf. [ Links ]
Berger, A.R.; Iams, W.J. (1996) - Geoindicators: assessing rapid environmental changes in earth systems. 466p., A.A. Balkema, Rotterdam, Netherlands. ISBN: 978-9054106319 [ Links ]
Bird, E. (2008) - Coastal geomorphology: an introduction. 411p., Wiley, Chichester, England. ISBN: 978-0470517291. [ Links ]
Burrough, P.A.; McDonnell, R.A. (1998) - Principles of Geographical Information Systems. 333p., Oxford University Press, Oxford, England. ISBN: 0198233655. [ Links ]
Bush, D.M.; Neal, W.J.; Young, R.S.; Pilkey, O.H. (1999) - Utilization of geoindicators for rapid assessment of coastal-hazard risk and mitigation. Ocean & Coastal Management, 42(8):647–670. DOI: 10.1016/S0964-5691(99)00027-7
Camargo, E.C.G.; Fucks, S.D.; Câmara, G. (2004) - Análise espacial de superfícies. In: Druck, S., Carvalho, M.S., Câmara, G., & Monteiro, A.V.M. (Eds.), Análise Espacial de Dados Geográficos, pp.3.1–3.26, EMBRAPA, Brasília, DF, Brazil. ISBN: 8573832606. Available from http://www.dpi.inpe.br/gilberto/tutoriais/analise/cap3.pdf.
Carneiro, M.C.S.M. (2011) - Monitoramento das dunas utilizando o sistema de mapeamento a laser (lidar) aerotransportável: um estudo do campo de dunas do município de Rio do Fogo, RN, Brasil. 132 p., Tese de doutorado, Universidade Federal de Pernambuco, Recife, PE, Brasil. Available on-line at http://repositorio.ufpe.br:8080/handle/123456789/6122. [ Links ]
Carvalho, J.R.P.; Assad, E.D. (2005) - Análise espacial da precipitação pluviométrica no estado de São Paulo: comparação de métodos de interpolação. Engenharia agrícola, 25(2):377–384, DOI: 10.1590/S0100-69162005000200011.
Coburn, R.H. (2001) - Reducing the vulnerability of North Carolina’s coastal communities: a model approach for identifying, mapping and mitigating coastal hazards. 107p., Duke University, Durham, England. Available on-line at http://www.wcu.edu/webfiles/pdfs/psds_reducing_1991.pdf.
Cunha, E.M.S. (2004) - Evolução atual do litoral de Natal – RN (Brasil) e suas aplicações à gestão integrada. 393p., Tese de doutorado, Universitat de Barcelona, Barcelona, Spain. Available on-line at http://diposit.ub.edu/dspace/handle/2445/35301.
Cutter, S.L. (2011) - A ciência da vulnerabilidade: modelos, métodos e indicadores. Revista Crítica de Ciências Sociais [Online], (93). DOI: 10.4000/rccs.165. [ Links ]
Halligan, G.H. (1906) - Sand movement on the New South Wales coast. Proceedings of the Linnean Society of New South Wales, 31:619–640, Sydney, New South Wales, Australia. Available on-line at http://www.biodiversitylibrary.org/item/121639#page/651/mode/1up.
Komar, P.D. (1983) - Beach processes and erosion: an introduction. In: Komar, P.D. (Ed.), CRC Handbook of coastal processes and erosion, pp.1–20, CRC Press, Boca Raton, Florida, USA. ISBN: 0849302080.
Landim, P.M.B. (2000) - Introdução aos métodos de estimação espacial para a confecção de mapas. 20p., DGA/IGCE/UNESP/Rio Claro, Laboratório de Geomática, Texto Didático 02, Rio Claro, SP, Brazil. Available on-lie at http://www.rc.unesp.br/igce/aplicada/DIDATICOS/LANDIM/interpo.pdf. [ Links ]
Lima, E.Q. (2010) - Vulnerabilidade ambiental da zona costeira de Pititinga, Rio do Fogo, Rio Grande do Norte. 104p., Dissertação de mestrado, Universidade Federal do Rio Grande do Norte, Natal, Brazil. Available on-line at http://repositorio.ufrn.br:8080/jspui/bitstream/123456789/18807/1/EduardoQL_DISSERT.pdf. [ Links ]
Lima, E.Q.; Amaral, R.F. (2013) - Vulnerabilidade da zona costeira de Pititinga/RN, Brasil. Mercator, 12(28):141–153. DOI: 10.4215/RM2013.1228.0010.
Longley, P.A.; Goodchild, M.F.; Maguire, D.M.; Rhind, D.W. (2005) - Geographic Information Systems and Science. 517p., Wiley, Chichester, England. ISBN: 0-470-87001-X. [ Links ]
Mallmann, L.B.; Araújo, T.C.M. (2007) - Proposta metodológica para estimar a vulnerabilidade costeira à erosão: uma abordagem semi-quantitativa. XI Congresso ABEQUA, Belém, PA, Brazil. Available on-line at http://www.abequa.org.br/trabalhos/2007_daniele_mallmann_gerenciamento.pdf. [ Links ]
Muehe, D. (2005) - Geomorfologia costeira. In: Guerra, A.J.T. & Cunha S.B. (Eds.), Geomorfologia: uma atualização de bases e conceitos, pp.253–308, Bertrand Brasil, Rio de Janeiro, RJ, Brazil. ISBN: 852860326-1.
Nogueira, F.C.C. (2008) - Estruturas tectônicas cenozóicas na porção leste da Bacia Potiguar – RN. 104p., Tese de doutorado, Universidade Federal do Rio Grande do Norte, Natal, RN, Brasil. Available on-line at ftp://dns.ufrn.br/pub/biblioteca/ext/bdtd/FranciscoCCN.pdf.
Nogueira, F.C.C.; Bezerra, F.H.R.; Castro, D.L. (2006) - Deformação rúptil em depósitos da Formação Barreiras na porção leste da Bacia Potiguar. Geologia USP. Série Científica., 6(2):51–59. DOI: 10.5327/S1519-874X2006000300007.
Nunes, J.A. (1987) - Diagnóstico Ambiental da região de Touros/RN. 152p., Relatório de Graduação, Universidade Federal do Rio Grande do Norte, Natal, RN, Brasil. Unpublished. [ Links ]
Rebêlo, L.P.; Brito, P.O. (2004) - A importância das dunas frontais na avaliação da evolução da linha de costa: o caso da praia da Manta Rota. Anais do V Encontro de Professores de Geociências do Algarve, Vila Real de Santo António, Algarve, Portugal. Available on-line at http://onlinebiblio.lneg.pt/download.asp?file=multimedia/associa/base%20mono/33885.pdf. [ Links ]
Robin, M. (2002) - Éstude des risques côtiers sous l’angle de la géomatique. Annales de Geographie, 111(627–628):471–502. DOI: 10.3406/geo.2002.21625.
Rudorff, F.M. (2005) - Geoindicadores e análise espacial na avaliação de suscetibilidade costeira associados a eventos meteorológicos e oceanográficos extremos. 103p., Dissertação de Mestrado, Universidade Federal de Santa Catarina, Florianópolis, SC, Brazil. Available on-line at https://repositorio.ufsc.br/bitstream/handle/123456789/101954/224578.pdf?sequence=1. [ Links ]
Santos, R.F.; Caldeyro, V.S. (2007) - Paisagens, condicionantes e mudanças. In: Santos, R.F. (Ed.), Vulnerabilidade Ambiental, pp.13–22, MMA, Brasília, Brazil. ISBN: 9788577380800. Available on-line at http://fld.com.br.s125105.gridserver.com/arquivos/vulnerabilidade_ambiental_desastres_naturais_ou_fenomenos_induzidos.pdf.
Silva, L.M.; Gonçalves, R.M.; Lira, M.M.S.; Pereira, P.S. (2013) - Modelagem fuzzy aplicada na detecção da vulnerabildade à erosão costeira. Boletim de Ciências Geodésicas, 19(4):746–764. DOI: 10.1590/S1982-217020130004000014.
Silvester, R. (1960) - Stabilization of sedimentary coastlines. Nature, 188(4749):467–469. DOI: 10.1038/188467A0.
Souza, F.E.S. (2004) - Evolução morfodinâmica da região de influência estuarina do rio Curimataú/RN, com ênfase nas alterações do ambiente deposicional de manguezal e a integração de geodados em SIG. 150p., Tese de doutorado, Universidade Federal do Rio Grande do Norte, Natal, RN, Brasil. Available from http://repositorio.ufrn.br:8080/jspui/bitstream/123456789/18358/1/FlavoESS.pdf. [ Links ]
Tagliani, C.R.A. (2003) - Técnica para avaliação da vulnerabilidade ambiental de ambientes costeiros utilizando um Sistema Geográfico de Informações de Informações. Anais do XI Simpósio Brasileiro de Sensoriamento Remoto, pp.1657–1664, Belo Horizonte, Minas Gerais, Brazil. ISBN: 85-17-00017-X. Available on-line at http://www.praia.log.furg.br/Publicacoes/2003/2003c.pdf.
UNISDR (2009) - Terminología sobre reducción del riesgo de desastres. 39p., United Nations International Strategy for Disaster Reduction (UNISDR), Geneva, Switzerland. Available on-line at http://www.unisdr.org/files/7817_UNISDRTerminologySpanish.pdf. [ Links ]
Vieira, S.R. (2000) - Geoestatística em estudos de variabilidade espacial do solo. In: Nováis, R.E., Alvarez, V.H., & Schaefer, C.E.G.R. (Eds.), Tópicos em ciência do solo, pp.1–54, Sociedade Brasileira de Ciência do Solo, Viçosa, MG, Brazil.
Vital, H. (2003) - Erosão e progradação costeira no estado do Rio Grande do Norte, NE Brasil. Anais do IX Congresso da Associação Brasileira de Estudos do Quaternário, II Congresso do Quaternário de Países de Línguas Ibéricas e II Congresso sobre Planejamento e Gestão da Zona Costeira dos Países de Expressão Portuguesa, Recife, PE, Brasil. Available on-line at http://www.abequa.org.br/trabalhos/quatmar_186.pdf. [ Links ]
Vital, H. (2006) - Rio Grande do Norte. In: Muehe, D. (Ed.), Erosão e progradação do litoral brasileiro, pp.155–172, MMA, Brasília, Brazil. ISBN: 8577380289.
Yasso, W.E. (1965) - Plan geometry of headland-bay beaches. Journal of Geology (ISSN: 0022-1376), 73(5):702-714, Chicago, Illinois, United States of America. Available on-line at http://www.jstor.org/stable/30079652. [ Links ]
*Submission: 2 APR 2014; Peer review: 12 MAY 2014; Revised: 30 JAN 2015; Accepted: 23 JUN 2015; Available on-line: 1 JUL 2015
Note:
This article contains supporting information online at http://www.aprh.pt/rgci/pdf/rgci-502_Lima_Supporting-Information.pdf

