


Serviços Personalizados
Journal
Artigo
 Inglês (pdf)
 Artigo em XML
 Referências do artigo
 Enviar este artigo por email
Indicadores
-
 Citado por SciELO
 -
 Acessos
Links relacionados
-
 Similares em
SciELO
Similares em
SciELO
Compartilhar

 Permalink
Revista de Gestão Costeira Integrada
versão On-line ISSN 1646-8872
RGCI vol.15 no.3 Lisboa set. 2015
https://doi.org/10.5894/rgci570
ARTICLE / ARTIGO
Analysis of the influence of ENSO phenomena on wave climate on the central coastal zone of Rio de Janeiro (Brazil)*
Análise da influência de fenômenos ENOS no clima de ondas da porção central da zona costeira do Rio de Janeiro (Brasil)
Nair Emmanuela da Silveira Pereira@, 1; Leonardo Azevedo Klumb-Oliveira2
@Corresponding author, to whom correspondence should be addressed:
1MAG - Mar, Ambiente e Geologia – Serviços. Rua Visconde de Inhaúma, 37 - 21° andar, Centro, CEP: 20091-007, Rio de Janeiro, RJ, Brazil. e-mail: Pereira <nairemmanuela@gmail.com>
2Universidade Federal do Rio de Janeiro - Programa de Pós-Graduação em Geografia. Avenida Athos da Silveira Ramos, 274 - Prédio do CCMN - Bloco I - Cidade Universitária, CEP: 21.941-916, Rio de Janeiro, RJ, Brazil. e-mail: Klumb-Oliveira <leoklumb@gmail.com>
ABSTRACT
This paper evaluates the influence of the El Niño – Southern Oscillation on the wave climate variability in the central region of Rio de Janeiro’s coastal zone. The regional climate of the area was characterized using the WAVEWATCH III wave data model, obtained from NOAA, organized as a 35 year time series (1979-2013). These data were validated for the study area and a characterization and analysis performed by focusing on years with occurrence of strong El Niño/La Niña events. The correlation between the interannual variability of significant wave height and Oceanic Niño Index showed a slight reduction in significant wave height during El Niño years and the opposite pattern during La Niña years, with a lag of four months. This decrease could be attributed to the intensification of the South Atlantic High with a corresponding increase in the occurrence of subtropical jets during periods of El Niño. This weather change causes the blocking of cold fronts in the southern region of Brazil and the consequent reduction in the percentage of waves from the south along the southeast coast.
Keywords: climate variability, wave parameters, interannual time scale, seasonality, regional climatology
RESUMO
Este artigo busca avaliar a influência do fenômeno El Niño - Oscilação Sul na variabilidade do clima de ondas da porção central da zona costeira do Rio de Janeiro. Para tanto, a climatologia regional da área foi caracterizada a partir de dados de ondas do modelo WAVEWATCH III disponibilizado pela NOAA, organizados numa série temporal de 35 anos (1979 - 2013). Esses dados foram validados para a área de estudo e, realizada sua caracterização e análise com enfoque em anos de acentuada ocorrência de eventos de El Niño/La Ninã. A correlação da variabilidade interanual da série de altura significativa de ondas e Índice de Niño Oceânico mostrou padrão de leve redução das alturas significativas em anos de El Niño e, o inverso para anos de La Niña, com defasagem temporal de quatro meses na região. Essa redução na altura significativa das ondas pode ser atribuída à intensificação da Alta Subtropical do Atlântico Sul e aumento na ocorrência de jatos subtropicais nos períodos de El Niño. Essa alteração no padrão meteorológico causa o bloqueio de frentes frias na região Sul do Brasil e consequente redução da porcentagem de ondas de sul na região sudeste.
Palavras-chave: variação climática, parâmetros de onda, escala interanual, sazonalidade, climatologia regional
1. Introdução
The El Niño – Southern Oscillation (ENSO) is the dominant mode in ocean-atmosphere coupling variability on interannual time scales (Trenberth & Stepaniak, 2001). The El Niño is characterized as an abnormal warming in the sea surface that occurs during some years in the coastal zone of Peru and Colombia, changing the pattern of the climate systems on both local and regional levels (Trenberth, 1997). The La Niña is the opposite phase of the El Niño, characterized as an abnormal cooling in the surface water.
Although the El Niño is a regional phenomenon in the Pacific region, the climatic anomalies associated with ENSO are nearly global in extent and have a highly persistent nature (Kousky et al., 1984). The ENSO atmospheric component, the “Southern Oscillation”, corresponds to a zonal balance in the large scale air masses with a direct response in the variability of the atmospheric pressure (Aragão, 1998).
Knowledge of environmental conditions has fundamental importance for oceanic engineering (Souza & Ribeiro, 1988). As an example, beach morphology is dependent on the combined actions of local environmental conditions, sediment type and the previous wave behavior (Komar, 1976; Short, 1999; Muehe, 2011). Knowledge of the regional wave climate, in conjunction with that of morphological processes in the coastal zone, strengthens coastal management studies and the implementation of engineering structures at the coast (Pianca et al., 2010).
Comprehending the relationship between ENSO events and changes in environmental parameters has numerous applications, such as the evaluation of the energetic potential of winds and waves in the coastal zone and in coastal management to support public policies. In a study of the energy potential of wind in the state of Ceará (Brazil), Araújo Júnior et al. (2014) verified that conditions to generate wind energy were better during the 1997-1998 El Niño period than during the La Niña event of 1998-1999, principally on the coast. Impact studies of El Niño/La Niña events on regional climates can provide improvements to climate prediction techniques to support public policies. Changnon (1999) studied the impact of the 1997-1998 El Niño event on the economy and loss of life in the United States, using the state of California as an example. An analysis of ENSO predictions and ENSO’s economic and social effects led the government of California to conduct impact reduction efforts, which decreased subsequent economic and human losses.
As yet, Brazil is still lagging studies that identify wave patterns during El Niño periods, and, as a consequence, also lacks the public policies regarding coastal management and coastal hazards that relate to those events.
Accordingly, this work aims to characterize the regional wave climate of the central coastal zone of Rio de Janeiro through the analysis of a global wave model and the evaluation of apparent changes in the patterns of this data on an interannual time scale, focusing on several years during which El Niño and La Niña events occurred.
2. Methodology
2.1. Study area
The central area of the coastal zone of Rio de Janeiro used in this study is comprised of the waters from the continental slope to the coastal waters near the shoreline (Figure 1).
The wave climate for this region is that of predominantly “good weather” conditions with NE winds and a presence of storm waves mainly from the South Atlantic High (SAH) associated with frontal systems from the east-southeast (Silva et al., 2009).
Observations indicate that the mean wave height varies between 1.6 to 2.0 m during the “good weather” conditions. Waves with height greater than 3.0 m frequently come from the S and SW quadrants (Bastos & Silva, 2000). Waves from the NE and E are low energy but the most frequent, based on a comparison of the wave energy distribution by incidence direction (Muehe & Corrêa, 1989). According to Diretoria de Hidrografia e Navegação (DHN/Navy of Brazil), the tidal variation ranges from 1.3 m at spring tides to 0.3 m at neap tides.
2.2. Data set
To determine the wave climate during El Niño/La Niña event along the Rio de Janeiro coast, simulation data was obtained from the WAVEWATCH III wave model, available from the National Oceanic and Atmospheric Administration (NOAA), with a global spatial resolution of 0.5° and 3 h temporal resolution (NOAA WAVEWATCH III - NWW3).
Two versions of the model dataset were used. The first was a reanalysis of historical waves hindcast using WAVEWATCH III, version 2.22 (Tolman, 2002) for the period from January 2010 to December 2013. The second was a reanalysis of waves hindcast using WAVEWATCH III, version 3.14 (Tolman, 2009) with input data from the Climate Forecast System Reanalysis Reforecast (CFSRR) wind reanalysis (Spindler et al., 2011), obtained from the National Center for Environmental Prediction (NCEP) from January 1979 to December 2009 (Chawla et al., 2012, 2011).
From this data, the variables used were significant wave height, peak period and peak direction (ranging from 0 to 360°, where 0 represents waves from the north) which were extracted for the total period from January 1979 to December 2013 (35 years). To represent the central coastal region of Rio de Janeiro, near the city of Cabo Frio, the area was defined as between 22.5 - 23.5° S and 42.5 - 41.5° W (Figure 1).
The Oceanic Niño Index (ONI) series used are available from NOAA’s Climate Prediction Center (Figure 2). This index was calculated as a 3 month moving average of the temperature anomaly over the period under analysis using the Extended Reconstructed Sea Surface Temperature - ERSST.v3b dataset (Smith et al., 2008) for the Niño 3.4 region (5° N – 5° S, 120° W – 170° W). According to Larkin & Harrison (2005), NOAA defines El Niño events as periods of three consecutive months with an ONI that exceeds 0.5°C, while La Niña events are identified for an ONI below -0.5°C.
From this index, we selected the years 1997 and 1998, which represented the beginning and the end, respectively, of the strongest El Niño period of the 20th Century (Wolter & Timlin, 1998). We also selected the year 2000, a representative year within a long period of La Niña (from 1998 to 2001) that occurred after the 1997-1998 El Niño, classified as a moderate to intense event (Shabbar & Yu, 2009). For a more significant representation of the mean pattern in El Niño/La Niña years, the years with major temporal persistence of the phenomena were chosen (1983, 1987, 1992, 1997 and 2003 for El Niño years and 1988, 2000 and 2008 for La Niña years).
For the correct application of the model’s data, adequate validation is necessary. Data validation of NWW3 was performed using a statistical comparison to data from a stationary meteo-oceanographic buoy using a period from July 17 to December 31, 2013. This buoy from the Instituto de Estudos do Mar Almirante Paulo Moreira (IEAPM/Navy of Brazil) is part of the SIODOC project (Sistema Integrado de Obtenção de Dados Oceanográficos) and is located at 22° 59.62’ S – 42° 11.65’ W. The resolution of the data was in 1 hour time intervals and is available at http://metocean.fugrogeos.com/marinha/.
2.3. Statistical treatment and model validation
For many applications, a time series can be considered as a linear combination of periodic or quasi-periodic components (with fixed amplitudes and phases) on which a tendency and high frequency noise are superposed (Emery & Thomson, 2001). Fourier analysis thereby considers as a basic premise that the time series can be reproduced as a sum of wave signals (sines and cosines) with the mean value of the series. The time series was decomposed to observe the individual signature of each wave signal. To calculate the significance of the power spectrum’s peaks, the red noise was computed based on a first order autoregression process (Zhang & Moore, 2011). Peaks in the time series’ power spectrum that are above the red noise’s Fourier spectrum have a 95% confidence level.
For the statistical analysis, the time scale of the buoy data was reduced to obtain 3 hour means. A spectral filter was used to identify and remove high frequency signals. The high frequency noise can be related to a series of factors, such as characteristics of the equipment used. The significant wave height and peak period were chosen for analysis from the buoy data because the peak direction data was not available for the buoy dataset. The NWW3 model data used to compare with the buoy data uses the point 23° S – 42° W, which was the closest to the point where the buoy was anchored.
The mean and standard deviation were calculated for each variable over the analysis period. The correlation coefficient is used to determine how well two (or more) variables covary in time (or space) (Emery & Thomson, 2001). Considering two distinct series varying in time, the linear correlation coefficient can be calculated considering its displacement in time, referred to as cross correlation.
This coefficient suggests the linear dependency of the compared data because the values indicate their degree of dispersion around the adjustment function (linear regression). It functions as a quantifier of the intensity and direction of this linear relationship (Chen et al., 2013). The values of this parameter oscillate between 1 and -1, where values near zero indicate that the variables are not related. High positive values indicate that the variables exhibit similar behavior, while high negative values indicate an inverse relationship in the behavior of the variables.
Considering an analysis focused on interannual variability, a statistical treatment was applied to the time series of the wave parameters to remove the seasonal signature and calculate cross correlations between the wave parameters and the ONI. The “climatology” method was used, which consisted of subtracting the monthly climatology from the 35 years of the series that had previously been reduced to monthly time steps. A 3 months running mean was then applied. This is the same methodology used to obtain the ONI data (Douglass, 2011). The objective of this filtering was to remove characteristic oscillations due to seasonality and other events with high frequency such as frontal system passages.
Verification that both variables are related can be obtained from the empirical evidence that there is a correspondence in the patterns of those variables higher than expected than if using random data (Orcutt & James, 1948). To test the significance of the correlations between wave parameters and the ONI, random series were generated from each of the original series. These were correlated, forming a population of correlations comprising a total of 10,000 samples.
The probability of a random variable showing a determined value is represented by the Cumulative Distribution Function (CDF). A non-parametric estimate was used to adjust the CDF by determining an empirical (ECDF), thus without use of a theoretical model with a specific distribution.
In this study, the Kaplan-Meier estimator was used to estimate the CDF (Kaplan & Meier, 1958; Lawless, 2002) as an empirical function, considering a test for full population (N = 10,000) and another for a subset of that population (N = 200). For comparison with the empirical method, an adjustment of the theoretical CDF of the resultant population distribution using a normal function (Gaussian) was selected.
For the validation of NWW3 data with the buoy data and the comparison between theoretical and empirical CDFs, the mean absolute error (MAE) and relative (RMAE) were also calculated. The RMAE is the MAE normalized using the average values of the buoy data to obtain the proportion of the model error to the mean value observed in nature. The MAE is one of the best parameter choices to quantify the average error, using the magnitude of the absolute difference between the modeled and observed data at each point of time series (Willmott, 1982; Willmott & Matsuura, 2005). For this parameter, zero represents the perfect adjustment between modeled and observed data.
As part of the NWW3 validation, a parameter proposed by Willmott (1981) was also calculated. A parameter value of 1 is a perfect fit between the results obtained by the model and those observed, while 0 represents a complete mismatch. Although the correlation indicates the interdependence of the series (the degree of dispersion of the series considering a linear adjustment), the Willmott parameter is indicative of the similarity in the compared data, related to the remoteness of the estimated values observed in both series (Chen et al., 2013).
3. Results and discussion
3.1. NWW3 data validation
The following image (Figure 3) shows the significant wave height and peak period data of NWW3 contrasted with buoy data acquired near Arraial do Cabo, before and after receiving spectral treatment. If the high frequency spectrum was removed from the data, it did not change the overall behavior of the curve, but did eliminate the high frequency noise in the original data. Thus, there is a reduction of the standard deviation of the filtered data values from the original, and a slight attenuation of extreme events.
It is remarkable that the modeled data show an overall behavior similar to data found in the environment. The linear correlation index calculated for the buoy data after spectral filtering was approximately 0.80 for the significant wave height and 0.75 for the peak period. The Willmott parameter values were 0.95 for significant wave height and 0.92 for the peak period.
In this context, no reference values have been established for the Wilmott parameter, but it is generally accepted that values around 0.5 indicate that the model reproduces about half of the observed variance (Hetland & Dimarco, 2012). Chen et al. (2013) consider an indication of good accuracy to be correlation values greater than 0.77 and the Willmott parameter above 0.70. The high values for both parameters indicate that in addition to showing a similar oscillation pattern, the data sets show a strong fit, which demonstrates that the difference between each pair of points for this series is similar for the entire set of series.
On first examination, observing the average values of the series for both the model and buoy data, a notable overestimation by the model is evident. The mean modeled significant wave height is approximately 0.47 m higher in comparison to the values given by the buoy. The same occurs for peak period, but with a smaller difference, with an average of 0.16 s greater for the model than for the buoy. For either the significant wave height or the peak period, the differences between the sampled and modeled mean values lie within the standard deviation range.
The average error, which quantifies the mean difference between the model values in comparison to the observed data from the buoy, was approximately 0.51 m for significant wave height (35.69% error), while for the peak period this value was 0.99 s (10.26% error). A comparison between observed data and NWW3 near the Florianópolis region by Pianca et al. (2010) confirms the similarity between model and environment, showing the same pattern of model’s overestimation for the significant wave height data.
Hanson et al. (2009) reviewing NWW3 performance in the Pacific Ocean also found a remarkable correlation with observational data, greater than 0.78 for wave height and 0.88 for the period. That study found a maximum error of 0.5 m in wave height that is associated with the use of the hindcast altimetry data, which tends to overestimate wave height values. Rogers et al. (2012) found a 10% overestimation in the referred data.
For both variables in the NWW3 data we can observe that the first two weeks of November presented a constant value, differently of the buoy data. This can represent many types of errors, probably related to the data assimilated by the model in the reanalysis process. The period occurs after high values of significant wave height and peak period, which can suggest the approximation of a cold front passage in the study area both in the beginning and the middle of the period. These consecutive passages of cold fronts can promote cloudcover persistence, which prevents data collection via remote sensing.
The validation authenticates the use of these data for environmental studies. However, although validated for the North and Tropical Atlantic, models on a global scale such as this need further comparison with data collected in the vicinity of the south and southeast Brazilian Continental Shelf. Data sets such as NWW3 formerly had a significant discrepancy in the Southern Hemisphere, particularly as a consequence of few measurements in situ in these regions (Caires et al., 2004). This type of validation would improve models with global resolution in the South Atlantic region.
3.2. Wave climate characterization
Starting from the analysis of time series for wave parameters in the region (see Supporting Information I), it can be seen that the significant wave height for the study area has an average of approximately 1.80 ±0.51 m, with marked seasonality that results in an average oscillation limited by the standard deviation. This same seasonal pattern is observed for both the peak direction (147.42 ± 43.52°) and peak period (9.80 ± 2.25 s).
In this context, the months of May and September exhibited a pattern of higher significant heights predominantly from the South quadrant, with long periods (around 13 s). In contrast, the austral summer is characterized by lower significant wave heights predominantly from the East with shorter periods (around 7.5 s). Figures 4a, 4b and 4c show that significant wave height varies between 1 and 4 m for the majority of the values, with the highest concentration of values around the average. The peak period shows the same pattern, with samples concentrated between 5 and 15 s and a predominance of samples around the average value. The peak direction ranges from 50° to 220° and presents a bimodal pattern, with one mode centered at 90° and another around 180°.
The monthly climatology of wave parameters (Figures 4d, 4e and 4f) show that the maximum average values for significant wave height occur at the end of the austral winter (with average values of approximately 2.0 m) and the minimum in late summer (with average values of 1.6 m). Unlike significant wave height, the direction and peak period have maximum average values in late autumn (with average values around 10.5 s - SSE) and their minimum in the middle of summer (with average values around 8.5 S-SE). The maximum values for these variables preceded the maximum values of significant wave height.
Surface gravity waves can be categorized into two types. The first type, "wind sea" waves, have periods of less than 10 s with an irregular appearance and short wave lengths, and are generated by local winds. The second type are "swell" waves, which have periods between 10 and 20 s, characteristic long wave lengths and an almost sinusoidal form, present far from their generation area (Holthuijsen, 2007; Laing, 1998).
The wave regime in this region is controlled by the South Atlantic High and the passage of cold fronts (Pianca et al., 2010). Thus, with respect to the region under consideration, the first mode (NE-SE) is characterized as waves associated with the South Atlantic Anticyclone as a result of the downward arm of the Hadley cell (Campos, 2009) which promotes moderate winds. The associated "good weather" waves have a low peak period (up to 7.5 s). The second mode (S-SW) is associated with the migration of polar air masses forming cold fronts in the region; these waves present peak periods between 11 and 15 s and carry more energy, noted by Muehe & Corrêa (1989), Pianca et al. (2010) and Souza & Ribeiro (1988).
The directional histograms for significant wave height and peak period (Figure 5) distinctly show the same general pattern. The highest concentration of waves is from the quadrant between the NE and SW. The highest significant wave height values are concentrated between the SE and SW, with predominant periods longer than 10 s. The waves with shortest periods (less than 10 s) originated from the direction between NE and SE were the minor percentage of the total These two patterns of waves represent the two distinct types of wave characterized by Souza & Ribeiro (1988). As seen in these data, Bastos & Silva (2000) similarly observed that for the region, the occurrence of waves higher than 3.0 m most often originates in the S and SW.
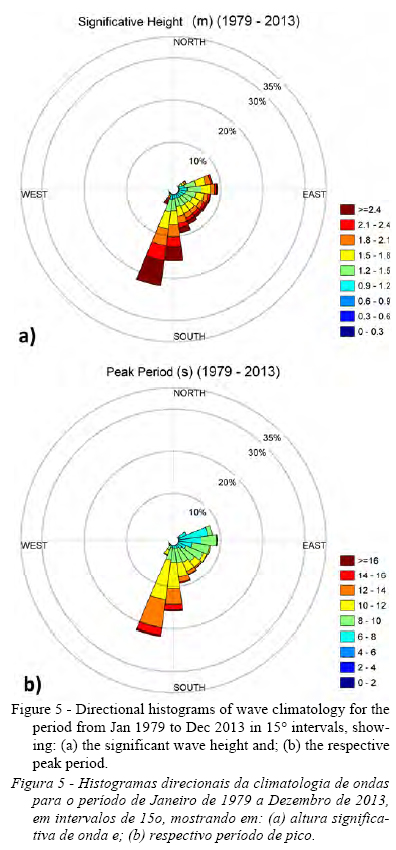
Figure 6 shows climatological directional histograms observed for the four seasons of the year, in which all seasons maintain the mean pattern of having greater significant wave heights and peak periods from the S. In the austral summer, the waves appear to be distributed in a uniform pattern from the E to S quadrants, while in autumn, a higher concentration of wave samples originates from the S and SW, presenting a nearly unimodal pattern. This pattern is repeated in the winter with a greater occurrence of waves from the E. It returns to a more homogeneous pattern in the spring, however, with a larger signature of S-SW waves and higher rates of waves with over 1.8 m heights. This pattern is similar to that verified by Pianca et al. (2010) for the Brazilian southeast region.
Concurring with our findings, in a wave climatology study from 1991 to 1995, Vale (2012) observed that the greatest percentage of extreme events of NE waves in the Campos Basin region occurred during the austral summer and had a lower incidence in the fall.
3.3. Interannual variability and El Niño interference in regional climatology
We can observe in Figure 7, that the periods of 1 and 1.5 years are detached in the Fourier’s spectrum from the time series of the three wave parameters under analysis, as discussed previously. The seasonality and other signals with high frequencies observed in this time series masked the observation of interannual variability.
We show, in Figure 8, the frequency spectrum related to the ONI for the period 1979 to 2013 with the same wave data after statistical treatment to remove seasonality. The highest spectral power values refer to frequencies lower than 1 cycle by year (c.b.y). It is remarkable that after statistical treatment to remove seasonality, the wave data showed greater emphasis on low frequency signals without significantly changing the default signature. However, the high frequencies were still very prominent. This noise should have a negative influence on the correlations between these data and the ONI.
Comparing the ONI and the significant wave height after removal of seasonality no clear correlation is apparent between all the datasets for the three parameters, which is confirmed by the low linear correlation values shown (see Supporting Information II). However, according to Trenberth & Stepaniak (2001), the definition of El Niño indices (which use anomaly temperatures in the Pacific to identify the El Niño and La Niña periods) do not permit the discrimination of the characteristics of its effects in other regions; this causes difficulty in mapping a relationship between this index and the variability of some parameters on the Brazilian coast.
Examining cross-correlations between series for parameters concerning the wave and the ONI (Figure 9), the highest correlation coefficient was observed for the significant wave height parameter, approximately -0.19, with a time delay of four months. This delay suggests that the most likely correlation occurs with a 4-month response lag. The peak direction showed a negative correlation of approximately -0.14, with a lag of 8 months. The peak period, however, showed a positive correlation of 0.11 with zero lag. These correlation values, although apparently small, are above the minimum level of significance, even when using tests with a reduced N sample size (Figure 10). We need to consider the signature of the high frequency in wave parameters’ data, which can reduce comparison of these two datasets.
This data indicates that in El Niño years (positive ONI), there would be a slight reduction in significant wave heights in the coastal region of Rio de Janeiro, with a delay of 4 months from the peak of the El Niño in Pacific waters. A study by Enfield & Mayer (1997) showed a correlation of -0.3 with a gap of 4 months between the temperature anomalies in the surface sea water in the South Atlantic and the Pacific surface temperature index, an index similar to the NINO3 index that is often used in studies of ENSO cycles (Enfield & Mayer, 1997). In the same study, the wind data preceded the response by two months, the time expected for variations in atmospheric patterns to be reflected in the surface of the sea.
After presuming that there was no strong correlation between the ONI and the other wave parameters, we chose to observe the wave pattern for each season of the year according to the index shown in Figure 2, considering years with significant El Niño and La Niña events. These data were compared for a more detailed observation of differences during ENSO periods using the climate pattern shown in the 31 year series of wave behavior data and focusing on the differences in the seasonality of these parameters.
The beginning of an El Niño period, 1997, was examined to compare its wave pattern (see Supporting Information III) to the wave climatology (Figure 6). In the summer, a smaller percentage of incident waves with more than 1.8 m in height were observed, along with higher concentration of waves from the E-NE. In autumn, the pattern remained similar to the general climatology, while in winter a clear reduction in the percentage of waves from S-SW was noted. These waves returned to intensify in the spring, exceeding the percentages present in the general climatology for the period 1979-2013.
For the El Niño year 1998 (see Supporting Information IV), which comprises the end of the same El Niño event referenced above, the wave pattern showed a similar pattern to that of 1997 throughout the year, except during winter and spring. The winter period showed a high incidence of waves from the E with low values for the significant wave height and peak period, while a higher occurrence of waves from the SE was observed in the spring.
For the La Niña year 2000 (see Supporting Information V), a higher percentage of E-NE waves was observed in summer if compared to the general climatology, as was observed in El Niño events. A reduction in the occurrence of S-SW waves was observed during the autumn and an increase in winter. During the spring, an increase in the percentage of E-NE waves was noted.
Thus, in general, the reduction of the average of significant wave height in El Niño years shown in the cross-correlation data is seen most clearly with respect to reducing the percentage of incident waves from the SSE-SSW during the winter period in those years. The reverse is true in La Niña years. Also observed in El Niño events is an increase in the percentage of waves coming from ENE in summer and autumn, while in the spring season, La Niña corresponds with an increase of ENE-ESE waves and decrease in SSE-SSW related to the El Niño.
Examining the mean pattern of the years’ compositions with the occurrence of the most persistent El Niño and La Niña events (Figure 11 and 12, respectively), we observed a general pattern very similar to that observed in the seasonal climatology of the 35 years (Figure 6) for all seasons. It is evident, however, that a slight decrease in SSE-SSW wave percentages occurs during the winter in El Niño years, while La Niña years have slight increase in wave percentages from the same direction, for the same season. This fact corroborates the observations in the analysis of specific El Niño years/La Niña events, but also shows that these events exhibit different characteristics through the seasons in different years.
Low correlation values are justified by the small variation in the wave percentages, concentrated in a specific season. However, the persistence of this characteristic in various events of El Niño/La Niña needs to be emphasized.
In general, the literature shows that in El Niño events there is a weakening of the ascending branch of the Hadley cell over the tropics in South America and the Intertropical Convergence Zone (ITCZ) is inhibited; the opposite occurs in La Niña events: an intensification occurs in ascending and descending branches associated with Walker and Hadley cells (Souza & Ambrizzi, 2002). Kousky et al. (1984) observe that the strengthening of the Hadley cell favors the intensification of the trade winds, reflecting a higher transfer of energy to the E waves in the study area for periods of El Niño, reversing this process in periods of La Niña. In seasonal climatologies (Figure 6, 11 and 12), it can be seen, discreetly, that a higher percentage of waves from NE-SE quadrant occurs in the years of El Niño events.
In El Niño events, there is a reduction in air pressure over the Pacific, increasing upward movements in the region, changing the zonal circulation (Walker cell), which increases the downward movements in tropical regions such as the Brazilian Northeast. In the state of Ceará, for example, an intensification of the winds on the surface is observed in El Niño periods and a weakening of the winds in the La Niña periods (Araújo Júnior et al., 2014). The atmospheric circulation also changes in extratropical regions with the intensification of the trade winds, which causes the obstruction and therefore a change in trajectory and intensity of frontal systems (Aragão, 1998).
Using the El Niño event of 1982-1983 as an example, Kousky et al. (1984) reported both the occurrence of a significant intensification of upper tropospheric subtropical jets and many blocking events at mid-latitudes. Combined, these co-occurrences favor the permanence of persistent frontal systems in southern Brazil, confirmed by Silva et al. (2009). These jets and blocking events can reduce the approach of these frontal systems to the region under study. This hypothesis would explain the lower incidence of S-SW waves with high significant wave height and peak period values during El Niño years (especially in winter). The south waves resulting primarily from frontal systems from the southern region should occur with greater frequency in winter In the other hand, the South Atlantic High weakens in periods of La Niña, reducing the intensity of the trade winds and favoring the migration of cold fronts that affect the southeast.
El Niño periods also influence the coastal sediment budget through the wave climate. Fernandez & Muehe (2010) observed that the blocking of cold fronts during these periods decreased the occurrence of cold fronts on Rio de Janeiro's coast, with a consequent reduction of the wave’s transposition events in the area of Massambaba Beach. That reduction inhibited the recovery of the sedimentary stock, which resulted in a negative sediment budget for those years.
Despite the variability of the wave percentages from S-SW in El Niño/La Niña years being small, we cannot forget that this is a mean pattern that does not reflect the exact number of occurrences of cold fronts, their intensity in the study area or their reflections in the wave pattern. This apparent slight increase in the percentage of waves in La Niña years, as an example, can strongly affect the coastal sediment dynamics. A higher average percentage of waves in the winter as a result of a higher occurrence of cold fronts in a short period can result in a high remobilization of sediments along the coastline without sufficient time for the replacement of these sediments. This may substantially change the beach morphology in that period.
Other interannual variability modes can influence the pattern of incident waves, such as the Tropical Atlantic Dipole. As for the ENSO in the Pacific, this is the result of variability in large-scale ocean-atmosphere coupling, centered on the southern autumn period (Souza & Nobre, 1998). In this case, the sea temperature anomalies in the surface in the Tropical Atlantic interfere with meridional circulation (the Hadley cells) and interfere in the southern shift of the ITCZ. With warmer waters in the North Atlantic tropical zone and cooler in the South Atlantic tropical zone, there is an intensification of the downflow in the southern portion of the tropical Atlantic; this causes, for example, reduced rainfall in northeastern Brazil (Aragão, 1998).
It is noteworthy that the action of these two combined events can promote variability in the responses to atmospheric circulation and consequently to the waves generated by wind in the South Atlantic, depending on the separate intensities of these events. This explains why the variability of wave parameters in an interannual analysis are only partially explained by the ONI and that the correlation values tend to be reduced.
4. Conclusions
This research aimed to detect and analyze the variability of regional wave climate from Rio de Janeiro state’s central coast in relation to ENSO events. Wave model data from WAVEWATCH III (NWW3) available from NOAA were used to characterize the interannual and seasonal wave climate in the region. The model was validated here with data from an oceanographic buoy anchored in the study area and a strong correlation observed. The NWW3 data for the Rio de Janeiro continental shelf were also compared to studies in the region to validate the data.
The correlations between wave parameters and the Oceanic Niño Index (INO) had many low values, nonetheless significant, that demonstrated the existence of a relationship between the variabilities of these parameters, particularly for significant wave height. This parameter had a correlation of approximately -0.17, with a time lag of four months. It represents a small but statistically significant value. This indicated that in El Niño years, a tendency to reduce the significant wave height existed with a several month delay in the response of the local waves, while an inverse pattern occurred in La Niña years. An increase in wave incidence was observed from the S and SW quadrants in La Niña years, especially in boreal winter, causing the relative increase in wave heights values.
The lag observed for significant wave height proved consistent with values reported for the lag wind, noting that the variation in waves is to a large extent caused by the attenuation of the frequency of events from the S quadrant during El Niño periods. These events are associated with large percentage of the occurrences of frontal systems. This pattern of reduction in significant wave heights in El Niño years is noted in the literature, attributed to the intensification of the center of the South Atlantic High combined with increase in the occurrence of subtropical jets in these periods. This results in a larger barrier to cold fronts, these being retained in the southern region of Brazil and reaching the Southeast less frequently.
Turning to the low correlation values calculated for the period and direction peak, these indicate a negligible interference or a lesser degree of reliability for interpretation as a single variable. However, the combined analysis of this parameter with the significant wave height in the directional histograms shows a consistency in the pattern observed for the different periods analyzed.
The occurrence of other modes of variability with an interannual character in the Atlantic Ocean influences the variability of the wave parameters in the regions where the ONI is responsible for only a portion of this variability; this increased the plausibility of the low direct correlation values between the series. A thorough study of the other modes of interannual variability that could influence this data will be required.
Therefore, we suggest that analysis of the waves under the El Niño/La Niña bias should continue, especially in the southern hemisphere, both in other regions of Brazil and also along the occidental African coast. This would enhance the understanding of the remote effects of wind variability in the Pacific Ocean to other regions of the Atlantic Ocean and the corresponding response of the ocean.
Acknowledgments
The authors thank the Support Program for Research and Development (Programa de Suporte à Pesquisa e Desenvolvimento - PSPD) at MAG - Mar, Ambiente e Geologia, the division responsible for financing, encouragement and providing the physical infrastructure for data processing and scientific development. The authors also thank the Universidade Federal do Rio de Janeiro (UFRJ) and the Coordenação de Aperfeiçoamento de Pessoal de Nível Superior (CAPES) for physical and financial support for the research.
References
Aragão, J.O.R. (1998) - O Impacto do ENSO e do Dipolo do Atlântico no Nordeste do Brasil. Bulletin de l'Institut Français d'Etudes Andines, 27(3):839–844. DOI: 10.1590/S1415-43662009000400014
Araújo Júnior, l.M.; Silva, E.M.; Costa, A.A.; Sales, D.C.; Vasconcelos Junior, F.C.; Guimarães, S.O. (2014) - Avaliação dos eecursos eólicos simulado no Estado do Ceará: Um estudo de caso para o El Niño 97/98 e para La Niña 98/99. Revista Brasileira de Meteorologia, 29(1):139–152. DOI: 10.1590/S0102-77862014000100013
Bastos, A.C.; Silva, C.G. (2000) - Caracterização morfodinâmica do litoral norte fluminense, RJ, Brasil. Revista Brasileira de Oceanografia, 48(1):41–60. DOI: 10.1590/S1413-77392000000100004
Becker, J.J.; Sandwell, D.T.; Smith, W.H.F.; Braud, J.; Binder, B.; Depner, J.; Fabre, D.; Factor, J.; Ingalls, S.; Kim, S-H.; Ladner, R.; Marks, K.; Nelson, S.; Pharaoh, A.; Trimmer, R.; Von Rosenberg, J.; Wallace, G.; Weatherall, P. (2009) - Global bathymetry and elevation data at 30 arc seconds resolution: SRTM30_PLUS. Marine Geodesy, 32(4):355–371. DOI: 10.1080/01490410903297766
Caires, S.; Sterl, A.; Bidlot, J.-R.; Graham, N.; Swail, V. (2004) - Intercomparison of different wind-wave reanalyses. Journal of Climate, 17(10):1893–1913. DOI: 10.1175/1520-0442(2004)017<1893:IODWR>2.0.CO;2
Campos, R.M. (2009) - Análise dos extremos de onda no Rio de Janeiro associados a ciclones extratropicais no Atlântico Sul. 241p, Master's thesis, Universidade Federal do Rio de Janeiro, Rio de janeiro, RJ, Brazil. Available on-line at http://livros01.livrosgratis.com.br/cp103377.pdf [ Links ]
Changnon, S.A. (1999) Impacts of 1997-98 El Niño Generated Weather in the United States. Bulletin of the American Meteorological Society, 80(9):1819–1827. DOI: 10.1175/1520-0477(1999)080<1819:IOENOG>2.0.CO;2
Chawla, A.; Spindler, D.; Tolman, H. (2012) - 30 Year Wave Hindcasts using WAVEWATCH III with CFSR winds - Phase I. MMAB Contribution No. 302: NCEP/NOAA, 12p., College Park, MD, United States of America. http://polar.ncep.noaa.gov/mmab/papers/tn302/MMAB_302.pdf [ Links ]
Chawla, A.; Spindler, D.; Tolman, H. L. (2011) - A thirty year wave hindcast using the latest NCEP Climate Forecast System Reanalysis winds. Proc. 12th International Workshop on Wave Hindcasting and Forecasting, Kohala Coast, Hawai’i, HI, p.1-11., College Park, MD, United States of America. Available on-line at http://polar.ncep.noaa.gov/mmab/papers/tn296/MMAB_296.pdf
Chen, F.; Shapiro, G.; Thain, R. (2013) - Sensitivity of Sea Surface Temperature Simulation by an Ocean Model to the Resolution of the Meteorological Forcing. ISRN Oceanography, 2013(ID 215715):1–12. DOI: 10.5402/2013/215715
Douglass, D.H. (2011) - Separation of a Signal of Interest from a Seasonal Effect in Geophysical Data: I. El Niño/La Niña Phenomenon. International Journal of Geosciences, 2:414-419. DOI: 10.4236/ijg.2011.24045 [ Links ]
Emery, W.J.; Thomson, R.E. (2001) - Data analysis methods in physical oceanography. 2nd. ed. 658p., Elsevier, Amsterdam, Netherlands. ISBN: 9780080477008 [ Links ]
Enfield, D. B.; Mayer, D. A. (1997) - Tropical Atlantic sea surface temperature variability and its relation to El Niño Southern Oscillation. Journal of Geophysical Research: Oceans (1978–2012), 102(C1):929–945. DOI: 10.1029/96JC03296
Fernandez, G.B.; Muehe, D. (2006) - Algumas considerações sobre o efeito do fenômeno El Niño sobre feições costeiras ao longo da costa brasileira. GEOgraphia, 8(15):115-128, Rio de Janeiro, RJ, Brazil. Available on-line at http://www.uff.br/geographia/ojs/index.php/geographia/article/viewArticle/191 [ Links ]
Hanson, J.L.; Tracy, B.A.; Tolman, H.L.; Scott, R.D. (2009) - Pacific Hindcast Performance of Three Numerical Wave Models. Journal of Atmospheric and Oceanic Technology, 26(8):1614–1633. DOI: 10.1175/2009JTECHO650.1
Hetland, R.D.; Dimarco, S.F. (2012) - Skill assessment of a hydro-dynamic model of circulation over the Texas–Louisiana continental shelf. Ocean Modelling, 43-44:64–76. DOI: 10.1016/j.ocemod.2011.11.009
Holthuijsen, L.H. (2007) - Waves in oceanic and coastal waters. 387p., Cambridge University Press, Cambridge, United Kingdom. ISBN: 9780511618536 [ Links ]
Kaplan, E.L.; Meier, P. (1958) - Nonparametric Estimation from Incomplete Observations. Journal of the American Statistical Association, 53(282):457-481. DOI: 10.2307/2281868 [ Links ]
Komar, P.D. (1976) - Beach processes and sedimentation. 429p., Prentice-Hall, Inc., New Jersey, United States of America. ISBN: 0130725951. [ Links ]
Kousky, V.E.; Kagano, M.T.; Cavalcanti, I.F. (1984) - A review of the Southern Oscillation: oceanic‐atmospheric circulation changes and related rainfall anomalies. Tellus, 36(5):490–504. DOI: 10.1111/j.1600-0870.1984.tb00264.x
Laing, A. K. (1998) - An Introduction to Ocean Waves. In: E. Bouws (org.), Guide to Wave analysis and forecasting, pp.1–14, 2nd Ed., World Meteorological Organization, Geneva, Switzerland. ISBN: 9263127026. Available on-line at http://www.wmo.int/pages/prog/amp/mmop/documents/WMO%20No%20702/WMO702.pdf
Larkin, N.K.; Harrison, D.E. (2005) - On the definition of El Niño and associated seasonal average U.S. weather anomalies. Geophysical Research Letters, 31(L12705):1-4. DOI: 10.1029/2005GL022738 [ Links ]
Lawless, J.F. (2002) - Statistical models and methods for lifetime data. 2nd Edition, 664p., Wiley-Interscience, John Wiley & Sons, Hoboken, NJ, USA. ISBN: 9780471372158 [ Links ]
Muehe, D.; Corrêa, C.H.T. (1989) - Dinâmica de praia e transporte de sedimentos na restinga de Maçambaba, RJ. Revista Brasileira de Geociências (ISSN: 0375-7536), 19(3):387–392, Sociedade Brasileira de Geologia, São Paulo, SP, Brazil.
Muehe, D. (2011) - Erosão Costeira - Tendência ou Eventos Extremos? O Litoral entre Rio de Janeiro e Cabo Frio, Brasil. Revista de Gestão Costeira Integrada, 11(3):315-325. DOI: 10.5894/rgci282 [ Links ]
Orcutt, G.H.; James, S.F. (1948) - Testing the significance of correlation between time series. Biometrika, 35(3/4):397–413. Article Stable URL: http://www.jstor.org/stable/2332358
Pianca, C.; Mazzini, P.L.F.; Siegle, E. (2010) - Brazilian offshore wave climate based on NWW3 reanalysis. Brazilian Journal of Oceanography, 58(1):53–70. DOI: 10.1590/s1679-87592010000100006
Rogers, W.E.; Dykes, J.D.; Wang, D.; Carroll, S.N.; Watson, K. (2012) - Validation Test Report for WAVEWATCH III. 67p, DTIC Document, Slidell, LA, United States of America. Available on-line at http://oai.dtic.mil/oai/oai?verb=getRecord&metadataPrefix=html&identifier=ADA576706 [ Links ]
Shabbar, A.; Yu, B. (2009) - The 1998–2000 La Niña in the context of historically strong La Niña events. Journal of Geophysical Research, 114(D13115):1-14. DOI: 10.1029/2008JD011185
Short, A.D. (1999) - Handbook of Beach and Shoreface Morphodynamics. 379p., Wiley, Chichester, United Kingdom. ISBN: 0471965707 [ Links ]
Silva, G.A.; Ambrizzi, T.; Marengo, J.A. (2009) - Observational evidences on the modulation of the South American Low Level Jet east of the Andes according the ENSO variability. Annales geophysicae, 27:645-657. DOI: 10.5194/angeo-27-645-2009 [ Links ]
Smith, T.M.; Reynolds, R.W.; Peterson, T.C.; Lawrimore, J. (2008) - Improvements to NOAA’s Historical Merged Land–Ocean Surface Temperature Analysis (1880–2006). Journal of Climate, 21(10):2283–2296. DOI: 10.1175/2007JCLI2100.1
Souza, E. B.; Nobre, P. (1998) - Uma revisão sobre o Padrão de Dipolo no Oceano Atlântico tropical. Revista Brasileira de Meteorologia, 13(1):31–44. Available on-line at http://www.rbmet.org.br/port/revista/revista_dl.php?id_artigo=455&id_arquivo=715.
Souza, E.B.; Ambrizzi, T. (2002) - ENSO impacts on the South American rainfall during 1980s: Hadley and Walker circulation. Atmosfera (ISSN: 0187-6236) 15:105–120. Universidad Nacional Autónoma de México, D.F., México. Available on-line at http://www.ejournal.unam.mx/atm/Vol15-2/ATM15203.pdf
Souza, M.H.S.; Ribeiro, C.E.P. (1988) - Wave Climate off Rio de Janeiro. Coastal Engineering Proceedings, 1(21):261–269. DOI: 10.9753/icce.v21.
Spindler, D.M.; Chawla, A.; Tolman, H.L. (2011) - An initial look at the CFSR Reanalysis winds for wave modeling. MMAB Contribution No. 290: NCEP/NOAA, 23p. College Park, MD, U.S.A. Disponível em: http://polar.ncep.noaa.gov/mmab/papers/tn290/MMAB_290.pdf [ Links ]
Tolman, H.L. (2002) - User manual and system documentation of WAVEWATCH III version 2.22. MMAB Contribution No. 222, NCEP/NOAA, 133p. College Park, MD, U.S.A. Available on-line at http://polar.ncep.noaa.gov/mmab/papers/tn222/MMAB_222.pdf [ Links ]
Tolman, H.L. (2009) - User manual and system documentation of WAVEWATCH III version 3.14. MMAB Contribution No. 276, NCEP/NOAA, 194p. College Park, MD, U.S.A. Available on-line at http://polar.ncep.noaa.gov/mmab/papers/tn276/MMAB_276.pdf [ Links ]
Trenberth, K.E. (1997) - The Definition of El Niño. Bulletin of the American Meteorological Society, 78(12):2771–2777. DOI: 10.1175/1520-0477(1997)078<2771:TDOENO>2.0.CO;2
Trenberth, K.E.; Stepaniak, D. P. (2001) - Indices of El Niño evolution. Journal of Climate, 14(8):1697–1701. DOI: 10.1175/1520-0442(2001)014<1697:LIOENO>2.0.CO;2
Vale, E.M.J.P. (2012) - Analise de situações meteo-oceanográficas severas de bom tempo na Bacia de Campos. 80p, Master's thesis, Universidade Federal do Rio de Janeiro, Rio de Janeiro, RJ, Brazil. Available on-line at http://www.oceanica.ufrj.br/intranet/modules/PDdownloads/singlefile.php?cid=40&lid=759 [ Links ]
Willmott, C.J. (1981) - On the validation of models. Physical geography, 2(2):184–194. DOI: 10.1080/02723646.1981.10642213
Willmott, C.J. (1982) - Some comments on the evaluation of model performance. Bulletin of the American Meteorological Society, 63(11):1309–1313. DOI: 10.1175/1520-0477(1982)063<1309:SCOTEO>2.0.CO;2
Willmott, C.J.; Matsuura, K. (2005) - Advantages of the mean absolute error (MAE) over the root mean square error (RMSE) in assessing average model performance. Climate Research (ISSN: 1616-1572), 30(1):79-82, Inter-Research Science Center. Available on-line at http://climate.geog.udel.edu/~climate/publication_html/Pdf/WM_CR_05.pdf [ Links ]
Wolter, K.; Timlin, M.S. (1998) - Measuring the strength of ENSO events: how does 1997/98 rank? Weather, 53(9):315–324. DOI: 10.1002/j.1477-8696.1998.tb06408.x
Zang, Z.; Moore, J. (2011) - New significance test methods for Fourier analysis of geophysical time series. Nonlinear Processes in Geophyics, 18:643–652. DOI: 10.5194/npg-18-643-2011
*Submission: 21 DEC 2014; Peer review: 17 JAN 2015; Revised: 9 MAR 2015; Accepted: 28 MAR 2015; Available on-line: 30 MAR 2015
Note:
This article contains supporting information online at http://www.aprh.pt/rgci/pdf/rgci-570_Pereira_Supporting-Information.pdf
Appendix
Supporting Information associated with this article is available on-line at http://www.aprh.pt/rgci/pdf/rgci-570_Pereira_Supporting-Information.pdf

