


Serviços Personalizados
Journal
Artigo
 Inglês (pdf)
 Artigo em XML
 Referências do artigo
 Enviar este artigo por email
Indicadores
-
 Citado por SciELO
 -
 Acessos
Links relacionados
-
 Similares em
SciELO
Similares em
SciELO
Compartilhar

 Permalink
Observatorio (OBS*)
versão On-line ISSN 1646-5954
OBS* vol.13 no.2 Lisboa jun. 2019
The media of Consumption and the Consumption of time: How a consumer in fast-paced economy use traditional and new media tools
Abyshey Nhedzi*
*University of Johannesburg, South Africa
ABSTRACT
Research is ongoing about how the New Media impact on Traditional Media. Despite rapid change in the options for how we can interact with and consume media, some of our preferences for needs to consume have not shifted dramatically. This research aims to investigate the patterns of media consumption, and assesses the amount of time people allocate to different media. The study is informed by uses and gratifications theory (UGT), channel complementarity theory and time allocation theory. The article looks at the amount of time spent reading newspapers and magazines, watching television, listening to the radio, using the old or new media, and activities online and offline while at work or out of the work. It investigates whether traditional media are still relevant in this new media environment and identifies consumption practices. A survey was held among consumers who have various media experiences (N = 400) ━ and for the first time in Zimbabwe. Differences between consumers (media users) using traditional media channels and those using new media platforms are identified and discussed. However, some challenges exist, such as the limited number of Apple iPads and tablets. These findings implied that targeting the millennials remains a challenge as respondents are fragmented across various media platforms.
Keywords: media consumption, traditional media, social media, new media, Zimbabwe
Introduction
The surge in digital platforms in the 21st century has enabled new forms of media consumption that affects traditional media preferences (Bhatt, 2017 p. 9). Marketers, advertisers and media planners are interrelated in two senses. First, having an understanding of the need to create and retain consumers; they are aware that understanding consumption of media is critical to achieve the best possible target media oriented results. They know that they must have an update on consumption habits of readers, viewers and consumers in order to succeed in the increasingly hypercompetitive and complex global knowledge economy. To help brands plan their media more effectively, marketers now debate on how they can target with laser-like precision, audiences or consumers with a particular behaviour. When marketers are targeting or trying to get their brand in front of people, they need to ensure that they are meeting where their audience are. Media consumption patterns is becoming more significant. Second, they understand that debate around the dying of traditional media and the new media substitutionary role (Pacheco, da Silva, Brites, Henriques & Damásio, 2017 p. 2) is underexplored as it often leads to speculations. Unfortunately, in most of these studies the media consumers have been treated as generic, neglecting the time variable.
Media usage has received the most research consideration. Unfortunately, there is little academic research to guide us. Among media studies, an implicit assumption is that the impact of the pervasive nature of digitization throughout consumer lifestyles has contributed to the emergency of consumer behavior, but such development have not been examined clearly (Pacheco et al., 2017 p. 2). In practice, media planners should recognize how uses and appropriations of media penetrate all aspects of contemporary life. The present study addresses this gap in literature by investigating patterns of media consumption, and assesses the amount of time people allocate to different media. Most of the previous studies have treated one media at a time to the exclusion of others. Some studies assessed international media consumption, and to the knowledge of the author, Zimbabwe is excluded (Austin, Barnard & Hutcheon, 2016). Information that has been gathered about the Zimbabwean consumers and their media habits tends to be dated and questionable due to the limited literature covering the country. Therefore, the researcher aims to produce an account of consumer preferences and practices across the full set of available media tools in Zimbabwe.
The first section reviews media consumption within the changing landscape. The second section discusses a theoretical framework based on identifying three theories: uses and gratifications theory (UGT), channel complementarity theory and time allocation theory. The third section suggests the methodology for this research. Finally, in the fourth and last section, results, discussion and conclusion are covered.
Media consumption within the changing landscape
Media planners and marketers are compelled to predict and prescribe forms of marketing channels and media communication that would be cost effective with their existing and potential customer bases. In the era of new media, consumers have greater access to limitless media, thus organisations face the challenge of reaching them due to information overload and fierce competition (Marques & Batista, 2017). Advertisers, agencies, and media planners are all looking for improvement in placement of advertisements in media. If an advertiser can reach more of its customers and potential customers by spending less money, or an agency can help an advertiser to do the same, a positive effect on the advertiser's bottom line is yielded (Hess & Doe, 2013 p. 231).
A growing body of literature supports the reality of continuous advances in digital technology and portable devices, such as smartphones, smart watches and tablets; and suggests that this media shift will gain momentum (Clow & Baack, 2018; Odun & Utulu, 2016). These effects give rise to questions that still need to be answered through vigorous research with real-life data (Austin et al., 2016).
The marketing principles of reach (number of unique individuals or households exposed to an advertisement) and frequency (the minimum number of times each individual should be exposed to advertisement) are just as important as they have ever been in the changing environment. Although television remains the king of reach vehicles, marketers' television, development of new technology has always created risks and opportunities for businesses. Practitioner-led and academic-led marketing research argues that the advent of digitalisation and social media effects disruption (Napoli & Ewing, 2011). Given the consumers' changing preferences in the new technological environment past theories may prove unreliable (Marques & Batista, 2017). Therefore, examining existing theories, has the potential to help advertising practitioners. Previous literature mostly focuses on the adoption of such media tools (e.g., Blank & Lutz, 2017 p. 741; Haight, Quan-Haase & Corbett, 2014; Talafuse & Brizek, 2015), somewhat surprisingly, there is a scarcity of academic reports indicating comparison of different media tool. Although the research on consumers' media preferences or usage remains limited, consumers' media channels preferences are not static.
Content creation, distribution and monetization are often the three great challenges faced in the media industry (Clow & Baack, 2018). This eventually affects the position of traditional media market leaders. The media landscape process of change and innovation is viewed as favouring the new media. For this reason, this shift from traditional to digital media is much discussed but rarely quantified. Napoli and Ewing (2011) argue that heavy users of the internet spend less time watching television than casual users. However, previous studies show little confidence to this notion and suggest that the new media will simply complement traditional marketing media (Napoli & Ewing, 2011; Scolari, 2013 p. 1422).
The migration to new media
Advertising remains the lifeblood of the print and broadcast media. The advertising methods employed to promote company products or services usually include the use of TV, radio and print, which allow companies to explain what, when, where, and why people should buy their products or services. Companies or organizations that want to remain relevant need to think about how they will weave their brands into consumers' day-to-day lives (Clow & Baack, 2018). Traditional channels are the most affected as most print media have shut down, owing to a sharp drop-off in advertisers and readers (Jordaan et al., 2011 p. 2).
The emergence of new media brings intense competition to the market environment (previously dominated by traditional media) as new media win more users and more attention than the traditional media (Odun & Utulu, 2016). Odun and Utulu (2016, p. 66) disagreed with the assertion from Nossek, Adoni and Nimrod, that, in Africa, "the future of traditional media does not look bleak as some people would want us to believe because the media is still very effective." Regarding the debate on convergence, Nkiru (2011 p. 117) was adamant that traditional media forms in Africa would certainly exist alongside digital media. However, these authors admit: "the new media has more influence on broadcast sales development strategies in today's environment compared to the traditional media" (Odun & Utulu, 2016, p. 67).
The introduction and proliferation of internet and digital devices have gradually intensified societal change. Varga and NyIrő (2014 p. 5) agree that the emergence of the participatory media culture has led to a new media paradigm where multiplatform audiences are redefining the role of the media industry. Because social media have time-space compression they mark the advent of a faster and easier vehicle of expression for the sharing of ideas, thoughts and opinions (Clow & Baack, 2018). Social media as a term can be seen to refer to all the forms of user generated content including Facebook, Pinterest, Instagram, LinkedIn, and Twitter etc (Kaplan, 2015 p. 197). The borders between the real and virtual world are disappearing and, in some cases, seem not even to exist (Kaplan, 2015 p. 198). Virtual reality and augmented reality are commonly associated with Snap Inc., Facebook and Google. Social media no longer exist merely for the amusement of younger generations (Kaplan, 2015 p. 198): it now affects everyone, both organizations and customers.
Media consumption patterns in contemporary times had pointed out that newspaper industry had witnessed decline due to the dominant television medium and internet based communication resources and services (Bhatt, 2017 p. 4). However, various scholars have been reporting contradictory findings regarding the influence of new media on traditional consumption.
Theoretical framework
The study is informed by uses and gratifications theory (UGT), channel complementarity theory (Ruppel & Burke, 2015 p. 40) and time allocation theory (Becker, 1965 p. 516). The tradition of uses and gratification theory suggests that people consider spending time-consuming media based on their specific needs. UGT explains how and why audience members and stakeholders seek out specific information and media platforms that better satisfy their needs. According Ruppel and Burke (2015, p. 38) "researchers concerned with the impact of newer communication channels on the use of older channels generally propose two contradictory views of people's use of multiple channels━ that use of newer communication channels either displaces or complements use of older communication channels." The UGT theory has generated a major literature in its own right, and has been elaborated by some of the most influential theorists in their respective fields. Audiences' needs can affect their ideas on what they expect from a media platform and which traditional and new media meet their needs. That is, audiences have a clear idea of their motives and the gratifications expected from using a certain media. Media adoption for news use identified the information seeking or surveillance (e.g. general information) and the social utility gratification (e.g. to acquire information for conversation) as one of the most relevant factors in understanding news consumption (Van Cauwenberge, d'Haenens, & Beentjens, 2010 p. 341). Katz, Blumler, and Gurevitch (1974 p. 510) pioneered the Uses and Gratification Theory. In this theory six assumptions are raised:
• The audience is active and its media use is goal oriented.
• People have various uses (needs) they seek to satisfy through media.
• Audience members take initiative to link need gratification to a specific media.
• The media compete with other sources for need satisfaction.
• People have enough self-awareness of their own media use, interests, and motives to be able to provide researchers with an accurate picture of that use.
• Value judgments of media content can only be assessed by the audience.
A theory of the allocation of time, by Becker (1965 p. 494) provides "a basic theoretical analysis of choice that includes the cost of time on the same footing as the cost of market goods". Hence, time allocation theory holds that individuals allocate their discretionary time purposively, depending upon their time orientation: to the past, present, or future (Becker, 1965 p. 495). The optimization problem of time allocation is constrained by a large number of individual specific factors such as work schedules, sleep or family duties. A principal focus has been how individuals divide up their time between work and leisure. The same amount of utility is derived from an activity translating into a decrease in another activity. Becker (1965)'s propositions also stimulated the collection of data on time use in household production. Understanding of the mechanisms of consumer choice, interpretation of income and substitution effects is applicable to this study. A major concern is on how individuals divide up their time between work and leisure. The study agrees with Becker's assumption that individuals are assumed to act individually on deciding how to allocate their time. Although Becker's (1965) theory on income and leisure allocation of time are significant, it deals with many of these issues, which are beyond the scope of this investigation. The consciousness of consumer's every day is beset by an array of advertising messages which could result in clutter and information overload. I based on channel complementarity theory to examine the degree to which one type of media use is related to other types of media use. Complementarity refers to a situation where the use of one channel increases as a result of the increased use of another related channel. Given the assumptions made in the time allocation theory, there will be a unique allocation of media. A displacement hypothesis posits that people's total media use remains comparatively constant irrespective of the particular media tools they use. As a result, time spent using a new media will decrease time spent using an old media. Therefore, the author assumes that the time spent on one media is likely to affect time spent on another media.
H1: The information surveillance gratification will be the strongest predictor of time spent with traditional media and new media.
H2: An increase in diversion needs (entertainment, escape, pastime) will result in an increase in time spent with print books and digital or online books.
Because of their limited resources, individuals have to choose between media that serve similar needs (Dimmick, Feaster & Hoplamazian, 2010 p. 24). Additionally, most frequent users of the Web find it at least comparable and perhaps even superior to traditional news media (at the contrary to Van Cauwenberge et al., 2010 p. 347). In light of the above, I expect the following relations between the news use of traditional and online media:
H3: Time spent on online news will be negatively related to time spent on print newspapers.
H4: Time spent on online news will be negatively related to time spent on television news
Method
Data Collection and Sample
Building upon and expanding earlier work, the researcher applied a deductive, and exploratory approach to the study of consumers' experiences on traditional and new media platforms. I adopted a survey design incorporating the quantitative approach. The data were collected by conducting self-administered questionnaires with media consumers in the capital city of Zimbabwe, Harare in order to understand the existing time consumption of media in the country. Zimbabwe is a Southern African nation. In total, 400 questionnaires were distributed, collected, and statistically analysed by university of Johannesburg Stratcon expert. I partly derived the data collection instrument from prior research and adapted for the purpose of this study. It aimed to test both the questionnaire and the logistics. The researcher adapted Pacheco, da Silva, Brites, Henriques & Damásio (2017, p. 2) on "variables such as time spent on different media and devices, media usage … aimed to understand which medium was chosen to perform a specific activity and the options these individuals in particular took, namely in terms of their free time, deciding on which activities to conduct, or establishing a sense of the purpose of those same activities (social interaction, news consumption, leisure, or work)."
I conducted a pilot study in June 2017 with 20 respondents. Data were collected during October and November 2017 with local residents using an intercept approach. I used a convenience sampling method to select the subjects for the research. Data collection points included education, religious institutions, towns (which consists of multiple businesses and residential areas), and the city public spaces. Every third person that crossed a predetermined line in those locations was asked if they were willing to complete a self-administered questionnaire for approximately 10 minutes.
I approached consumers and introduced myself, explained the purpose of the research, guaranteed confidentiality, and obtain agreements to participate in the study. Hence, the study was voluntary and verbal consent was obtained from all the respondents.
Measures
Unfortunately, the literature does not provide the state of media usage from emerging countries. Media consumptions theories serve as a guiding curtain during the quantitative questions and some of them have close parallels in some of the questions that were asked in the survey: for instance, the author asked which news media respondents had used during the past week (similar to Damásio, Henriques, da Silva, Pacheco & Brites, 2015 p. 387). The questionnaire was developed based mostly on existing studies of media consumption (Damásio, Henriques, da Silva, Pacheco & Brites, 2015 p. 409; Nhedzi, 2018 p. 8-9). Because an understanding of traditional media and new media consumption is as yet relatively underdeveloped, the wording of the questions were adjusted, the study will not count as an exact replication of Schrøder (2015 p. 60). The wordings used in the questionnaire, seeing these adjustments not as obstacles to replication, but as ways to ensure the "sameness" of the questions as advanced by the study objective and type of respondents.
The new media variables adopted for this study are based on Kaplan and Haenlein (2010 p. 60). According to Kaplan and Haenlein (2010, p. 61), technological foundations of Web 2.0, and allow the creation and exchange of user-generated content", many variations and types of social media exist. Facebook (a social network), Snapchat (an instant photo messaging application), Instagram (a photo-sharing application), Twitter (a microblogging application), LinkedIn (a business- and employment-oriented social networking service), Google+ (an interest-based social network), and Pinterest (a "catalog of ideas" or photo-sharing website) represent different types of social media, each with unique architectures, cultures, and norms (Van Dijck, 2013).
Data analysis
The data collected in the survey answered a battery of questions related to media usage in daily lives (for example, time, place and media preferences), which made possible the exploration and testing of the hypothesis, related to respondents' media uses, which are the focus in this paper. The data were captured and analysed by means of the IBM Statistical Package for Social Sciences (SPSS) software version 24. Only variables that met the study objectives were included in the analysis.
Results
The data analysis results appear below, starting with respondent demographics and descriptive statistics of the variables. The sampling adequacy analysis of the measures follow. In turn, correlation and moderation statistics are subsequently presented.
Participants
Respondents were asked to report on selected demographic questions/items, including their age, gender, marital status, academic level, race, employment status, and income per month. The study's response rate was 96%, and the completion rate was 96% (n=400 out of n=415). Recruited for this study of 400 people, 62 percent (n=246) of the sample were male participants, and 38 percent (n=154) were female participants. Majority of respondents (84%) were Millennials (born between 1980 and 2000) = 16 ━ 36 years old than (13%), Generation X (born between the years of 1965 and 1979) = 37-51 years old. Few were older than 51 years (1%) and 15 years and less (3%). The sample was skewed in terms of gender and age representation, with the majority of respondents being young. These demographics reflect a lifestyle of a young population being more likely a one of the most relevant phenomena in African or emerging societies and majority were single (56%), almost half of the participants were married (45%) and Co-habiting (1%). As regards qualifications, a third (36%) indicated that they have Ordinary Level or Advanced level (std. 10) of qualification, 34% have Diploma or Certificate, 21% have Undergraduate, 7% have postgraduate degree, and few (2%) have Grade 7 or lower (std. 9 or lower). The sample consisted mostly of Africans (98%), Coloured, White and Indian (2%) were few, which is in line with the demographics of the country. It further consisted mostly of individuals in the peak productive and reproductive years. The work situation of the respondents, 41% were employed, 27% were Self-employed, 18% were Unemployed, 11% students, and the remainder were retired (3%). Of the 400 respondents, a third were in receipt of a bracket of up to US$352 (35%) monthly income before tax deductions, $353-$703 (27%), $704+ (9%) and closely followed by $2 111+ (1%). Slightly less than a third (29%) of the respondents preferred not to disclose.
The media usage group (n = 400) was initially divided into two groups: traditional media and new media. Respondents' time use on each of the eighteen dimensions was calculated from survey questions covering media time use on the following media: newspapers (print, online), books (print, digital), audio and video, streaming (television, radio), Apple music, television on TV set, and radio on radio set etc. For the sake of this study the traditional media refers to questions derived from reading newspapers in print, reading books in print, watching Television from a TV set, watching news from a TV set, listening to a Radio from a Radio set, and listening to a Radio from a car Radio, while new media refers to questions on reading newspapers online or digital, obtaining news online from other sources, reading digital books, watching TV from computer, watching TV from a mobile phone, listening to a Radio from a computer Radio, listening to a Radio from a mobile phone, listening to an Apple music, listening to an audio on an iPad/Tablet, watching a video on an iPad/Tablet, listening to a streaming audio, and watching a streaming video.
Sampling adequacy analysis
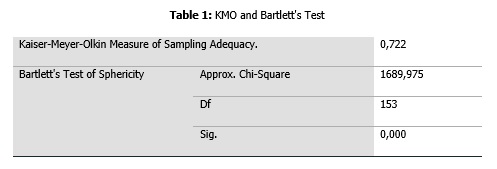
The Kaiser-Meyer Olkin (KMO) and Bartlett's Test measure of sampling adequacy was used to examine the appropriateness of Factor Analysis in SPSS. According to Pallant (2013), the sampling is adequate or sufficient if the value of Kaiser Meyer Olkin (KMO) is >.6. Kaiser Meyer Olkin measure of sampling Adequacy and Bartlett's Test of Sphericity on eighteen questions relating to time spent on different media platforms was conducted. As shown in Table 1, the Kaiser- Meyer- Olkin Measure (KMO) of Sampling Adequacy Value was .722 indicating that the sample was adequate to consider the data as normally distributed. Taking a 95% level of Significance, α = .05. The p-value (Sig.) of .000 < .05, therefore the Factor Analysis is valid. This implies that the relationship between variables for traditional and new media was significant.
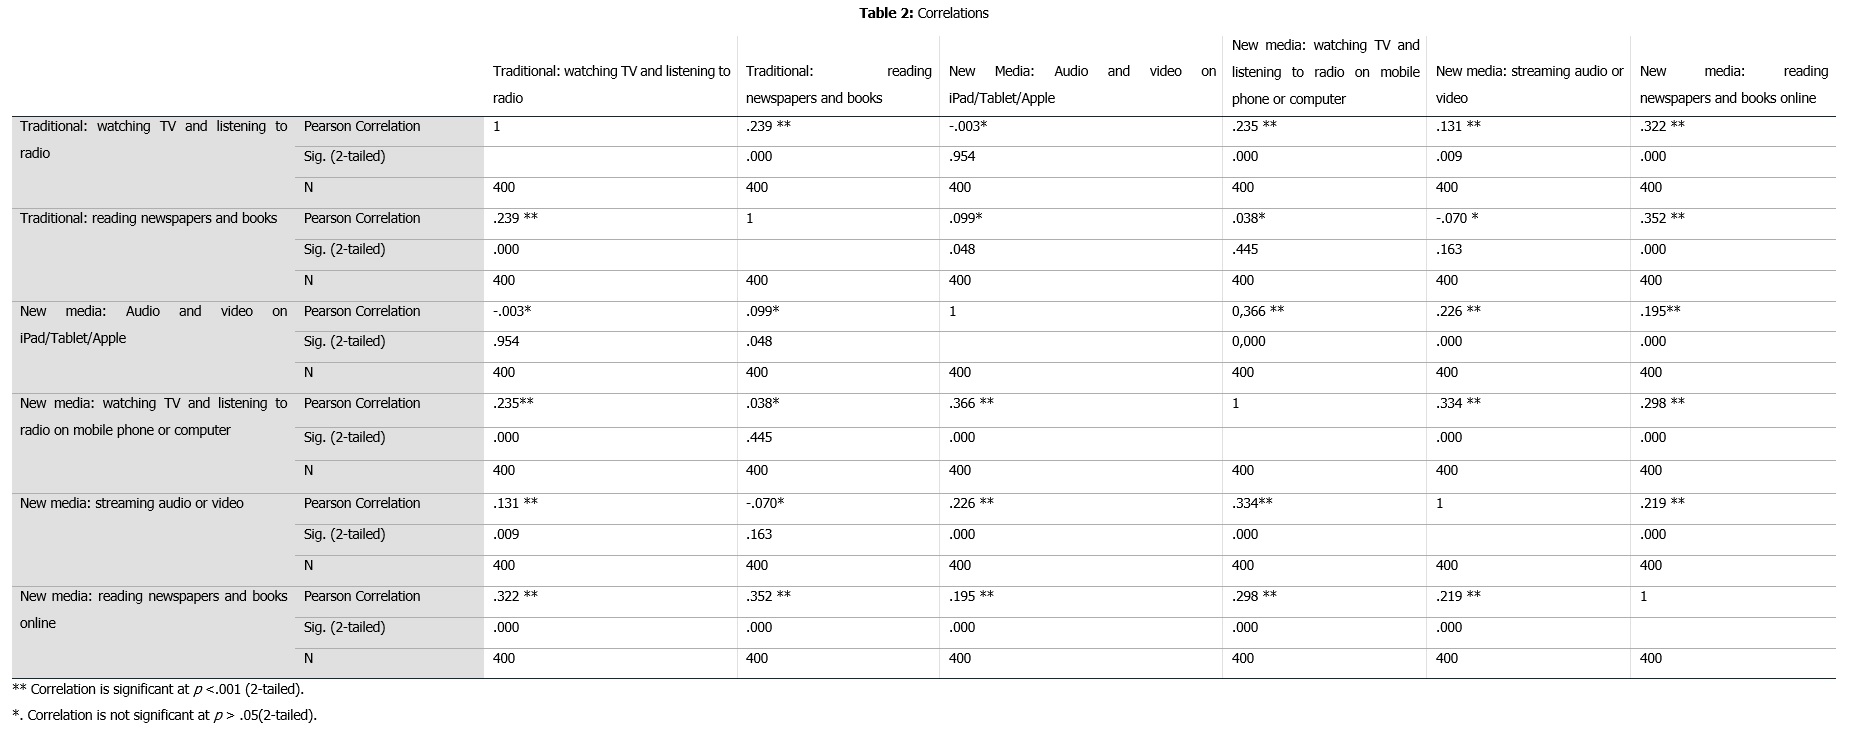
Correlations were computed among six traditional and new media scales on data for 400 respondents.
In Table 2, the results suggest that 11 out of 15 correlations were statistically significant and were greater or equal to r(400) = .26, p < .05, two-tailed. The correlations of media consumption rating of traditional: watching TV and listening to radio with new media: Audio and video on iPad/Tablet/Apple measures were not significant, r(400) = -.0, p < .01. The correlations of media consumption rating of traditional: reading newspapers and books with new media: audio and video on iPad/Tablet/Apple measures were not significant, r(400) = .10, p < .01. The correlations of media consumption rating of traditional: reading newspapers and books with new media: watching TV and listening to radio on mobile phone or computer measures were not significant, r(400) = .04, p < .01. The correlations of media consumption rating of traditional: reading newspapers and books with New media: streaming audio or video measures were not significant, r(400) = -.07, p < .01. In general, the results suggest that respondents who are using traditional media tend to rate themselves as less users of new media.
Time spent on different media platforms
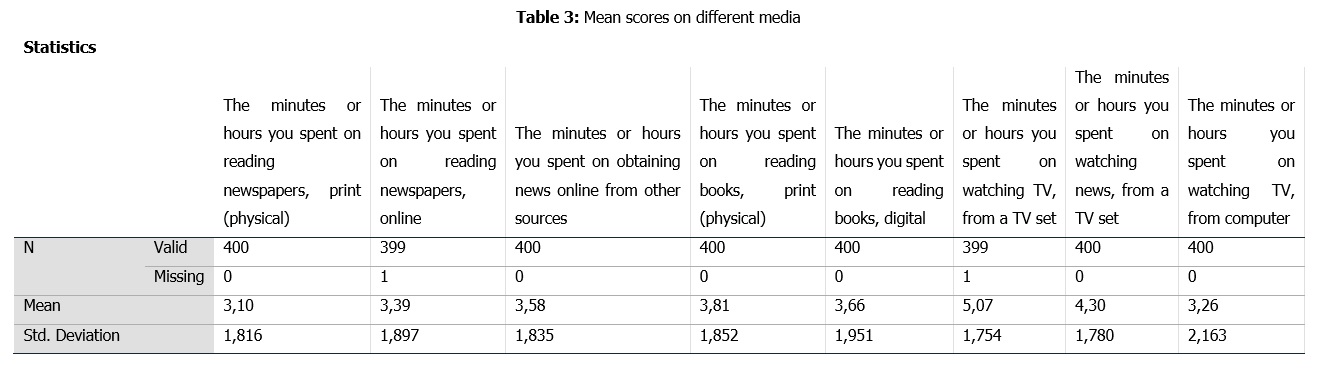
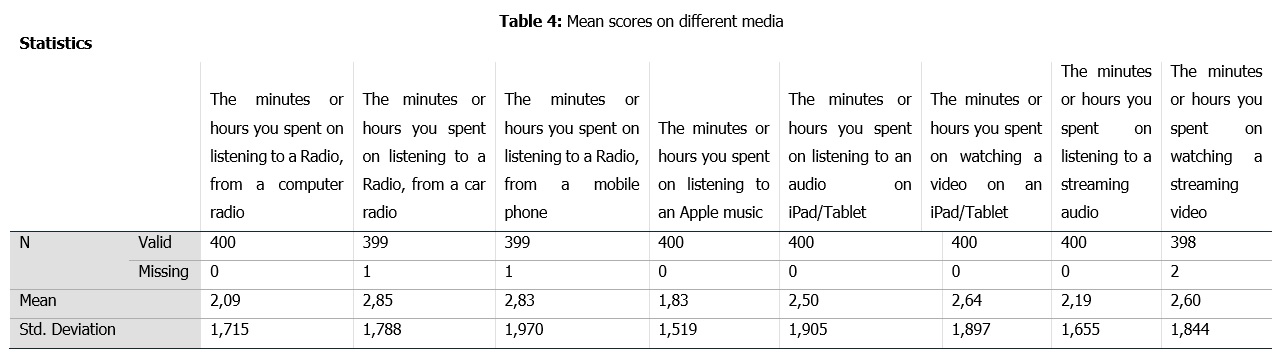
Table 3 and 4 reveal that traditional media was leading. The highest number of respondents indicated that they watch TV, from a TV set (n=121; 30.3%; Mean=5.07; SD= 1.754) for more than 4 hours followed by those who indicate watching news, from a TV set (n=107; 26.8%; Mean=4.30, SD=1.780) for 1 to 2 hours 59 minutes. The least number of respondents indicate that they spend time listening to an Apple Music (n=29; 7.3%; Mean=1.83; SD=1.519).
H1: The information surveillance gratification will be the strongest predictor of time spent with traditional and new media.
Comparing television on traditional TV set versus computer and mobile phone as new media. The traditional TV set group has the largest group (95%; M=5.07; SD=1.754) reporting time use, followed by TV on computer (62%; M=3.26; SD=2.163) with TV on mobile phone group reporting the smallest percentage (56%; M=2.68; SD=1.949) in this group. This shows that traditional television set is indeed "king".
Comparing radio on traditional and new media on radio set, car radio versus computer radio and mobile phone radio. Respondents listened more to traditional radio. Traditional radio has the largest group with radio set (82%; M=3.54; SD=1.984) and car radio (70%; M=2.85; SD=1.788) than new media with mobile phone radio (61%; M=2.83; SD=1.970) and smallest percentages on computer radio (38%; M=2.09; SD=1.715).
H2: An increase in diversion needs (entertainment, escape, pastime) will result in an increase in time spent with print books and digital or online books.
Comparing reading of books on traditional and digital forms. Print media have the largest percentage of 85% (M=3.81; SD=1.852) readers than digital books (79%; M=3.66; SD=1.951).
Comparing listenership of audio, nearly half (47%; M=2.50; SD=1.905) of the respondents use iPad or Tablets compared to Apple (29%; M=1.83; SD=1.519).
H3: Time spent on online news will be negatively related to time spent on print newspapers.
Comparing newspapers readership references between traditional print newspapers and digital or online newspapers. Differences in newspapers' preferences were minimal with slight high percentage on print (80%; M=3.10; SD=1.816) than online newspapers readers (79%; M=3.39; SD=1.897).
H4: Time spent on online news will be negatively related to time spent on television news.
Differences in news preferences use of traditional news TV set (93%; M=5.07; SD=1.754) and online news (87%; M=3.58; SD=1.835) were minimal. Perhaps this could be a result of rapid prevalence of fake news that is associated with none convectional broadcasts.
New media intensity
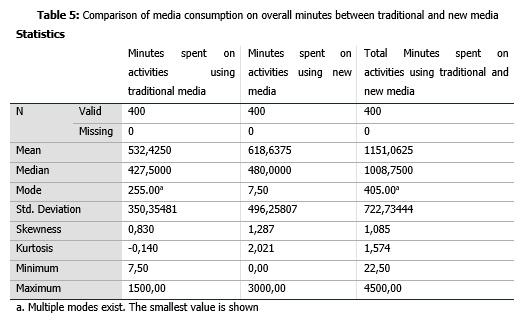
In Table 5, the evidence overwhelmingly points to higher use of new media (Mean=618.6375) than traditional media (Mean=532.4250). This suggests that most of the respondents were relying on new media platforms.
Results on Internet-based media consumption on computer, mobile phone and iPad or Tablet
Figure 1 summarises the relative experience of the respondents use of Internet-based media consumption on computer. The question on the time spent by respondents on activities on computer was a multiple-response question (total percentage will exceed 100%). A large proportion of the respondents had indicated using WhatsApp (76%), Facebook (75%), YouTube (66%), Google+ (65%), while a few respondents had used flickr (4%) and Tumblr (2%).
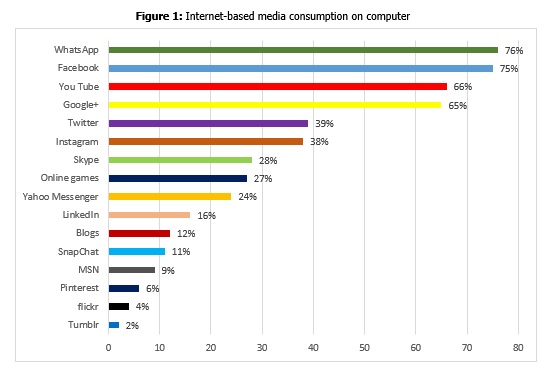
Figure 2 depicts the relative experience of the respondents' activities on mobile phone (total percentage will exceed 100%). Similar to the results on computer based activities, the mobile phone had an overwhelming majority of respondents who indicate the use of WhatsApp (92%), followed by Facebook (77%), Google+ (55%), and YouTube (55%). The same pattern is seen in later Figures (2 and 3). Africans rely heavily on mobile phones.
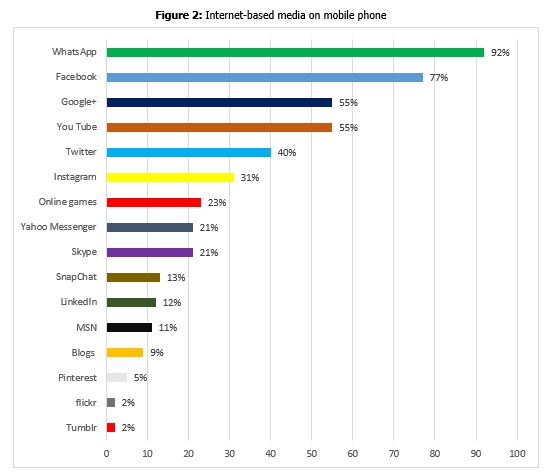
Figure 3 shows the relative experience of the respondents' consumption on IPad/Tablet (total percentage will exceed 100%). When compared with the previous figures (1 and 2), results indicate that WhatsApp (75%) dominate the list on the use of IPad/Tablet followed by Facebook (70%), Google+ (57%), and YouTube (50%).
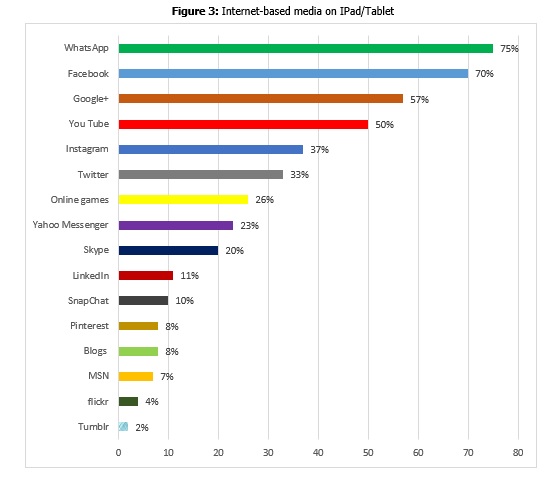
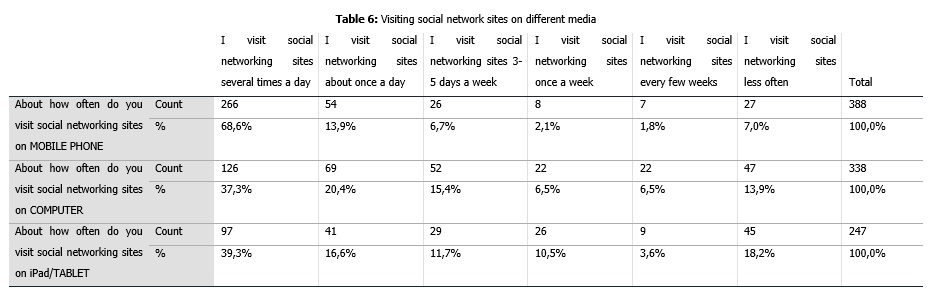
Table 6 shows the number of times respondents were visiting social media on different media platforms. Results illustrate that a large percentage of respondents (69%) visit social media networking site several times a day using their mobile phone, while only 39% of respondents would visit social media networking site several times a day using their iPad/Tablet compared to 37% of those who also visit social media networking site several times a day using their computer. Thus, there appears to be a high reliance on mobile devices than computers for respondents.
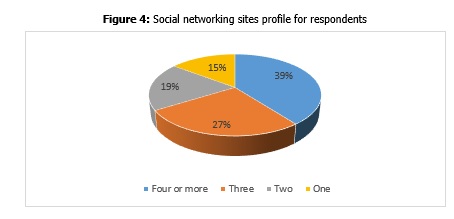
Figure 4 presents the number of profiles that were currently used by respondents. Regarding the number of social networking sites profile, nearly half (39%) of the respondents had four or more profiles, followed by those with three profiles (27%), those with two profiles (19%), and others with one profile (15%).
Print newspapers and magazine readership
The question on the time spent by respondents on reading various types of print media and in what location was a multiple-response question (total percentage will exceed 100%). Statistics in Figure 5 indicate that the periodicals or magazines (58%) and local daily newspapers (57%) exhibit the biggest readership and few readers are on international daily newspapers (20%), free newspapers (19%), international weekly newspapers (12%) and other (2%).
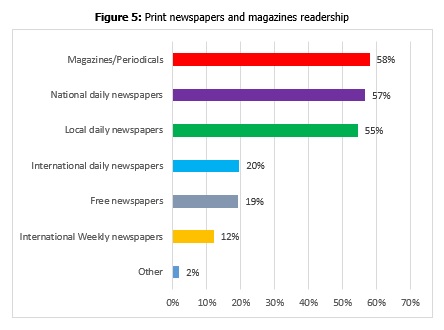
Figure 6 provides at-home and out-of-home locations use of the print newspapers by respondents. For those who indicated the location of reading print newspapers, more than half (56%) of respondents read newspapers in the living room at home followed by those who read at work (36%), in public place (22%), at school (16%), in transit to work (9%) and in transit to school (5%).
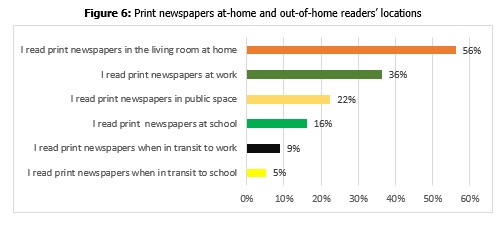
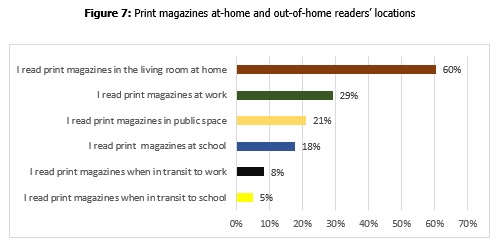
Figure 7 shows the results on respondents' location of use for print magazines. Analysis reveal that in comparison to print newspapers, more than half (60%) of the respondents read magazines in the living room at home followed by those who read at work (29%), in public place (21%), at school (18%), in transit to work (8%) and in transit to school (5%).
Free time activities
Figure 8 presents the experiences of respondents on activities of free time (total percentage will exceed 100%). Watching television is considered the most important activity used by respondents on free time followed by listening to music (64%).
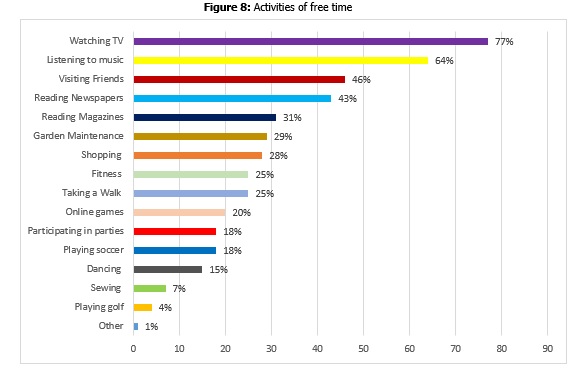
Most activities accounted for less than 50%, the respondents indicated free time was spent doing activities such as visiting friends (46%), reading newspapers (43%), reading magazines (31%), garden maintenance (29%), shopping (28%), fitness (25%), taking a walk (25%), online games (20%), participating in parties (18%), playing soccer (18%), dancing (15%), sewing (7%), playing golf (4%) and other (1%).
Comparison of usage by demographic variables of respondents
Firstly, time spent on each activity was converted from a categorical response to the median value of the range of time for each category to minutes. The time ranges used in the questionnaire were converted to median minutes. For example, category 1=No time i.e. 0 minutes and the category 2 which is 1-15 minutes is coded as 7.5 minutes. This conversion was actioned to get an actual time spent on each media (rather than a category of time). The time spent on new media and traditional was then summed to get a total time spent on new media and traditional media platforms (as reported by all users for all media combined). Then, based on the frequency tables of time spent on new media and traditional media platforms, the frequency distribution is split into three ranges i.e. low (lowest third of time spent), medium (middle third of time spent) and high (highest third of time spent). This grouping was used to divide the sample, based on how much time they spent on new media or traditional activities, into three equal-sized groups.
By categorizing time spent responses on the analysis of different media, we can see if there are differences between how the respondents were distributed, and identify the amount of time that were most used by participants in a three equal-sized groups. By this grouping, we gain a more comprehensive analysis that were obtained from looking at the range of time of the media tools based on demographic attributes.
The following analysis of patterns identifies and summarizes the distinctive characteristics of the groups. For easy comparability, the three groups were treated as percentage shares of users in each time consumption. Time spent on traditional was recoded as low (315=1), medium (316-607.5=2), high (608+=3) and none at all (else=0), while time spent on new media was recoded as low (315=1), medium (316-712.5=2) high (713+=3) and none at all (else=0).
The researcher believes that the demographic characteristics of population and media tools were one of the reasons why media consumption was an integral part of the daily life experience. Numerous studies (Blank & Lutz, 2017 p. 741; Haight, Quan-Haase & Corbett, 2014; Lutz, 2016 p. 8) indicate that demographic and socio-economic characteristics of people influence their preferences toward media. In studies related to consumption of media, sociodemographic characteristics were recognized as significant variables in explaining variations in media consumption in various contexts (Hargittai, 2015; Näsi & Räsänen, 2013 p. 79; Van Cauwenberge et al., 2010 p. 335).
Comparison of usage by demographic variables of respondents use of traditional media
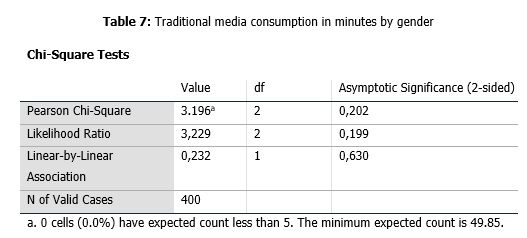
To see if there is significant evidence of a relationship (readership or viewership or listenership) on demographics variables between traditional media and new media, a Chi-square test was carried out. A Pearson's Chi-Square test was carried out to assess whether male and female scores were related. Table 7 shows that there was no statistically significant association between male and female use of traditional media, (X2 (2) = 3.196, p > .05). Analysis of results shows that 38% of female were spending more time on traditional media (high=608+) compared to 32% of male, followed by 27% of female compared to 36% of male (medium=316-607.5) and 35% of female compared to 32% of male (low=315). The research hypothesis that differences in "male" are not related to differences in "female" is not supported by this analysis.
Age was coded and grouped into two groups of young (up to 36 years old) and older people (37 years or older). Table 8 shows that there was statistically significant association between age groups of up to 36 years old and 37 years or older use of traditional media, (X2 (2) = 9.011, p < .05). Results shows that 47% of 37 years or older highly (608+ minutes) consume traditional media compared to 32% of up to 36 years old, followed by 36% medium consumers (316-607.5 minutes) among 37 years or older compared to 32% of the up to 36 years old, 32% of up to 36 years old who were medium consumers. Also, low (315 minutes) consumption (36%) were on those up to 36 years old and 18% of 37 years or older. These results shows that young people are likely to spend less time on traditional media than older people. The research hypothesis that differences in age for "up to 36 years old" are related to differences in "37 years or older" is supported by this analysis.
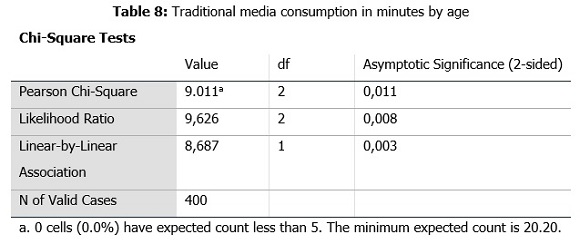
Table 9 depicts that there is no statistically significant association between marital status groups of single and married or cohabitating use of traditional media, (X2 (2) = 3.242, p > .05). The single and married or cohabitating comparisons are almost identical. Analysis indicate that 37% of single respondents spent less (low consumers: 315 minutes) on traditional media compared to 28% by those married or cohabitating. Married or cohabitating respondents were slightly high (608+ minutes) (36%) and 316-607.5 minutes (medium) (35%) spent using traditional media than single respondents (33%; 30%). The research hypothesis that differences in marital status for "single" are related to differences in "married or cohabitating" is not supported by this analysis.
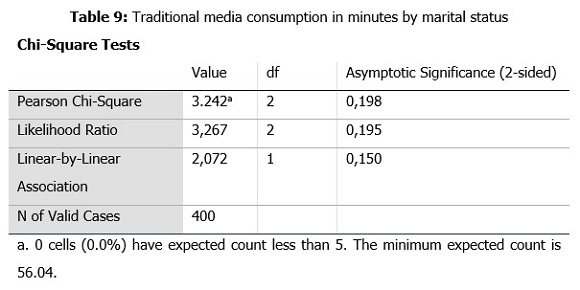
Table 10 shows that there is statistically significant association between education qualification groups of Up to Standard 10, diploma/certificate, undergraduate, and postgraduate use of traditional media, (X2 (2) = 12.328, p < .05). An analysis of media use indicates significant differences between postgraduate (46%), undergraduate (38), Standard 10 or less (33%) and diploma or certificates (30%), for 608+ minutes (high) of use on traditional media. The Standard 10 or less (41%) were main consumers with 316-607.5 minutes (medium) compared to those with diploma or certificate (29%), undergraduate (27%) and postgraduate (25%). Those with diploma or certificate (41%) spend 315 minutes (low) followed by those with undergraduate (35%), postgraduate (29%) and Standard 10 or less (26%). The research hypothesis that differences in education qualification for the "Standard 10, diploma/certificate, undergraduate, and postgraduate" are related is supported significantly by this analysis.
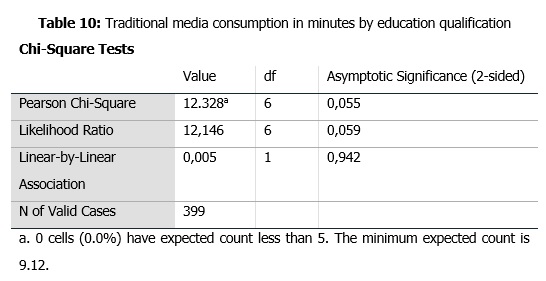
Table 11 highlights time spent on traditional media by employment status comparison between groups employed, self-employed, unemployed (including seeking), and none economically active (retired, student). Analysis shows that the chi-square test produced no statistical significance (X2 (2) = 11.465, p > .05). A slightly half of the non-economically active (retired and student) (48%) spend 315 minutes (low users) of traditional media compared to employed (33%), self-employed (32%), and unemployed (including job seekers) (26%). The unemployed (43%) were medium (316-607.5 minutes) users of traditional media followed by self-employed (35%), employed (31%) and none economically active (retired, student) (17%). Also, 36% of those employed respondents spent 608+ minutes (high) on traditional media compared to none economically active (retired, student) (35%), self-employed (34%) and unemployed (including seeking) (31%). However, there is no statistical significance, the percentage of time spent on traditional media varies from employment status.
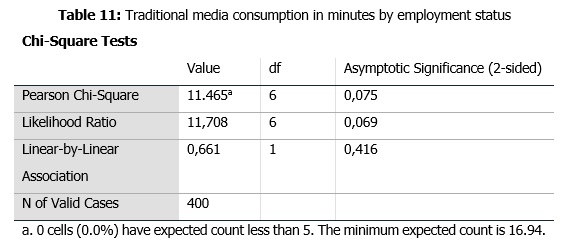
Table 12 shows that there is statistically significant association between income (USA Dollar) groups of $352 or less, $353-703, $704-more and not prepared to disclose use of traditional media, (X2 (2) = 9.011, p < .05).
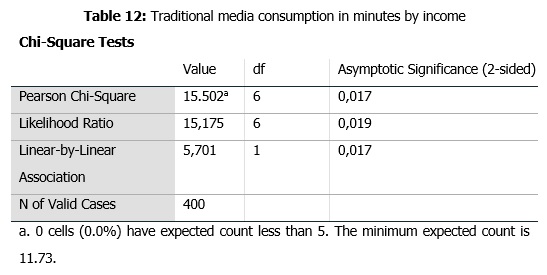
An analysis of media usage by income indicates significant differences between the ones who earn $352 or less (46%) compared to $704 or more (28%), none disclosure (28%) and $353-703 (27%), for 608+ minutes (high) use of traditional media. The respondents (42%) who earn $704 or more indicate 316-607.5 minutes (medium) using traditional media compared to those who did not disclose (35%), $353-703 (32%) and $352 or less (28%). Respondents (41%) who earn $353-703 (low) spend 305 minutes compared to those who did not disclose (36%), $704 or more (31%) and $352 or less (26%). Hence, there is statistically significance between various income earners among traditional media users.
Comparison of usage by demographic variables of respondents use of new media
As shown in table 13, a chi-square test indicates that there is no relationship on gender between male and female on time spent on new media (X2 (2) = 5.498, p > .05). Female (42%) spend 713+ minutes (high) of consuming new media than male (31%). Male respondents (36%; 33%) spend 315 minutes (low) and 316-712.5 minutes (medium) a less time on new media compared to female (29%; 29%). This imply that the differences in use of new media is not statistically significant.
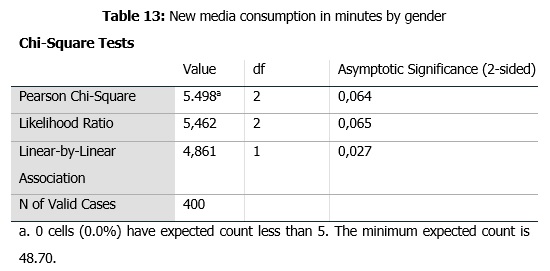
Table 14, A chi-square test results indicate that there is statistical significance on relationship on age groups between up to 36 years old and 37 years or older of time spent on new media (X2 (2) = 9.548, p < .05).
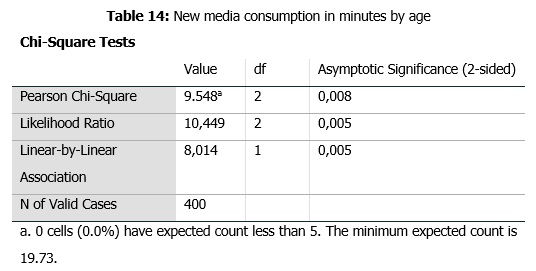
Young respondents (38%; 36 years old or less) had more use of time on new media than older (18%) respondents for 713+ minutes (high) level. On 315 minutes (low) and 316-712.5 minutes (medium), more respondents (44%; 39%) on 37 years or older were consumers of new media than (31%; 31%) 36 years old or less.
Table 15 presents that there is statistically significant association between marital status groups of single and married or cohabitating use of new media, (X2 (2) = 16.675, p < .05).
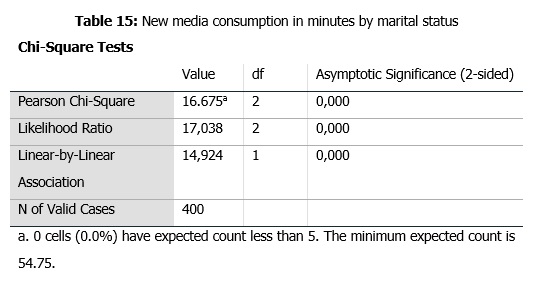
The significant chi-square statistics imply that differences in scores is based on marital status. Nearly half of respondents were single (43%) who had 713+ minutes (high) on new media compared to those who were married or cohabitating (24%). On 315 minutes (low) and 316-712.5 minutes (medium), the married or cohabitating (41%; 36%) respondents led in these categories than single respondents (28%; 29%).
Table 16 shows that there is statistically significant association between education qualification groups of Up to Standard 10, diploma/certificate, undergraduate, and postgraduate use of traditional media, (X2 (6) = 15.726, p < .05).
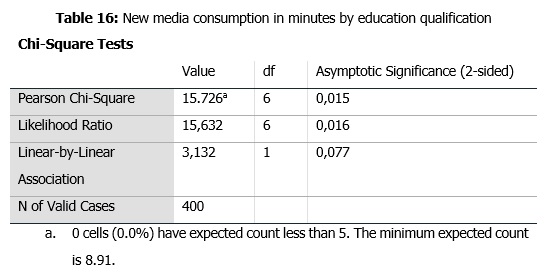
An analysis of media usage indicates significant differences between half of the respondents undergraduate (50%), compared to postgraduate (39%), Standard 10 or less (34%) and diploma or certificate (26%), for the 713+ minutes (high) on new media. Diploma or certificate (42%) were using new media for less time (315 minutes) followed by those with Standard 10 or less (33%), postgraduate (29%) and undergraduate (31%). On 316-712 minutes (medium) category, Standard 10 or less (33%) respondents were more than those who were had diploma or certificate (32%), postgraduate (32%), and undergraduate (28%).
Table 17 highlights, time spent on traditional media by employment status comparison between groups employed, self-employed, unemployed (including seeking) and none economically active (retired, student).
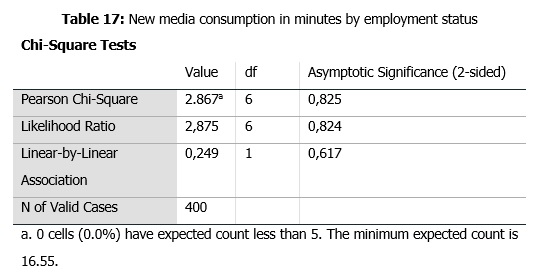
Analysis shows that the chi-square test produced no statistical significance (X2 (6) = 2.867, p > .05). A slightly less than half of the unemployed (including job seekers) (40%), non-economically active (retired and student) (36%) were high users (713+ minutes) of new media compared to self-employed (33%), and employed (33%). Self-employed (36%) were using new media for less time (315 minutes) followed by those unemployed (34%), employed (32%) and none economically active (retired or student) (31%). On 316-712 minutes (medium category), employed (35%) respondents were more than those who were none economically active (33%), self-employed (31%), and unemployed (26%).
Table 18 shows that there was no statistically significant association between income (USA Dollar) groups of $352 or less, $353-703, $704 or more and not prepared to disclose use of new media, (X2 (6) = 11.350, p > .05).
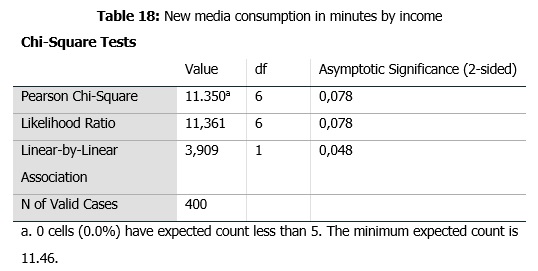
An analysis of media usage by income indicates no significant differences between the ones who earn $352 or less (45%) compared to $704 or more (39%), none disclosure (30%) and $353-703 (26%), for 713+ minutes (high) use of new media. The respondents (37%) who earn $353-703 indicate 316-712.5 minutes (medium) use of new media compared to those who did not disclose (33%), $704 or more (28%) and $352 or less (28%). On the 315 minutes' category (low), respondents who earn $353-703 (37%) and those who did not disclose (37%), were more compared to those with $704 or more (33%) and $352 or less (27%). Hence, there is no statistically significance difference between various income earners among new media users.
Discussion
The aim of the study was to provide information on the consumption of different individuals on the diverse forms of media. This article is research on consumers' uses of new and old media. Also, the primary question addressed in this study is whether traditional or new media consumption, is different from individuals' demographics in respect to a variety of variables. Clearly, the results of this study confirm the complementary use of traditional and new media in terms of gender, educational qualification and employment status. There was no disparity between gender and traditional media use though there were slightly more female than male. In respect to the variables examined, the female are high readers of both traditional newspapers and magazines. Hence female were more consumers on both traditional and new media. The 37 years or older highly use traditional media compared to those of up to 36 years old. In contrast, young people (36 years old or less young) have more time use on new media than older people with 37 years or older for highest category (713+ minutes). This finding is consistent with previous research on the media use, suggesting that the young prefer new media over older people (Pacheco et al. 2017 p. 9; Napoli & Ewing, 2011). These significant differences are not evident with all the media considered. Married or cohabitating respondents were slightly high users of traditional media. There was statistically significant on single people who were heavy users of new media compared to these who were married or cohabitating. This results shows that the single people were highest users of new media. More postgraduates highly use traditional media than undergraduates, Standard 10 or less and diploma or certificates. Similarly, there were more undergraduates, compared to postgraduates, Standard 10 or less and those with diploma or certificates, for high use of new media. The statistical significance on qualification levels could perhaps relate to literacy differences. Employed respondents slightly led on traditional media compared to none economically active (retired, student), self-employed and unemployed (including seeking). However, the unemployed (including job seekers) followed by non-economically active (retired and student) were highest users but with small effect for new media. The results of an analysis of media usage by income indicates significant differences between the ones who earn less compared to highest earners, none disclosure and $353-703, for heavy users of traditional media. In the similar way, the income of $352 or less were most number of people compared to $704 or more (39%), none disclosure (30%) and $353-703 (26%), for 713+ minutes (high) use of new media. Hence, the higher the income the heavy usage of internet.
The results show that WhatsApp is considered the most important App. WhatsApp take the first place among respondents. Facebook is the social media with the highest reach in the online population. However, among the young people other social media challenge Facebook's leading position are YouTube and Google+. The use of social media is the most significant free time activity which is consistent with previous studies (Bhatt, 2017 p. 8; Pacheco et al, 2017 p. 6). The overall results show the higher use of new media over traditional media. Results indicate more use of online newspapers that print newspapers. This is similar to previous studies (Scolari, 2013 p. 1428) that indicate the decrease in American and European readership, especially among younger generations, and the shift from print news consumption to online news consumption considered the main causes of this decline. Concordantly, this high regard for new media is perhaps the result of how the country's economy relies heavily on entrepreneurship due to high unemployment rates that have prevailed over the past decade. The results indicate that individual media use is highly differentiated both in the total number of media used and in the time spent on different media. The findings are consistent to other previous studies (Helles, Ormen, Radil & Jensen, 2015 p. 316). Traditional media represented by watching traditional TV set and listening to radio on traditional radio set were highest compared to mobile phone, computer, Ipad, and other new media. Unlike Nysveen, Thorbjørnsen and Pedersen (2005 p. 135) who found that "the positive effect of WebTV channel addition on main channel use supports the complementarity perspective and not the competitive perspective", online TV usage was limited. Given these results, television and radio, would be a better alternative for reaching the most media consumers in the country. The same conclusion would hold with WhatsApp and Facebook.
Limitations and future studies
Limitations in this study can be addressed with future research. The purpose of the study was also not to generalise the findings, but only to provide a snapshot of the types of consumer experience evident at the time of the study which could be of use to the media planners and marketers. Since specific media were not named in the study, they could have experienced the media broadcast, print or internet differently from what is proposed in the findings. However, it should also be acknowledged that the analysis was strictly guided by the findings of media research in Zimbabwe, which could have value for the future media scholars and marketers. It is recommended that future studies should evaluate the use of different media; proposed types of media consumption study on experience research should also be tested in other African countries. Also the fact that it was quantitative study it has its limitations because a qualitative approach such as an in-depth interview gives the respondent more latitude to respond to some questions with more personal information which could shed more light on their experiences and perceptions. It would be interesting to complement the research with a qualitative analysis (e.g., interview with media users). The other intent of this study was to provide evidence whether the use of traditional and new media are not consistent in respect to demographic variables. At least for the variables chosen, the separation is apparent. Many unanswered questions persist, and it is hoped that this study will provide the stimulus for future research.
Conclusion
The findings, represent just a snapshot of how Zimbabwean consumers are using traditional media compared to new or digital media. The media consumption landscape continues to evolve quickly and it is often hard to keep up knowledge of consumers. Such information contributes to media planners' and understanding of consumption patterns and free time usage of different individuals. As the marketing and media landscape have evolved and continues to evolve to include digital media marketing, online advertising, marketers' responsibility in optimising their choice of media and allocating their budgets appropriately has become even more complex. Media planners will hopefully utilize the findings in media planning activities, such as media use and scheduling, for their organisations or clients. Currently, there are no clear guidelines and a paucity of academic research on this topic. In particular, the study was intended to provide new information on the consumption between traditional and new media, and greater insight into less researched markets such as Africa. Current patterns of traditional and new or digital media consumption create many challenges for accurate measurement, including device, place and time. This study contributes to the body of work on media consumption patterns, the focus is more practical, in the vein of empirical work that has marketing and media practitioners interest. Previous studies have argued that patterns of consumption among news users varied with outlets, media sources, a combination of both old (broadcasting mass media) and new (social media). As a result, this generates into complex patterns of media use including culture, status and available infrastructure. Further, this study provides evidence of reassurance as a booster of new media consumption without totally removing traditional media's influence for those not generally amenable to its experience, thereby rendering responses to complementary media more favorable. Last, the results of this study offers practical implications for marketers and media planners in terms of how to target more- and less-waste on consumers by using right media platforms that depict time consumption of media.
References
Austin, A., Barnard, J., & Hutcheon, N. (2016). Media Consumption Forecasts 2016. Zenith: The ROI Agency. https://communicateonline.me/wp-content/uploads/2016/06/Media-Consumption-Forecasts-2016.pdf. [ Links ]
Blank, G., & Lutz, C. (2017). Representativeness of Social Media in Great Britain: Investigating Facebook, LinkedIn, Twitter, Pinterest, Google+, and Instagram. American Behavioral Scientist, 61(7): 741-756. [ Links ]
Becker, G.S. (1965). A Theory of the Allocation of Time. The Economic Journal, 75(299): 493-517. [ Links ]
Bhatt, A. (2017). Media Habit: An Engagement with Current Trends in Media Consumer Preferences. International Research Journal of Multidisciplinary Studies, 3(8): 1-12. [ Links ]
Clow, K.E. & Baack, D.E., (2018). Integrated Advertising, Promotion, and Marketing Communications, (8th Edition). Harlow: Pearson. [ Links ]
Damásio, M., Henriques, S., Silva, M.T., Pacheco, L., & Brites, M.J. (2015). Between Old Broadcast Media and New Networked Media: Materiality and Media Consumption Practices. International Journal of Communication, 9(1): 386-411. [ Links ]
Dimmick, J. Feaster, J.C., & Hoplamazian, G.J. (2010). News in the interstices: The niches of mobile media in space and time. New media & society, 13(1): 23-39. [ Links ]
Haight, M., Quan-Haase, A., & Corbett, B.A. (2014). Revisiting the digital divide in Canada: the impact of demographic factors on access to the internet, level of online activity, and social networking site usage. Information, Communication & Society, 17(4): 503-519. [ Links ]
Hargittai, E. (2015). Is bigger always better? Potential biases of big data derived from social network sites. The ANNALS of the American Academy of Political and Social Science, 659(1): 63-76. [ Links ]
Helles, R., Ormen, J., Radil, C., & Jensen, K. B. (2015). The Media landscapes of European audiences. International Journal of Communication, 9(1): 299-320. [ Links ]
Hess, M., & Doe, P. (2013). The Marketer's Dilemma: Focusing on a Target or a Demographic? The Utility of Data-integration Techniques. Journal of Advertising Research, 53(2): 231-236. [ Links ]
Jordaan, Y., Ehlers, L., & Grové, J.M. (2011). Advertising credibility across media channels: Perceptions of Generation Y consumers. Communicare, 30(1): 1-20. [ Links ]
Katz, E., Blumler, J., & Gurevitch, M. (1974). Uses and gratifications research. The Public Opinion Quarterly, (37)4: 509-523. [ Links ]
Kaplan, A. M. (2015). Social Media, the Digital Revolution, and the Business of Media. International Journal on Media Management, 17(4): 197-199. [ Links ]
Kaplan, A. M., & Haenlein, M. (2010). Users of the World, Unite! The Challenges and Opportunities of Social Media. Business Horizons, 53(1): 59-68. [ Links ]
Lutz, C. (2016). A social milieu approach to the online participation divides in Germany. Social Media + Society, 2(1), 1-14. [ Links ]
Marques, R. F., & Batista, J. L. (2017). Information and Communication Overload in the Digital Age. Hershey, PA: Information Science Reference.
Näsi, M., & Räsänen, P. (2013). Changing Media Preferences? Comparing the Perceived Importance of Television, Newspapers and the Internet in Finland, 1999-2009. Nordicom Review, 34(2): 77-92. [ Links ]
Napoli, J., & Ewing, M.T, (2011). The media habits and internet practices of the net generation, Theme: Connections between Marketing and Information Technology, pp. 1658-1673. [ Links ]
Nhedzi, A. (2018). The relevance of traditional and new media in the wired world. Communtas 37(1):1-25. [ Links ]
Nkiru, N.A. (2011). Mediamorphosis: Analyzing the Convergence of Digital Media Forms alongside African Traditional Media. African Research Review, 5(2): 19, 115-125. [ Links ]
Nossek, H., Adoni, H., & Nimrod, G. (2015). Is print really dying? The state of print media use in Europe. International Journal of Communication, 9(1): 365-385. [ Links ]
Nysveen, H., Thorbjørnsen, H., & Pedersen, P.E. (2005). WebTV Channel Additions: Channel Complementarity in the Broadcasting Industry. The International Journal on Media Management, 7(3 & 4): 127-137. [ Links ]
Odun, O., & Utulu, A.U. (2016). Is the new media superior to the traditional media for advertising. Asian Journal of Economic Modelling, 4(1): 57-69. [ Links ]
Pacheco, L., da Silva, M.T., Brites, M.J., Henriques, S. & Damásio, M.J. (2017). Patterns of European youngsters' daily use of media. Observatorio, 1(1): 1-18. [ Links ]
Pallant, J. (2013). SPSS Survival Manual: A step by step guide to data analysis using SPSS, 5th edition. Crows Nest, N.S.W.: Allen & Unwin.
Ruppel, E.K., & Burke, T.J. (2015). Complementary Channel Use and the Role of Social Competence. Journal of Computer-Mediated Communication, 20(1): 37-51. [ Links ]
Schrøder, K.C. (2015). News media old and new: Fluctuating audiences, news repertoires and locations of consumption. Journalism Studies, 16(1): 60-78. [ Links ]
Scolari, C.A. (2013). Media Evolution: Emergence, Dominance, Survival, and Extinction in the Media Ecology. International Journal of Communication, 7(1): 1418-1441. [ Links ]
Talafuse, A., & Brizek, M.G. (2015). Traditional and digital media advertising preference: a descriptive evaluation of Billings, Montana mothers. Journal of Management and Marketing Research, 18. http://www.aabri.com/jmmr.html. [ Links ]
Van Cauwenberge, A., d'Haenens, L., & Beentjes, H. (2010). Emerging Consumption Patterns among Young People of Traditional and Internet News Platforms in the Low Countries. Observatorio, 4(3): 335-352. [ Links ]
Van Dijck, J. (2013). The culture of connectivity: A critical history of social media. Oxford: Oxford University Press. [ Links ]
Varga, Z. & NyIrő, N. (2014). Through the kaleidoscope: Media consumption patterns in the participatory cross-media era. Vezetéstudomány / Budapest Management Review, 45(2): 4-13. [ Links ]
Submitted: 6th July 2018
Accepted: 30th January 2019
How to quote this article:
Nhedzi, A. (2019). The media of Consumption and the Consumption of time: How a consumer in fast-paced economy use traditional and new media tools. Observatorio, 13(2), 15-47.

