Serviços Personalizados
Journal
Artigo
 Inglês (pdf)
 Artigo em XML
 Referências do artigo
 Enviar este artigo por email
Indicadores
-
 Citado por SciELO
 -
 Acessos
Links relacionados
-
 Similares em
SciELO
Similares em
SciELO
Compartilhar

 Permalink
Observatorio (OBS*)
versão On-line ISSN 1646-5954
OBS* vol.11 no.2 Lisboa jun. 2017
Emotional Design in Web Interfaces
Margarida Carvalho*, Lídia Oliveira**
*Mestre em Comunicação Multimédia, Departamento de Comunicação e Arte, Universidade de Aveiro, Portugal (margarida.scarvalho@gmail.com)
**Professora Associada c/ Agregação, Departamento de Comunicação e Arte, Universidade de Aveiro, Portugal (lidia@ua.pt)
ABSTRACT
In the area of human-computer interaction, over the last decade, there has been a growing interest on emotional factors, valuing above all the user experience. Emotions play a crucial role - in terms of both performance and influence - in areas such as attention, motivation, memory, decision-making and behavior. Therefore, not only emotion influences the interaction with websites but they also trigger emotional responses, and these responses can determine which website users choose. Therefore, were analyzed the emotional responses triggered in the interaction with Duolingo's interface (a learning languages website) taking into account the different components of emotional design, using data gathering instruments such as eye tracking and self-reporting methods. In this way, the present work intended to contribute to the design of interfaces that appeal in a greater extent to the users' emotions, in order to improve their user experience while increasing their level of engagement.
Keywords: emotional design, web, interfaces, emotions
Introduction
Over the years, the focus of research in the field of human-computer interaction has been usability, which traditionally emphasizes the ease of use and functionality based on observed cognitive activity. Only recently, and prompted by Norman (2004), the role of aesthetic and affective aspects of interface design (Dillon, 2002; Norman, 2004) become more prominent leading to a growing interest on emotional factors. Works such as Jordan (2000), Desmet (2002) and Norman (2004) advocate a greater focus on pleasure and emotion in the user experience design of a product. “Emotions play an important role in how the user perceived the product (…) to achieve a meaningful relationship to a product.” (Fossdal & Berg, 2016, p. 95)
Furthermore, emotions dominate decision-making process (Baumeister, Dewall, & Zhang, 2007; Polignano, 2015), direct attention and enhance particular memories over others (Reeves & Nass, 1998), being thus closely linked to attitudes, motivations and users' decisions (Koshkaki & Solhi, 2016). Consequently emotions influence all aspects of our interactions with websites (Forlizzi & Battarbee, 2004) (Emanuel, Rodrigues, & Martins, 2015; Yin, Zhang, & Li, 2014). Moreover, these trigger complex social and emotional responses identical to that emotional responses experienced when interacting with people (Desmet, 2002). In particular, the positive emotions can increase users' motivation and fixation (Isen, 1993). Emotions can be thereby considered in the field of human-computer interaction, as important factors to take into account for the construction of affective, satisfactory and efficient interfaces (Eskimez, Sturge-Apple, Duan, & Heinzelman, 2016).
In this sense, emotions begin to take the lead role in product design becoming a competitive differentiator factor, in that products perceived as pleasant, with aesthetic qualities that capture the attention of users (Gorp & Adams, 2012) (Seo, Lee, & Chung, 2016), are easier to learn and operate better (Norman, 2004).
While surfing the web, users are faced with a wide variety of choices of websites, having the ability to move quickly and easily from one to another. According to Bucy (2000 apud Deng & Poole, 2010) emotional responses are a key factor for the user preference for a specific site.
Thus, emotional design has become a powerful tool in creating exceptional user experiences on the web, making the user come back, participate and announce (Kim, Lee, & Choi, 2003) (Lockner & Bonnardel, 2015; Polignano, 2015)
Under this issue, the research question that arises is which aspects of an interface trigger emotional responses on users. However, in order to get an answer to this question should be considered the techniques of measuring emotional responses and so, the secondary research question is posed: which techniques and instruments can measure adequately the emotional responses.
This study main aim is to systematize aspects needed in a web page that reinforce positive emotions and promote desirable behaviors in users.
Method
Participants
The sample population was obtained by convenience sampling. The study was released via email and about 30 people showed up to participate. Of the 30 volunteers, 15 were females and 15 males, with ages ranging between 18 and 44 years. The age group with more participants is 25 to 34 years (60%), followed by the range of 35 to 44 (30%) and finally the range of 18 to 24 years (10%). In regards of web browsing experience, the majority of participants (53.33%) declared themselves as an experienced web user, 40% of participants considered a very experienced web user, whereas only 6.67% of participants consider themselves inexperienced users.
Therefore, we can state that the study sample is balanced in terms of gender (50% female and 50% male), the predominant age group stands at 25 to 34 years, while the vast majority of participants consider themselves as experienced (and very experienced) web users.
Research Design
For this research was used the case study methodology. Duolingo's interface was analyzed in the various dimensions of emotional design, using as tools to collect data the eye tracker and self-report tools (namely, aesthetic and perceived usability scales, semantic differential scales, and the emotional experience report).
The empirical study consisted of 3 phases, each dedicated to one of emotional design dimensions. Regarding the visceral dimension (first phase), which can be studied observing user's first impression, participants were exposed to Duolingo's Homepage for five seconds with the eye tracker, then they evaluated the images on a perceived aesthetic scale and pointed out what emotions were triggered.
Concerning the behavioral dimension (second phase), related to how the user uses and experience the product, participants were asked to use Duolingo, while being recorded by the eye tracker. First, they had some required tasks to accomplish and then they could navigate freely for about 3 minutes. After, the participants completed a questionnaire intended to measure the perceived usability and emotions that were triggered in the interaction.
As to the reflective dimension (third phase), the component that can be measured through the perception of the experience over time, participants were asked to use Duolingo integrated into their daily activities over a period of 5 weeks, reporting in what level some emotions were (or not) part of the experience.
Measures
The Eye tracking is a method used to track the eye movement towards a visual environment by recording the observing pattern of the individual, their pause times, the total time fixing a given point on the screen, thus becoming a simplifying tool of the analysis of objective data about user behavior (Marques, 2009; Rodrigues, 2010) (Ooms et al., 2014) (Blascheck et al., 2017; Weichbroth, Redlarski, & Garnik, 2016). This technique is often used to evaluate the visual appeal of websites (Djamasbi, Siegel, & Tullis, 2010) (Gonçalves et al., 2013) and which elements of an interface draw more attention from users (Huisman, 2011) (Radecký, Vykopal, & Smutný, 2015). The resulting data from some studies (Nummenmaa, Hyönä, & Calvo, 2006; Calvo & Lang, 2004, 2005 apud Huisman, 2011) (Lu & Jia, 2014; Nguyen, Seif El-Nasr, & Isaacowitz, 2017) comparing positive and negative visual stimuli indicate an attention tendency towards emotional stimuli in general. Thus, it is considered that eye-tracking metrics such as the number and duration of fixations, may be considered an indication of an affective response (Huisman, 2011) (Bayliss et al., 2013). Therefore, the eye tracker was used to collect data on users' first impression and perceived usability of Duolingo's interface, in phase 1 and 2 of the empirical study.
To measure the subjective component of the emotions were used non-verbal self-report tools. So, in order to collect data relating to the aesthetics and usability perceived by users, in addition to the eye tracker, questionnaires were used. Questionnaire 1 was used to measure users' first impression (visceral dimension) and was composed partly by "VisAWI-S" (Moshagen & Thielsch, 2010) and partly adapted from "AttrakDiff" (Prinz, Menschner, & Leimeister, 2012), both perceived aesthetic scales. Questionnaire 2 was used to collect data from the behavioral dimension, to measure perceived usability, and was adapted from the "Post-Study System Usability Questionnaire" (PSSUQ) (Lewis, 1993). In the end of both questionnaires was presented a table of emotions, in which the participants had to indicate in what level the emotion made part of the experience. This was adapted from the package 3 of the Day Reconstruction Method documentation (Kahneman, Krueger, Schkade, Schwarz, & Stone, 2004) in order to reflect the most relevant emotions associated with emotional experiences in human-computer interaction (Huisman & Hout, 2010).
This same table together with a field for access time constituted the Experience Diary that participants filled every time they accessed Duolingo in the period of autonomous use (third phase of the empirical study). The Last Diary of Experience was the final questionnaire, consisting of specific questions related to other aspects of involvement over time.
Results
Participants' emotional responses in the various aspects of emotional design (visceral, behavioral and reflective) were observed and analyzed through the data collected by the eye tracker, the scales of perceived aesthetics and usability, and emotions reported by users. Furthermore, it was studied emotional experience over time. The main aim was on one hand confirm if eye tracking tools and self-report (like the scales of perceived usability and aesthetics, the semantic differential scales and electronic diary of the experience) are, or not, appropriate techniques to measure emotional responses; and on the other hand, find which aspects of an interface trigger emotional responses on users.
Visceral Design – First Impression
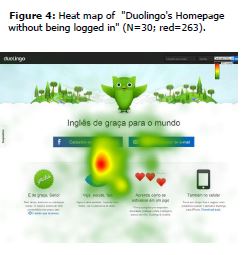
In order to measure users' first impression they were exposed to "Duolingo's Homepage without being logged in" screenshot for about 5 seconds in eye tracker and after participants completed the Questionnaire 1.
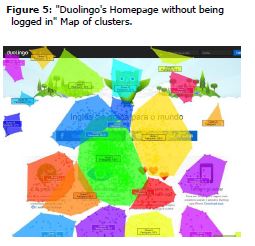
In terms of eye tracking data analysis, first the fixation count heat map was observed, then map of clusters. Next, were defined areas of interest based on which were calculated eye tracking metrics such as time to first fixation, first fixation duration, percentage of users who fixated their gaze on a given element of the interface and finally the total duration of the fixations. Generally, fixations indicating focused attention are defined by the stationary position of the eyes of 100-300ms (Djamasbi et al., 2010; Huisman, 2011; Poole & Ball, 2005) and as such, it was considered as a fixation the stationary position of the eye for at least 100ms.
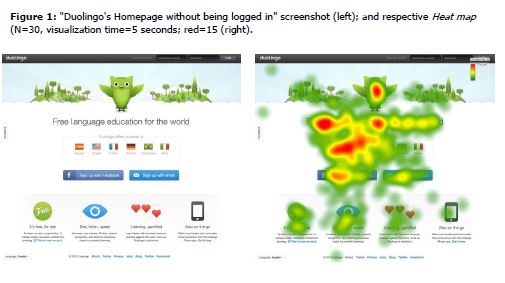
The areas that show a higher number of fixations were the "Mascot" (the green owl called Duo), the "Tagline" ("Free language education for the world") and the "Flags" (indicative of the available courses), followed by the registration buttons via facebook or e-mail. The lower area of the site, which has additional features, presents a considerably lower number of fixations. The cluster map confirmed this information. Thus, it appears that 50% of participants stared at the "Mascot", about 97% at the beginning of "tagline" and all participants look at the "flags" regarding the courses administered. Moreover, the registration button on the site through facebook had 87% of views and by e-mail only 60%. From this information were defined areas of interest, based on which were calculated eye tracking metrics that indicate that these areas are more likely to be noticed by the user and therefore attract your attention more, and can prove equally with interest unconscious emotional.
The time to first fixation is a metric that measures how long it takes a participant to fix his gaze on an area of interest for the first time, beginning to be measured as soon as the image is displayed and stopping as soon as the user stares at the area of interest. Faster times till the first fixation in a area indicates that it attracts most user attention (Poole & Ball, 2005). The overall mean time to first fixation of each area of interest was calculated (N = 30).
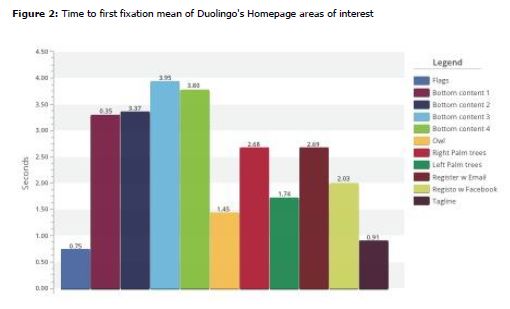
Regarding the percentage of participants who fixated at least once in the areas of interest, it can be seen that three areas of interface stand out: the "Flags" of the courses offered by the platform (100%), then with little difference the "Tagline" (97%), and with 80% is the button "Register with Facebook". Finally and with a considerable difference appears "Mascot" with 53% of participants fixing their gaze.
The areas of interest where the total duration of fixations is greater, and with great difference in-between, are the "flags" (1.37 sec) and the site "Tagline" (1.04 seconds). Then, in exaequo with 0.39 seconds of total duration of fixations appear the "Mascot" and the button "Register with Facebook."
After viewing Duolingo's Homepage screenshot, participants responded to Questionnaire 1 (N=29). The first question presented four statements, each referring to a dimension of aesthetic appreciation, to mark in a 5-point Likert scale, where 1 = strongly disagree and 5 = strongly agree. Statistical calculations were performed in order to understand what the average overall picture impression was, and which were the scores on every feature of the aesthetic - simplicity, diversity, color, and craftsmanship. Moreover, to measure specific parameters like pleasantness, attractiveness and creativity, was used a 7-point semantic differential scale with the adjectives: pleasant - unpleasant, attractive - unattractive; creative – unimaginative; therefore the lower the assigned level, the more positive the evaluation.
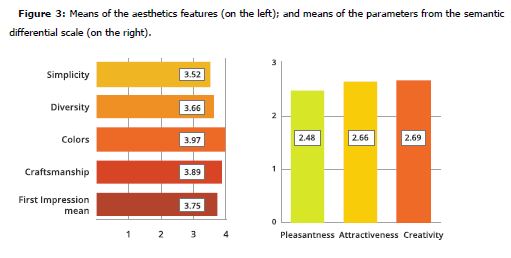
The first impression mean is 3.75 and therefore very positive, showing that all individual parameters scored above 3, which becomes clearly favorable over the first impression. Regarding the other parameters: the mean of the pleasantness was 2.48; attractiveness' mean was 2.66; and with what concerns creativity, the mean was 2.69. In conclusion, "Duolingo's Homepage without being logged in" image reports positive means in what regards aesthetics in general, and was considered nice, attractive and creative.
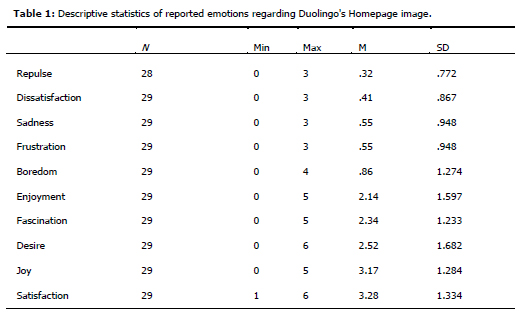
In order to capture what emotions were triggered by the "Duolingo's Homepage without being logged in", users were asked to rate in a 7-point scale (where 0 = the emotion was not experienced at all and 6 = the emotion was a extremely important part of the experience) a list of web-relevant emotions (Huisman & Hout, 2010). In addition to the analysis of individual emotions, these were grouped into two groups:
- positive emotions: Joy, Desire, Fascination, Satisfaction and Enjoyment; - and negative emotions: Sadness, Disgust, Boredom, Dissatisfaction and Frustration.
As for the means of triggered emotions, negative emotions have lower means (between 0.32 and 0.86), while positive emotions have higher means (between 2.14 and 3.28), being Enjoyment the positive emotion with lowest mean. Note also that the emotion with the highest mean is the Satisfaction (M = 3.28), followed by Joy (M = 3.17) and Desire (M = 2.52), and emotions with the lowest mean are Repulsion (M = 0.32) and Dissatisfaction (M = 0.41).
The majority of the participants classified Joy as having been a major part (24.14%), somewhat important (44.83%) and very important part of the experience (6.9%). With regard to Sadness, 68.97% stated that they haven't experienced this emotion at all; 13.79% of the participants stated that Sadness was a very unimportant or unimportant (10.34%) part of the experience. Desire is the emotion that presents greater standard deviation, although the main attributions to this emotion were very important (24.14%) or just as important part of the experience (also 24.14%). Regarding Disgust, the majority of participants (82.14%) considered that they haven't experienced this emotion in any way. The same happens with Boredom; about which 58.62% of the participants stated so. The majority of participants have considered that Fascination was somewhat important or important part of the experience (37.93% and 34.48% respectively). Regarding Satisfaction, 48% of the participant's states that this emotion was an important part of the experience, with the following highest frequencies being the "emotion was a very important part of the experience" (13.79%) and " the emotion was somewhat important part of the experience" (10:34 %). Dissatisfaction was reportedly not an emotion felt at all (75.86%). The same happens with Frustration, about which 68.97% of the participants stated that they haven't experienced that emotion. Enjoyment shows the highest frequencies at "the emotion was an important part of the experience" (31.03%), followed by "the emotion was not experienced at all" (27.59%), and then " the emotion was somewhat important part of the experience" (17.24%).
Behavioral Design – Perceived Usability
In order to understand how the user experiences the website, participants were asked to use Duolingo with the eye tracker. First, they had to finish assigned tasks from a scenario. Initially users had to register with their e-mail in Duolingo, selecting the English language to learn. Then, they had to complete Duolingo's Tour, and after that they had to complete the first level of the basic level. At the end of these steps, participants could browse freely for about 3 minutes. After this use test participants answered to Questionnaire 2, whose goal was to collect usability and functionality perceived by users during the interaction that had just taken place, as well as the classification of emotional user experience. On account of differences in viewing patterns and attention when people make mandatory or when they are navigating freely, it was chosen to do the analysis of these two types of navigation separately.
Guided Navigation.
For each page visited were defined areas of interest, based on the fixation count heat map and map of clusters, and then adjusted to the areas of the interface. After two eye tracking metrics were analyzed: number of fixations and fixation duration (that can be taken as an indication of affective responses (Huisman, 2011).The pages analyzed were:
- The homepage without being logged in;
- The final page of the tour;
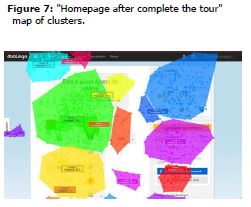
- The homepage after complete the tour;
- Level Page before the first lesson;
- Completion screens (2) of the first lesson;
- Level Page after completing the first lesson of the basic level.
In the "Homepage without being logged in", the areas which protrudes by a greater number of fixations and a higher percentage of participants fixing on it are the registration buttons, where 93% of the participants fixed their gaze in the "Register with facebook" button and all of them (100%) fixed on "Register with e-mail" button. There is also a large concentration of gaze points in the central area immediately below this buttons, which suggests the appearance of the registration form (image that the eye tracker didn't record).
Regarding the calculated eye tracking metrics, there is a mean of 45.53 fixations in the area immediately below the registration buttons. Other areas worthy of mention are those of the registration button with facebook (14.63 fixations) and with the email (12.63 fixations). As regards the duration of fixation, the areas that registered higher fixation duration means were the "create account form" zone (0.39 second) and the registration buttons (0.30 seconds).
There is undoubtedly a higher level of attention's focus on the registration button and the account creation form. Since the required task in this screen was register in the site with the email address, the results seem obvious.
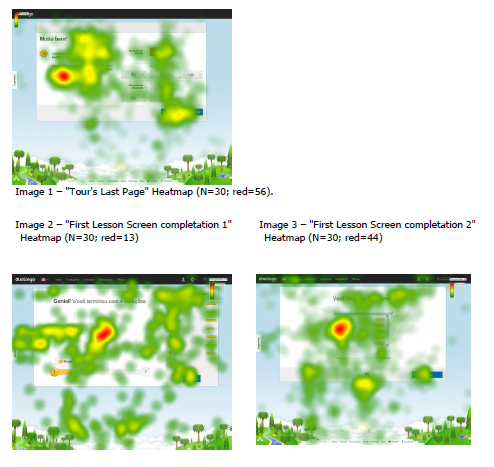
Regarding the "Tour" it was only analyzed the final page (see Appendix A image 1), which shows a greater number of fixations on the left side, where the text which explains the dynamics of the lessons is located. There is also some focus, although more dispersed, on the right side of the screen, where the Skilltree is, and then in the "Continue" button. The eye tracking metrics calculated corroborates this information. There is positively a higher fixation concentration in the informative text about how the site works (fixation count mean=21.30; fixation duration mean=0.32 seconds).
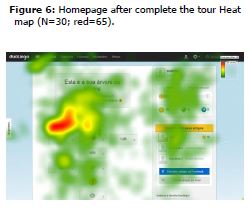
After completing the Tour, participants were directed to Duolingo's Homepage (already logged in), where they had to find the access to the first lesson of the basic level. Based on the heat map we could comprehend that participants' attention was distributed between the access to the lesson, since it was being signaled by the mascot, and the areas of "user progress" and "compete with friends" (located on the site's right sidebar). The eye tracking metrics calculated confirm this observation. The fixations count mean indicate 31.54 fixations at the top of the Skilltree in the access to the first lesson, an highly disparate value to the remaining areas of interest.
After clicking on the button, which proceeds to the first lesson of the basic level, the participant is redirected to the level page. The heat map shows a focus of fixations on the icon that effectively gives access to the first lesson, not only because it is the entry that participants seek but also because the icon is blue, symbolizing the fact that it is active, contrasting with the other icons that are gray. Again, eye-tracking metrics such as number of fixations and duration confirm this observation.
By clicking on first lesson's icon, exercises like matching words to pictures, translation from Portuguese to English and vice versa, audio exercises and even tasks that require voice recording are presented to the participants. These exercises are shown randomly to users and for this reason no data was extracted and analyzed regarding the screens of exercises.
By the time lesson 1 is completed, participants are presented with the completion screens of the first lesson (see Appendix A image 2-3). The first one tells the user the remaining number of lives, the points that they have (represented by coins); the second contains the words in the exercises that were reinforced; and both have the action button "Continue". The heat map reveals that the area with the highest concentration of fixations is the image of the "coins", and then the "Reinforced words". The "Continue" button also features some fixations. Regarding the first completion screen, based on the number of fixations, the areas of greatest interest are the image of coins (M = 21.67), then the area of "Reinforced words" (M = 13.67), and the "progress bar" (M = 4.33). The fixation duration mean puts in first place the "coins" and the "progress bar" (0.30 sec), followed by the "Continue" button (0.29 seconds).
Then, the user is automatically redirected to the level page after completing the first lesson of the basic level, and from this point participants could browse freely for a few minutes in Duolingo.
Free navigation.
Regarding the free navigation period, participants' recordings made with the eye tracker were observed from the last mandatory screen until 3 minutes of recording, in order to understand what actions participants would take next. Some behavior patterns emerge. Most participants explored a little of the page level, check out the key that dispenses from the level, looked up and explored the comments, and then the majority started the second lesson of the basic level. However, there were those who had a different attitude, exploring some more Duolingo eg returning to the home page. Still, user profile pages, settings page and menu links, such, as "Translations", Vocabulary and Conversations were the favorite destinations.
Generally, in the Settings pages the focus of attention was on the forms' labels. On the other pages visited, there is the concentration of the fixations on the illustrative images, for example, in the "Profile Page" in the "Badge" that indicate the learning stage of progress; or in photographic image, like in "Translations" page, where the focus was on language experts photos.
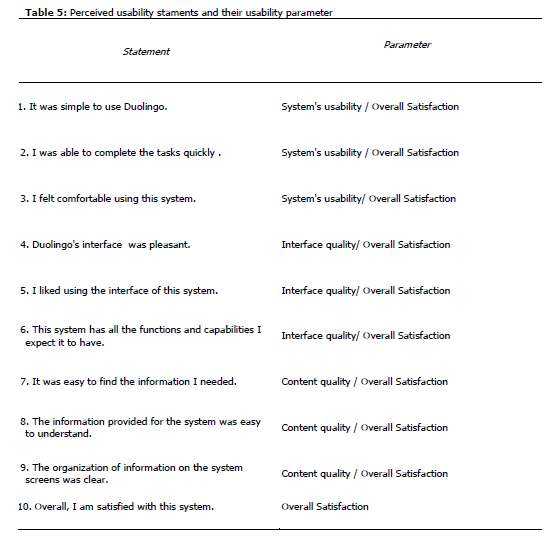
After Duolingo's use test, participants completed a questionnaire intended to measure their impressions on the usability of the site and how they classified the experience they had. The first question of the questionnaire included 10 statements, on which users had to indicate their level of agreement in a 7-point scale, where 1 = strongly disagree and 7 = strongly agree. It was calculated the means of the appropriate statements for each parameter, being possible to calculate four scores: overall satisfaction, system's usability, content quality and interface quality (see Appendix B). In cases where the participant did not respond or select the option N/A (= not applicable), the mean was calculated of the remaining items.
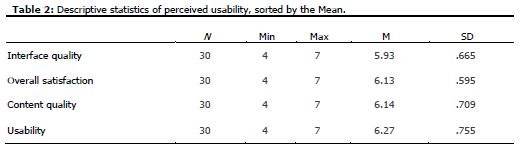
That said, the analysis of the data shows that all parameters had as minimum 4 and maximum as 7, which verifies to be very positive as the level of agreement rises as the number indicated. Moreover, all means also revealed to be strongly positive, performing all over (or very close) of 6. The parameter that has the highest mean is the usability (M = 6.27), followed by the content quality (M = 6.14), overall satisfaction (M = 6.13) and finally the interface quality (M= 5.93). The fact that this parameter scored the lowest can be explained by the fact that one of its statements recorded the highest number of N / A (= not applicable) replies. The statement "Duolingo has all the features that I hoped he had" had an mean noticeably below the other statements (5.39). All the rest have means above 6. Thus, one can say that in general, participants considered the usability of Duolingo, including the content quality and the interface very positive.
In order to check the emotions triggered by the interaction with the site, the same table of emotions as that used in the evaluation of visceral dimension was used. Negative emotions (sadness, dissatisfaction, boredom and disgust) show maximum values very low (1 or 2) with the exception of Frustration that has a maximum value of 4. On the other hand, all positive emotions have maximum attribution of 6 (= emotion was a very important part of the experience).
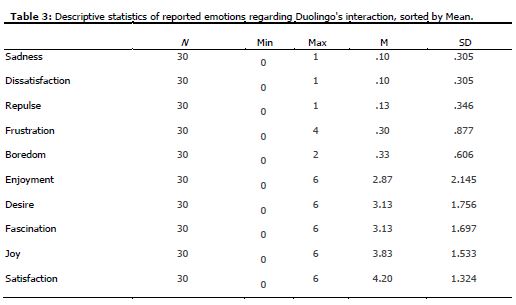
Therefore, we can presume that negative emotions have lower means than positive emotions. Negative emotions show means inferior to 0.5 (values between 0.10 and 0.33), highlighting Frustration and Boredom as the negative emotions with the highest means (0.30 and 0.33 respectively). With regard to positive emotions, they all have means above 2, standing out Satisfaction and Fascination with the higher means (4.20 and 3.83 respectively). Note also that Enjoyment was the positive emotion with the lowest mean (2.87). Furthermore, it is noted that positive emotions have larger standard deviations (above 1.2), which means a greater dispersion of values than the negative emotions.
Although positive emotions' means haven't been that high (values of 3 and 4, that is, the emotion was important or major important to the experience) and in parallel the negative emotions with the highest means have been Frustration (0.30) and Boredom (0:33); these have means lower than 1 (meaning they were very minor part of the experience or not all), which suggests that positive emotions prevail in what regards the overall satisfaction of users with the usability of Duolingo.
Reflexive Design – Experience over time
In this phase of the study, participants were asked to use Duolingo integrated in their daily activities over a period of about five weeks (34 days), and to record their emotional experiences with the site. Participants were reminded daily via e-mail to use Duolingo and register in a web platform the average time of each access and the emotions triggered by site (it was used the table of emotions previously administered for analysis of emotions in the visceral and behavioral components). From these records were generated user profiles and it was analyzed the average access time, frequency and average of the triggered emotions. Besides, it was studied emotions weekly evolution. Finally, it was sought to ascertain whether there is a relation between the average access time and the mean of emotions.
Based on the access frequency to Duolingo three user profiles were considered. From 30 participants, 34% (= 10) did not use at all the site in this phase of the study. From the remaining participants, 43% (= 13) were considered occasional users, which means that used Duolingo from 1 to 10 times. Approximately 10% (= 3) were regular users using Duolingo 11 to 24 times, and 13% (= 4) were considered very frequent users (using site between 25 and 34 times). In general, the average access time to Duolingo (N = 199) most common was 5 to 10 minutes (87 accesses), followed by hits from 2 to 5 minutes (78 accesses), 29 of the accesses were from 10 to 30 minutes and only 5 were of 30 minutes to two hours.
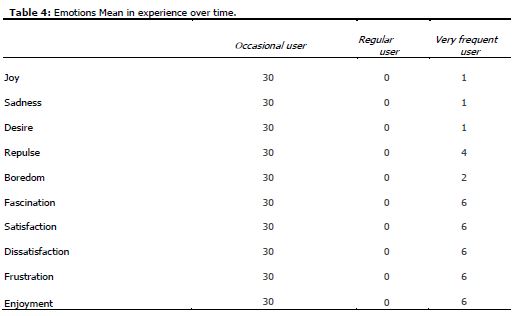
Concerning triggered emotions, Joy's mean has been similar in all three profiles, occasional users report a mean of 3.41, while regular users show a mean of 2.89 and very frequent users mean was 3.18, meaning that all profiles considered Joy an important part of the experiment. Sadness displays means below one and close to zero in all user profiles (occasional users M = 0.30; regular users M = 0.60, very frequent M = 0.22), which means that this emotion was not experienced all. Desire registered means above 2.2 (occasional users M = 2.95, regular users M = 2.33 and very frequent users M = 2.24), which shows that this emotion was one minor part of the experience. Correlated to Sadness, Repulsion shows very low means (occasional users M = 0.30; regular users M=0.24 and very frequent users M = 0.03), which means, the emotion was not experienced at all. The same happens with Boredom, presenting a mean lesser than one, although higher than the Repulse, and occasional users M = 0.95, regular users M = 0.54 and very frequent M = 0.14. Fascination has positive means close to 2, namely, the emotion was a minor part of the experience with occasional users reporting the highest mean (M = 2.68), followed by very frequent users (M = 1.97) and then regular users (M = 1.80). After Joy, Satisfaction is the emotion that has higher means (near and above 3). Occasional users indicated an average of 3.41, regular users have a mean of 2.83 and very frequent users M = 3.04. Dissatisfaction features low means as other negative emotions (sporadic users M = 0.49, regular users M = 0.61 and very frequent users M = 0.32). The same happens with Frustration, which concludes that the emotion was very unimportant part of the experience or was not experienced at all (occasional users M = 0.62, sporadic users M = 0.83; very frequent users M = 0:28). Finally, Enjoyment presents averages over 2 in occasional and frequent users (M = 2.61 and M = 2.39 respectively) while very frequent users report a considerably lower mean (M=0.75).
In general, both emotions with higher and lowest mean were the same across the different users' profiles. Positive emotions such as Joy, Satisfaction, followed by Desire and Enjoyment have higher means while negative emotions such as Sadness, Disgust and Boredom recorded the lowest values. Despite the positive emotions prevail over negative ones in all profiles; note that occasional users attribute a slightly higher mean to Boredom (M = 0.95) than regular (M = 0.54) or very frequent users (M = 0.14).
Refer also that very frequent users registered rather lower means regarding emotions like Repulsion (M = 0.03) and Boredom (M = 0.14) than the other user profiles as well as Dissatisfaction (M = 0.32) and Frustration (M = 0.28), fact that may be related to familiarity with the platform derived from the frequency of access. However, very frequent users report the lowest mean to Enjoyment (M = 0.75).
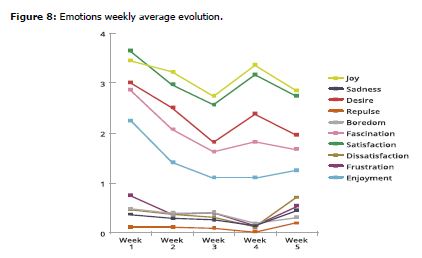
It was also analyzed emotions' evolution over the 5 weeks of independent use of Duolingo. Regarding positive emotions (such as Joy, Desire, Fascination, Satisfaction) they all show a pattern of decreasing mean in the first three weeks, and rise slightly at week 4 and then back down in Week 5. Enjoyment is the exception to this pattern with a decreasing mean from week 1 (M = 2.27) to 4 (M = 1.1) and going up slightly in week 5 (M = 1.27). Regarding the negative emotions, Dissatisfaction and Sadness demonstrate a similar pattern to Enjoyment, with mean decreasing from week to week, rising in Week 5. Repulse and Boredom have very low but constant means during the first 3 weeks, down slightly at week 4 and rising again in Week 5. Finally, Frustration is the emotion which mean varies over the course of five weeks, and its peak is the first week (perhaps derived from the habituation to the system - M = 0.76), goes down in the second week (M = 0:39), rises in week 3 (M = 0.42), back down in week 4 (M = 0:16), rising considerably in week 5 (M = 0.54).
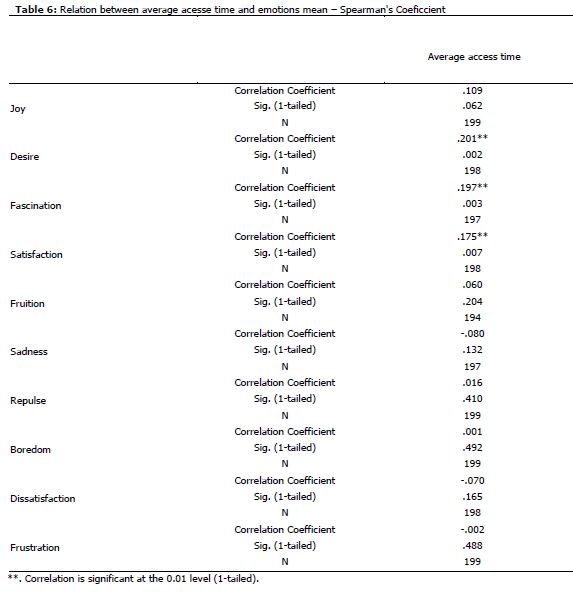
In order to try to understand whether there was relation between the access time mean and the different emotions, it was calculated Spearman's correlation coefficient, assuming that there is no relationship between the access time mean and the mean of the reported emotions (see Appendix C).
Besides a weak correlation coefficient (rs = 0.109), Joy shows no relevant significance levels. On the other hand, Desire, Fascination and Satisfaction, in addition to having positive, although weak coefficients (0.201, 0.197 and 0.175 respectively), have significance levels of 0.01. It can be deduced that the probability of chance is very low and the alternative hypothesis that states that the mean of these emotions increase as the time of access can be accepted. The same is not true regarding Enjoyment which presents a rs=0.060 (very weak) and isn’t statistically significant evidence to be able to affirm the existence of the correlation. All negative emotions, such as Sadness, Repulse, Boredom, Dissatisfaction and Frustration, exhibit weak positive correlation coefficients (Repulse rs = 0.016; Boredom rs = 0.01), too weak or negative (Sadness rs = -0.080; Dissatisfaction rs = -0.070 and Frustration rs = -0.002) although always with significance levels greater than 0.05, thus not allowing to reject the null hypothesis and having no evidence to say that there is a relation between the mean of the emotion and access time. Then it can be concluded that the data only allows considering that there is a positive, albeit weak correlation between Desire, Fascination and Satisfaction and access time.
At the end of the period of autonomous use of Duolingo was sent a final questionnaire (The Last Diary of Experience) to the 30 participants with specific questions related to aspects of the interface, such as navigability, content type, and visual customization, motivation, and the degree of familiarity (generated by identification with identical websites or by frequent use). These questions were intended to better understand the user experience over time, as well as the creation of relation with the site, both aspects that determine the reflective aspect of emotional design. The return resulted in 14 complete responses to this questionnaire.
In order to determine which was the type of motivation to use Duolingo, participants were asked if they used the site in a hedonic (pleasure and entertainment) or utility (personal/professional enhancement) way or both simultaneously. Exactly half of the respondents (=7) indicate motivations of both types simultaneously, ie, both hedonic and utilitarian, while three said they used Duolingo just for entertainment / pleasure and 4 only utility / personal enhancement and professional.
In order to validate if the opinion of the study participants about Duolingo's aesthetic qualities have been influenced by the experience over time, the statements to evaluate visual aesthetics presented in Questionnaire 1 were repeated. It is noted that the individual parameters mean are slightly higher in this dataset (simplicity M = 3.57; diversity M = 3.86, colors M = 3.86; craftsmanship M = 3.79) than in the first dataset concerning Duolingo's Homepage screenshot. The overall mean of visual aesthetics on the experience over time is 3.76, proving to be very positive, very close to the screenshot.
Despite the importance of aesthetic qualities, is the ease of interaction that allows the platforme to keep users' attention over time. Regarding perceived usability over time, it was placed two statements to classify the level of agreement on a 5-point scale. The first was "It's easy to navigate Duolingo" which averaged 3.71. The second statement, "I get what I expected when I click on the elements of this site," has an average of 3.64. Both means are clearly positive. As regards the comparison of these data with the satisfaction on the usability of Duolingo measured in the phase of behavioral dimension it was found that in both cases (perceived usability in the behavioral design phase of the experiment and after over time) participants assigned the highest level of agreement in all claims.
In order to understand the opinion about Duolingo's texts and pictures, two statements were assessed " in a 5-point scale where 1 = Strongly Disagree and 5 = Strongly Agree: "The texts had good readability" and "The pictures were attractive. Regarding texts, 9 of the participants indicated that somewhat agree, 2 indicated that they agree, 2 said they strongly agree and only 1 respondent partially disagrees with the statement. As for the images, the vast majority of participants (N = 10) indicated that they partially agreed with the statement, declaring only two people who agree and two disagree partially.
In order to understand whether personalization triggers some kind of emotional response, participants were questioned if while using Duolingo they carried out some sort of customization on the site. Regarding the profile photo, 13 participants replied that they did not changed and one person did not answer this question. As for user data and biography, nine participants stated that they did not personalize, while five stated that they did. In what concerns the password and alerts, eight participants stated that they didn't customized these options and six said they did. It can be said from the data that the customizing settings regarding the profile photo, bio, user data and password and finally warnings, didn’t have much relevance from the participants of this study, and the profile picture was the less personalized parameter.
Lastly, it was available in both the Daily Experience as the Last Diary Experience a comments field in which participants could express their opinions about the user experience with Duolingo. All comments converged on the idea that the negative feelings triggered (more specifically Frustration) while using the site, were mainly caused by answers that participants considered as valid and correct but the site marked them as mistakes. The participants attributed this to the fact that the version of the Portuguese language to be used is the Portuguese of Brazil, which presents some linguistic nuances that can lead to mistaken results.
Discussion
Regarding Duolingo's Homepage, the elements that attracted more users' attention firstly are elements that appeal to emotional instinct and can be explained by the psychological principles that are universal and guided by emotion. Thus the elements that draw the most attention of the users are in the following order, the "flags" of the courses offered by Duolingo, the website "Tagline", the "Mascot" and the button "Register with facebook", having been fixated primarily. However, in what regards the duration of the first fixation there is little variation between the different areas of interest. The percentage of fixations and total duration of fixations confirms interest areas preferred by participants. Since the foundation of emotional design is based on the fact that humans are guided by the same universal psychological principles which the core is emotion (Walter, 2011), the explanation of the data collected by the eye tracker is based on them. For example, the "Flags" and "Tagline" were fixated first because they are located in the center of the page (vertically and horizontally) and at the level of the user’s eyes and could also reveal interest in the language options that the platform provides. Furthermore, because the lettering dimension matter (Weinschenk, 2011), the "Tagline" makes use of a considerably large font size attracting the user’s gaze. The fact that the "Mascot" (the owl) attracts users' attention is related to the baby-face bias, also used by cartoonists in drawing characters with small bodies, large heads and eyes with dilated pupils, which appeal to human nature and the emotional instincts. In this sense, the designers take advantage of this principle, creating mascots for brands (eg "Freddie" the Mailchimp Monkey) (Walter, 2011). Finally, it is noted that the human being is a social, and therefore seeks interactions with others, including through technology, hence the success of social networks and, consequently, a greater number and duration of fixations on the button "Registration with facebook" (Weinschenk, 2011). Besides, areas that contain users' photos (such as in Profile Page or "Translations" page with photos of language experts) also attract users attention derived from the face recognition principle, that states that our brain has a specific part near the amygdala (emotional center), which allows the faces to be recognized faster than objects, causing people to identify and to be responsive to faces on web pages faster than any other element (Weinschenk, 2011).
Moreover, the first impression of the Duolingo's Homepage image was positive, both globally and in relation to individual parameters of perceived aesthetics (simplicity, diversity, color and perfection); was considered pleasant, attractive and creative; and triggered mostly positive emotions especially Joy, Satisfaction and Desire.
Regarding navigation activity in Duolingo when the navigation is guided by a scenario, generally users' attention focus are the elements that allow them to conclude the task at hand, e.g. at the Homepage if the task was the registration, the data reveled a concentration of attention on the action buttons that allow registration and then in the account creation form. It was also confirmed that the text length can as well attract the attention of users but images do it in a greater extent. Photographic images draw more attention due to the face recognition principle. The illustrations stand out when they appeal to the emotional instincts (for example, the "Mascot") and / or because of their large size, as in the case of the "coins" that represent the points in "Page End of Lesson 1." In regard to free navigation in the "Settings Page" the focus of attention was in the labels of the form fields. On the other pages visited in this phase, the concentration of fixations was once again in illustrative images, for example, in the "Profile Page" the "Badge" indicative of the learning progress; or photographic in "Translations" Page in photographs of language experts. In general, participants considered Duolingo's usability very positive taking into account the overall satisfaction parameters, site usability, content quality and interface quality. The emotions triggered with higher means were positive emotions such as Joy and Satisfaction.
In the experience over time, the triggered emotions with higher and lowest means were common to the defined user profiles based on frequency of access. Joy, Satisfaction and Desire have the highest average while negative emotions such as Sadness, Repulsion and Boredom registered lower values. With respect to the weekly evolution of emotions, some evolved more positively than others. Thus highlights Frustration with the highest mean in the first week, which might be related to familiarization to the site. Indeed, the majority of participants consider that the familiarity of use contributed to a more confident and effective use of Duolingo. With regard to a possible relation between the average access time and emotions that are triggered by the interface, the data allows us to state that one can consider the existence of a positive but weak relation between positive emotions Desire, Fascination and Satisfaction and the average access time.
Finally, it remains important to note that in all dimensions of emotional design (visceral, behavioral and reflective) positive emotions (Joy, Desire, Fascination, Satisfaction and Enjoyment) stood out with means always superior to negative emotions (Sadness, Disgust, Boredom, Dissatisfaction and Frustration). During this study some obstacles were found, some of which are technical limitations on the server end where the questionnaires were hosted. When the network was disrupted, the server did not allow the user to submit their response to the questionnaire. Besides, the hardware limitation, namely the fact that the eye tracking equipment was connected to a machine with low processing capacity. In this regard, it is suggested that similar studies have redundancy of server, and to connect the eye tracking device to a machine with a processing capacity sufficient for the eye tracker does not become slower especially with respect to dynamic recordings.
The study described in this paper can, in a future scenario, progress in different directions. On one hand, one can make changes in the interface according to the principles of emotional design and verify the analysis of emotional responses. Moreover, and more enticing, applying a physiological / neurological method like pupillometry, which measures the changes in pupil’s diameter and that it is interesting in the sense that it responds to the cognitive processing and stimulation intense interest, or electromyography, which measures the activity of facial muscles and facial expressions. Both methods can bring new perspectives to how we study the emotional responses due to the interaction with the interfaces and attempt to measure the correlation with physiological emotions. Furthermore, it would be also interesting to explore eye tracking metrics not derived from the gaze fixations, such as saccades (gaze motion) or scan paths (complete sequence of fixation -saccade-fixation) and how these metrics movement may or may not be an indicator of emotional responses.
References
Baumeister, R. F., Dewall, C. N., & Zhang, L. (2007). Do emotions improve or hinder the decision making process? Do Emotions Help or Hurt Decision Making?: A Hedgefoxian Perspective (Vol. 9781610445).
Bayliss, A. P., Murphy, E., Naughtin, C. K., Kritikos, A., Schilbach, L., & Becker, S. I. (2013). Gaze leading: Initiating simulated joint attention influences eye movements and choice behavior. Journal of Experimental Psychology: General, 142(1). http://doi.org/10.1037/a0029286 [ Links ]
Blascheck, T., Kurzhals, K., Raschke, M., Burch, M., Weiskopf, D., & Ertl, T. (2017). Visualization of Eye Tracking Data: A Taxonomy and Survey. Computer Graphics Forum. http://doi.org/10.1111/cgf.13079
Deng, L., & Poole, M. S. (2010). Affect in web interfaces: a study of the impacts of web page visual complexity and order. MIS Quarterly, 34(4), 711-730. [ Links ]
Desmet, P. M. A. (2002). Designing Emotions. Doctoral dissertation. University of Technology. Delft, The Netherlands.
Dillon, A. (2002). Beyond usability: process, outcome and affect in human-computer interactions. Canadian Journal of Library and Information Science, 26(4), 57-69. [ Links ]
Djamasbi, S., Siegel, M., & Tullis, T. (2010). Generation Y, web design, and eye tracking. International Journal of Human-Computer Studies, 68(5), 307-323. [ Links ]
Emanuel, B., Rodrigues, C., & Martins, M. (2015). Rhetoric of interaction: Analysis of pathos. Lecture Notes in Computer Science (including subseries Lecture Notes in Artificial Intelligence and Lecture Notes in Bioinformatics) (Vol. 9186). http://doi.org/10.1007/978-3-319-20886-2_39
Eskimez, S. E., Sturge-Apple, M., Duan, Z., & Heinzelman, W. (2016). WISE: Web-based interactive speech emotion classification. In CEUR Workshop Proceedings (Vol. 1619).
Forlizzi, J., & Battarbee, K. (2004). Understanding experience in interactive systems. Paper presented at the 5th conference on Designing interactive systems: processes, practices, methods, and techniques, Cambridge, USA.
Fossdal, M., & Berg, A. (2016). The relationship between user and product: Durable design through personalisation. In Source of the Document Proceedings of the 18th International Conference on Engineering and Product Design Education: Design Education: Collaboration and Cross-Disciplinarity, and PDE 2016 (pp. 95–100).
Gonçalves, M., Rocha, T., Magalhães, L., Peres, E., Bessa, M., & Chalmers, A. (2013). Identifying different visual patterns in web users behaviour. In Proceedings - SCCG 2011: 27th Spring Conference on Computer Graphics. http://doi.org/10.1145/2461217.2461231
Gorp, T. v., & Adams, E. (2012). Design for emotion. U.S.A: MK Publications. [ Links ]
Huisman, G. (2011). Visual Appeal and Affect in Websites - A multi-method investigation into the relation between visual appeal judgements of websites and affect. (Mestrado), Twente.
Huisman, G., & Hout, M. V. (2010). The development of a graphical emotion measurement instrument using caricatured expressions: the LEMtool. Emotion in HCI - Designing for People. Proceedings of the 2008 International Workshop Rostock, Germany: Fraunhofer.
Isen, A. M. (1993). Positive affect and decision making. In M. Lewis & J. M. Haviland (Eds.), Handbook of emotions (pp. 261-277). New York, US: Guilford Press. [ Links ]
Jordan, P. (2000). Designing Pleasurable Products. New York: Taylor and Francis. [ Links ]
Kahneman, D., Krueger, A. B., Schkade, D. A., Schwarz, N., & Stone, A. A. (2004). The Day Reconstruction Method (DRM): Instrument Documentation.
Kim, J., Lee, J., & Choi, D. (2003). Designing emotionally evocative homepages: An empirical study of the quantitative relations between design factors and emotional dimensions. International Journal of Human Computer Studies, 59(6). [ Links ] http://doi.org/10.1016/j.ijhcs.2003.06.002
Koshkaki, E. R., & Solhi, S. (2016). The facilitating role of negative emotion in decision making process: A hierarchy of effects model approach. Journal of High Technology Management Research, 27(2). [ Links ] http://doi.org/10.1016/j.hitech.2016.10.010
Lewis, J. R. (1993). IBM Computer Usability Satisfaction Questionnaires: Psychometric Evaluation and Instructions for Use. Boca Raton, FL: IBM Corporation. [ Links ]
Lockner, D., & Bonnardel, N. (2015). Towards the evaluation of emotional interfaces. Lecture Notes in Computer Science (including subseries Lecture Notes in Artificial Intelligence and Lecture Notes in Bioinformatics) (Vol. 9169). http://doi.org/10.1007/978-3-319-20901-2_47
Lu, W., & Jia, Y. (2014). An eye-tracking study of user behavior in web image search. Lecture Notes in Computer Science (including subseries Lecture Notes in Artificial Intelligence and Lecture Notes in Bioinformatics) (Vol. 8862). http://doi.org/10.1007/978-3-319-13560-1
Marques, R. (2009). Avaliação da Recepção da Informação Noticiosa em Televisão. (Mestrado), Universidade de Aveiro, Aveiro.
Moshagen, M., & Thielsch, M. T. (2010). Facets of visual aesthetics. International journal of human-computer studies, 68(10), 689-709. [ Links ] doi: http://dx.doi.org/10.1016/j.ijhcs.2010.05.006
Nguyen, T.-H. D., Seif El-Nasr, M., & Isaacowitz, D. M. (2017). Interactive visualization for understanding of attention patterns. Mathematics and Visualization. http://doi.org/10.1007/978-3-319-47024-5_2
Norman, D. A. (2004). Emotional Design: Why we love (or hate) every day things. Nova Iorque: Basic Books. [ Links ]
Ooms, K., Coltekin, A., De Maeyer, P., Dupont, L., Fabrikant, S., Incoul, A., … Van der Haegen, L. (2014). Combining user logging with eye tracking for interactive and dynamic applications. Behavior Research Methods, 47(4). http://doi.org/10.3758/s13428-014-0542-3
Polignano, M. (2015). The inuence of user’s emotions in recommender systems for decision making processes. In CEUR Workshop Proceedings (Vol. 1462).
Poole, A., & Ball, L. J. (2005). Eye Tracking in Human-Computer Interaction and Usability Research: Current Status and Future. In C. Ghaoui (Ed.), Encyclopedia of Human-Computer Interaction. Pennsylvania: Idea Group, Inc. [ Links ]
Prinz, A., Menschner, P., & Leimeister, J. M. (2012). Has NFC the potential to revolutionize self-reported electronic data capture?: an empirical comparison of different interaction concepts. Paper presented at the 2012 ACM annual conference extended abstracts on Human Factors in Computing Systems Extended Abstracts, Texas, USA.
Radecký, M., Vykopal, J., & Smutný, P. (2015). Analysis of syntactic elements and structure of web pages using eye-tracking technology. In Proceedings of the 2015 16th International Carpathian Control Conference, ICCC 2015. http://doi.org/10.1109/CarpathianCC.2015.7145116
Reeves, B., & Nass, C. (1998). The media equation: How people treat computers, television and new media like real people and places. Cambrige, UK: University Press. [ Links ]
Rodrigues, R. (2010). A cenografia das notícias televisivas em Portugal: Um Estudo de Eye Tracking. (Mestrado), Universidade de Aveiro, Aveiro.
Seo, K.-K., Lee, S., & Chung, B. D. (2016). Effects of Perceived Usability and Aesthetics on Emotional Responses in Different Contexts of Use. International Journal of Human-Computer Interaction, 32(6). http://doi.org/10.1080/10447318.2016.1160537 [ Links ]
Walter, A. (2011). Designing for emotion: Jeffrey Zeldman. [ Links ]
Weichbroth, P., Redlarski, K., & Garnik, I. (2016). Eye-Tracking web usability research. In Proceedings of the 2016 Federated Conference on Computer Science and Information Systems, FedCSIS 2016. http://doi.org/10.15439/2016F127
Weinschenk, S. (2011). 100 Things Every Designer Needs to Know About People. Berkeley, CA: New Riders. [ Links ]
Yin, G., Zhang, Q., & Li, Y. (2014). Effects of emotional valence and arousal on consumer perceptions of online review helpfulness. In 20th Americas Conference on Information Systems, AMCIS 2014.
Appendix
Appendix A: Heat maps and Maps of Clusters
Appendix B: Perceived Usability Scale
Appendix C: Relation between average access time and emotions mean - Spearman's Coefficient table