


Services on Demand
Journal
Article
 English (pdf)
 Article in xml format
 Article references
 Send this article by e-mail
Indicators
-
 Cited by SciELO
 -
 Access statistics
Related links
-
 Similars in
SciELO
Similars in
SciELO
Share

 Permalink
Medicina Interna
Print version ISSN 0872-671X
Medicina Interna vol.27 no.2 Lisboa Apr. 2020
https://doi.org/10.24950/O/271/19/2/2020
ARTIGOS ORIGINAIS / ORIGINAL ARTICLES
Secular Trends in the Mortality by Cerebrovascular Diseases in Portugal: 1902-2012
Tendências Seculares na Mortalidade por Doenças Cerebrovasculares em Portugal: 1902-2012
Carlos Pinhão Ramalheira1  https://orcid.org/0000-0002-0348-1183
Ana M. Gonçalves1 https://orcid.org/0000-0001-7048-8548
Filipa Gomes1 https://orcid.org/0000-0002-4984-4314
Rita Dutschmann1 https://orcid.org/0000-0002-8097-693X
Ricardo Gusmão2 https://orcid.org/0000-0002-6334-4607
1 Serviço de Medicina Interna, Hospital Professor Doutor Fernando Fonseca, Amadora, Portugal
2Faculdade de Medicina da Universidade do Porto, Porto, Portugal
Abstract:
Introduction: Cerebrovascular diseases (CVD) are one of the main causes of death in Portugal. Research on the epidemiologic history might help to understand the phenomenon and guide intervention strategies. Objectives: (1) Describe historic trends in mortality. (2) Estimate the impact of demographic variations on the registered number of cases.
Methods: (1) We calculated rates, specific and standardized, for deaths registered as CVD (ICD-10: I60-I69, G45; ICD-8/9: 430-438; ICD-6/7: 330-334) by sex (1902-2012) and by sex and age groups (1913-2012). We used Join point analysis to identify statistically significant changes in standardized death rates, and multivariate regression models, Poisson and negative binomial, controlling for demographic dynamics and time trend, from 1913 to 2012. (2) We calculated the contribution of demographic variations using the application RiskDiff. (3) We evaluated if changes in coding rules might have been a source of bias. Data source: National Institute of Statistics.
Results: (1) We gathered the longest and most discriminated mortality series from CVD in Portugal with data since the beginning of nationwide collection. Mortality increases exponentially with age and is higher in men. (2) We observed significant variations in age-standardized time trends (1913-1933: APC 2.0%; 1933-1955: APC -0.9%; 1955-1974: 2.9%; 1974- 1996: -2.4%; 1996-2012: -6.5%). (3) Population ageing exerteda significant pressure to increase the number of deaths, particularly in the second half of the twentieth century. However, this effect was counterweighted by protective factors.
Conclusion: CVD mortality in Portugal is particularly expressive when compared to other European countries, although significant gains have been observed in the last decades. Population ageing combined with a transition between the morbid and mortality dimensions changed the public health paradigm.
Keywords: Cerebrovascular Disorders/mortality; Portugal.
Resumo:
Introdução: As doenças cerebrovasculares (DCV) são uma dasprincipais causas de morte em Portugal. O estudo da história epidemiológica deste fenómeno contribui para a sua compreensão e ajuda a orientar estratégias de intervenção. Objetivos: (1) Descrever tendências históricas na mortalidade. (2) Estimar o impacto das variações demográficas no número de casos registado.
Métodos: (1) Calculámos taxas, específicas e padronizadas, para as mortes registadas como resultantes de DCV (CID-10: I60-I69, G45; ICD-8/9: 430-438; ICD-6/7: 330-334) por sexo (1902-2012) e por sexo e grupos etários (1913- 2012). Utilizámos Joinpoint-analysis para identificar variações estatisticamente significativas na tendência temporal e modelos multivariados de regressão, Poisson e binomial negativo, controlando dinâmicas demográficas e tendências temporais, constrangidos à população exposta, de 1913 a 2012. (2) Aferimos o peso relativo de variações demográficas recorrendo à aplicação RiskDiff. (3) Avaliámos se as interrupções na continuidade das séries definidas por alterações nos critérios de codificação da causa de morte podem ter constituído factores confundentes. Fontes dos dados: Instituto Nacional de Estatística.
Resultados: (1) Elencámos a mais longa e discriminada série de mortalidade por DCV em Portugal com dados desde que há registo com abrangência nacional. A mortalidade aumenta exponencialmente com a idade e é superior nos homens. (2) Observámos variações significativas na direcção e amplitude da tendência temporal das taxas padronizadas (1913-1933: APC 2,0%; 1933-1955: APC -0,9%; 1955-1974: 2,9%; 1974-1996: -2,4%; 1996-2012: -6,5%). (3) O envelhecimento demográfico exerceu uma pressão significativa para o aumento no número de casos particularmente na segunda metade do século XX. No entanto este efeito foi neutralizado por factores protectores.
Conclusão: Em Portugal a DCV é particularmente expressiva quando comparada com outros países da Europa embora se tenham observado ganhos significativos nas últimas décadas. O envelhecimento demográfico combinado com uma eventual transição relativa entre as dimensões morbil e de mortalidade proporcionaram uma mudança no paradigma de saúde pública.
Palavras-chave: Doenças Cerebrovasculares/mortalidade; Portugal.
Background
In the beginning of the 20th century, little was known about clinical manifestations and treatment of cerebrovascular diseases (CVD). Neurological signs and symptoms, such as convulsions and paralysis, were associated with cerebral haemorrhage and softening, following post-mortem studies of the previous centuries by remarkable authors like Johann Wepfer.1 The definition of this group of causes of death was heavily based on clinical findings and encompassed other conditions we now know can present these clinical manifestations.
In the second half of the 20th century, technological revolution produced major advances in antemortem visualization of vascular lesions and discovery of new therapeutic strategies for CVD.2 Angiography invented by Egas Moniz provided valuable information about vascular anatomy. Similarly, computerized tomographic (CT) scan and magnetic resonance imaging invented in the 1970s by Hounsfield and Damadian, respectively, have allowed definition of the site of brain infarction and hemorrhage.2
These advances in the area of CVD have facilitated the establishment of stroke units that offer effective care for stroke patients and survivors in the late 20th century following the approval of the first effective treatment for ischemic stroke in 1995.3
Currently, CVD are the second largest single cause of death in Europe after ischemic heart disease, accountable for 9% and 13% of all deaths in men and women, respectively.4 Interestingly, in Portugal there is a higher burden of cerebrovascular disease mortality relative to coronary heart disease4, although substantial declines have been observed.4,5 These declines were attributed to reduced disease incidence following improvements in risk factor management, as well as improvements in diagnosis and treatment, leading to reduced case-fatality.6,7 Moreover, recent upward trends in the prevalence of known risk factors such as obesity and diabetes, as well as higher systolic blood pressure, when compared to most European countries, raise concerns about possible slowdowns in cerebrovascular disease mortality progress seen so far.4,8 Population ageing combined with a transition between the morbid and mortality dimension might lead to a change in the public health paradigm. Stroke is a disease of immense public health importance with serious social and economic consequences. Thus, the study of dynamic changes over the last century might help to identify underlying determinants, define priorities and plan community wide interventions accordingly.
We aimed to (i) describe secular time trends in the absolute number of deaths and death rates from CVD in the Portuguese population since the beginning of nationwide data collection;
(ii) identify major changes in the time trend of age-sex adjusted rates; (iii) quantify the contribution of the variation in the population’s size, age structure and age-independent rate of death by CVD to the change in the corresponding number of deaths; and to (iv) comment on potential sources of bias from changes in mortality registration procedures.
Methods
DATA SOURCE AND DEFINITION
The number of deaths from CVD [International Classification of Diseases 10th revision (ICD-10): I60-I69, G45; ICD-8/9: 430-438; ICD-6/7: 330-334; and homologous groups], as well as the estimates of the mid-year resident population, from 1902 to 2012 for each sex, and from 1913 to 2012 by sex and 5-year age groups (up to ≥80 years), were obtained from official statistics 9. ICD-2 was introduced in 1913, ICD-4 in 1931, ICD-6/7 in 1955, ICD-8 in 1971, ICD-9 in 1980 and ICD-10 in 2002.
SECULAR TRENDS IN MORTALITY
Standardized mortality rates were calculated by the direct method using the Scandinavian European standard population as reference.
We performed an exploratory join point analysis to calculate the annual variation in age-standardized mortality for each sex and in age-sex standardized death rates to identify points of significant change in the log-linear slope of the trend (join points), using Joinpoint® version 4.1.1.5 from the Surveillance Research Program of the US National Cancer Institute. We present the results of best fitting model according to Bayesian information criterion. The estimated annual percent change (APC) in mortality for each period was calculated assuming a Poisson distribution and taking the calendar year as the independent variable.
RELATIVE WEIGHT OF DEMOGRAPHIC FACTORS
We performed a multivariate regression analysis for each period with log-linear trend identified through Join point analysis, for descriptive purposes. We ran a negative binomial regression for CVD deaths (dependent variable) by sex, age groups (<65, 65-69, 70-74, 75-79, 80+) and calendar year, as independent variables, adjusting for the population estimates in each subgroup (offset = ln (population)). We calculated robust standard errors (Huber-White Estimator) and 95% confidence intervals (CI).
CONTRIBUTION OF DEMOGRAPHIC FACTORS TO CHANGES IN NUMBER OF DEATHS
We used the tool RiskDiff, a web-based application, to assess the contribution of demographic changes and the variation in the demographic-independent trend in deaths from CVD to the observed number of deaths. This analysis was performed for the periods with constant log-linear trend identified in the join point analysis and we estimated annual effects assuming a geometric change over time.
MISSING DATA
Mortality data was missing in three years (1911-1912, 1928) and incomplete in two (1926-1927). We used a log-linear interpolation method for graphical purposes only.
Results
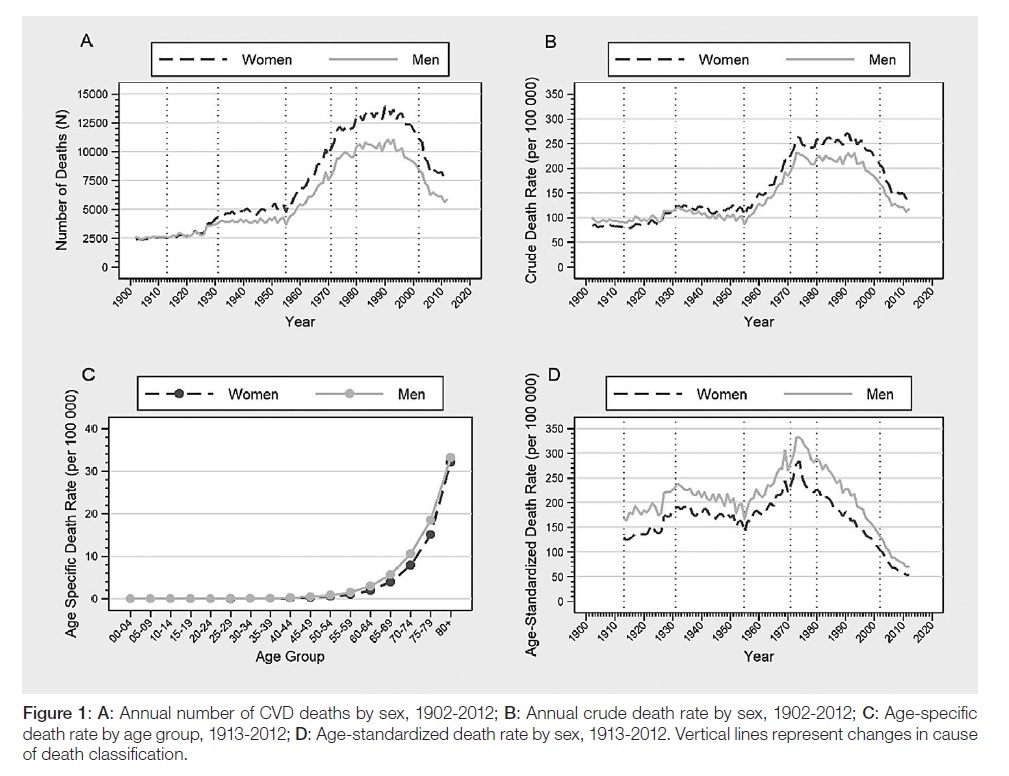
The number of deaths by cerebrovascular diseases (CVD) increased steadily in the first half of the 20th century followed by an acceleration in the third quarter, plateauing in the 80s and decreasing afterwards in both sexes (Fig. 1A and Table 1).
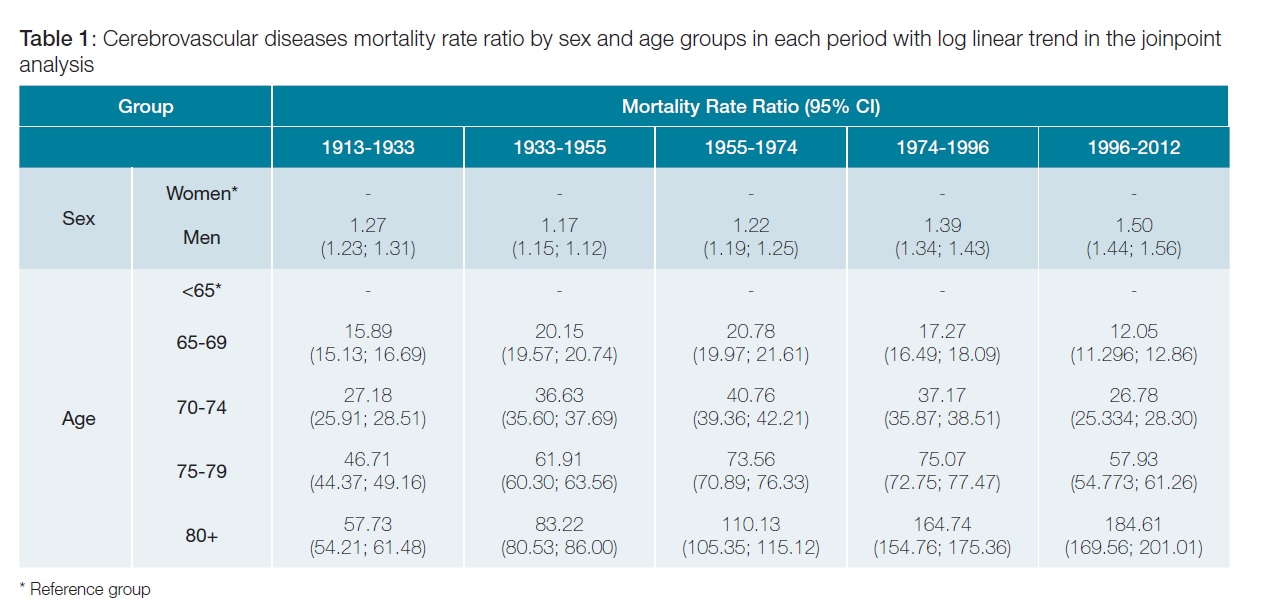
In both men and women, there is an exponential increase in the death rate with age, with people older than 80 years accounting for a rate 57 to 184 times higher than those younger than 65 years-old, independently of sex (Fig. 1C Table 2).
There are more deaths in women and that gap increased over the years due to population ageing (Fig. 1A and Table 1).
In fact, controlling for age differences the death rates were always higher in men (Fig. 1D). Independently of age and trend, men had a 1.2 to 1.5 times higher death rate.
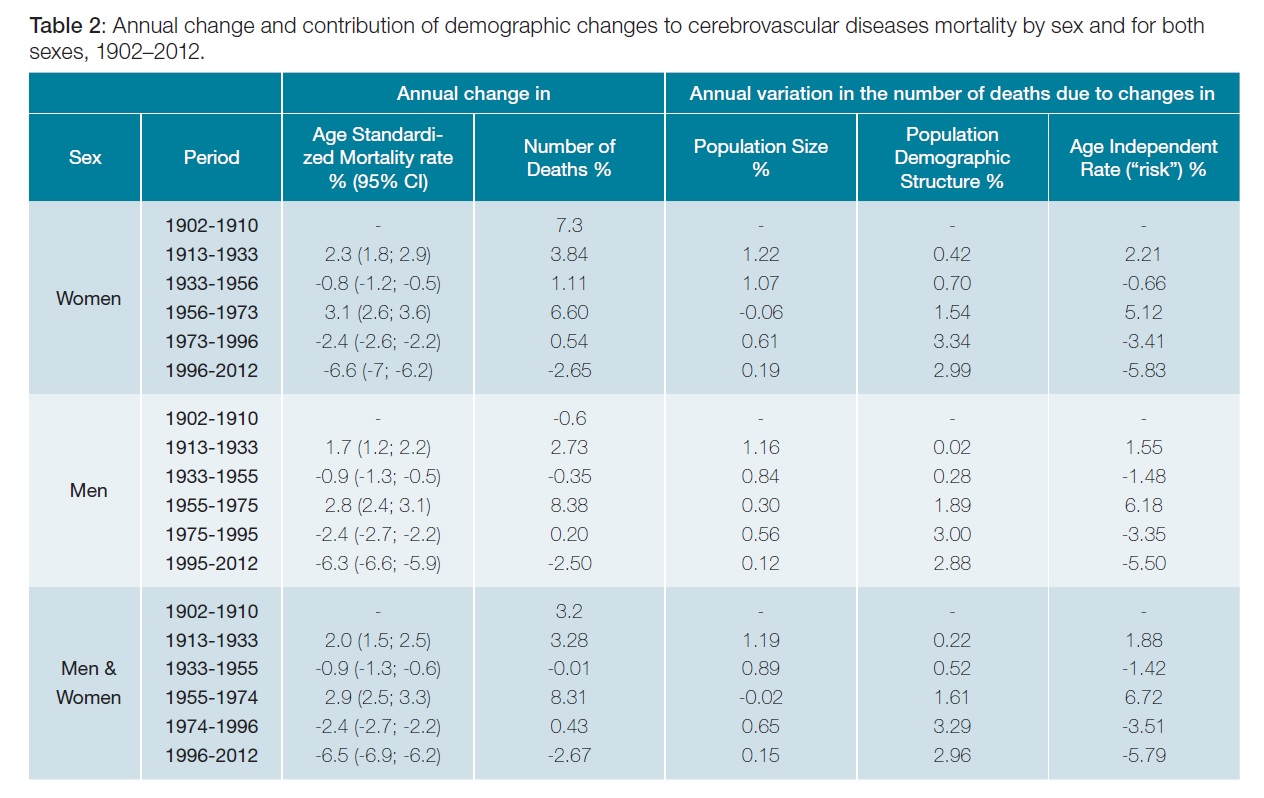
Overall, the age-sex-adjusted death rate from CVD increased between 1913 and 1933 with an annual percentage change (APC) of 2% per year; decreased between 1933 and 1955 (APC -0.9%); increased between 1955 and 1974 (APC 2.9%);and decreased since 1974(APC -2.4%) but the decrease was more pronounced after 1996 (APC -6.5%). Similar trends were observed in both sexes (Fig. 1; Table 2).
The variations in overall population size, particularly an increase observed in the beginning of the twentieth century, contributed to slight increases in the number of observed deaths by CVD [1.19% of deaths per year (1913-1933) and 0.89% per year (1933-1955)] (Table 2).
Moreover, variations in the Portuguese population age structure (population ageing) contributed to an increase in the number of deaths, especially since 1955 (1913-1933: 0.22%; 1933-1955:0.52%; 1955-1974:1.61%; 1974-1996: 3.29%; 1996-2012: 2.96%), due to a higher number ofpeople in a higher risk group (Table 2).
However, independently of variations in the population size and demographic structure variations in unmeasured risk factors contributed to variations in the number of deaths (Table 2). Between 1913 and 1933 the age-independent “risk” followed the same positive variation than that of population size and structure therefore resulting in a 3% per year increase in the number of deaths. From 1933 to 1955, unmeasured factors exerted a protective effect neutralizing the increase in population size and ageing. This trend changed from 1955to 1974,when the risk increased significantly by 6.72% per year. After 1974, the population ageing pressure to increase the number of deaths was counterweighted by unmeasured protective factors and the rate of that decrease was higher from 1996 to 2012, by -5.79% of deaths per year (Table 2).
Discussion
We observed major variations in Portuguese CVD mortality rates from 1913 to 2012. In the beginning of the twentieth century reduction in mortality from diseases more incident in younger aged groups, particularly infectious diseases that declined mainly due to improvements in treatment, might have contributed to the increase in CVD mortality rates. Further studies of competing causes of death and prevalence of known CVD risk factors are needed in order to comprehend the changes in mortality trend observed inthe second and third quarter of the twentieth century. Moreover, we observed a dramatic decrease in Portuguese CVD mortality rates since 1974, in both sexes. However, due to population ageing the number of deaths remained stable until the 1990s. This trend has been attributed to variations in known risk factors such as: decreases in the mean systolic blood pressure and blood cholesterol, diabetes management, smoking consumption and some dietary modifications. Moreover, following the advances in treatment in the mid-1990s, the decline in mortality rate increased. In fact, the mortality rateratio by age became higher in older aged groups due to a larger decline in younger patients. This might have been a reflex of improved diagnostic capacities and successful treatment, leading to lower case-fatality due to better emergency care and stroke units. This pattern is consistent in most developed areas of the world.
The interpretation of the reported trends is dependent on the quality and consistency of the source data over time. Cause of death classification errors can occur because of incorrect diagnoses, inaccurate or incomplete death certifi- cates, misuse of ICD coding rules, and variations in the use of residual categories for unknown and ill-defined causes, as well as changes in registration procedures. In fact, over the course of a century, there have been major developments in disease diagnosis and classification. To minimize this source of bias we used a large group of diseases. In Portugal, at least 6 revisions of the ICD were used. Curiously, we observed that changes in mortality trendswere close to major changes in death classification and registration procedures, particularly with ICD-4 in 1931, ICD-6/7 in 1955, ICD-8 in 1971.
Although we do not have information on CVD incidence and case-fatality, there is the concern that the recent decrease in death might be associated with a relative increase in morbidity and so the related demand for healthcare, mainly in older aged people that are likely to present other co-morbid diseases.
Conclusion
Over the course of the previous century and the beginning of the twenty-first there have been major changes in the trend of reported cerebrovascular diseases mortality. Competing risks mayhave contributed toan increase in deaths by CVD but changes in death registration procedures might have introduced bias. However, some patterns were consistent across the whole period. The mortality was always higher in men (20-50%) and increased exponentially with age. Population ageing exerted a pressure to increase CVD deaths that was surpassed by protective factors. Specialists attribute this variation to dietary modifications, lower blood pressure, lower blood cholesterol, diabetes control and smoking consumption, as well as improvements in disease treatment particularly after the nineties, leading to a reduction of mortality in younger aged groups. Further studies concerning disease incidence are neededto evaluate if the reduction in mortality contributed to a relative increase in morbid conditions. This analysis of CVD mortality data, considering demographic factors, produced results that are usable for policy makers in order to predict future needs and plan interventions accordingly.
REFERENCES
1. Coupland AP, Thapar A, Qureshi MI, Jenkins H, Davies AH. The definition of stroke. J R Soc Med. 2017;110:9–12. [ Links ]
2. Donkor ES. Stroke in the 21st century: a snapshot of the burden, epidemiology, and quality of life. Stroke Res Treat. 2018;2018:3238165. doi: 10.1155/2018/3238165. [ Links ]
3. Tissue Plasminogen Activator for Acute Ischemic Stroke. N Engl J Med. 1995;333:1581–8. [ Links ]
4. Wilkins E, Wilson L, Wickramasinghe K, Bhatnagar P, Leal J, Luengo-Fernandez R, et al. European Cardiovascular Disease Statistics 2017. Paris: European Heart Network; 2017. [ Links ]
5. Pereira M, Peleteiro B, Capewell S, Bennett K, Azevedo A, Lunet N. Changing patterns of cardiovascular diseases and cancer mortality in Portugal, 1980-2010. BMC Public Health. 2012;12:1126. [ Links ]
6. Mirzaei M, Truswell AS, Arnett K, Page A, Taylor R, Leeder SR. Cerebrovascular disease in 48 countries: Secular trends in mortality 1950-2005. J Neurol Neurosurg Psychiatry. 2012;83:138–45. [ Links ]
7. Smolina K, Wright FL, Rayner M, Goldacre MJ. Determinants of the decline in mortality from acute myocardial infarction in England between 2002 and 2010: Linked national database study. BMJ. 2012;344 :d8059. doi: 10.1136/bmj.d8059. [ Links ]
8. Pereira M, Carreira H, Vales C, Rocha V, Azevedo A, Lunet N. Trends in hypertension prevalence (1990-2005) and mean blood pressure (1975- 2005) in Portugal: A systematic review. Blood Press . 2012;21:220-6. doi: 10.3109/08037051.2012.666380. [ Links ]
9. Instituto Nacional de Estatística. Biblioteca Digital [Internet]. [cited 2019 Dec 9]. Available from: https://bdigital.ine.pt/biblioteca/index.jsp [ Links ]
Responsabilidades Éticas
Conflitos de Interesse: Os autores declaram a inexistência de conflitos de interesse na realização do presente trabalho.
Fontes de Financiamento: Não existiram fontes externas de financiamento para a realização deste artigo.
Confidencialidade dos Dados: Os autores declaram ter seguido os protocolos da sua instituição acerca da publicação dos dados de doentes.
Proteção de Pessoas e Animais: Os autores declaram que os procedimentos seguidos estavam de acordo com os regulamentos estabelecidos pelos responsáveis da Comissão de Investigação Clínica e Ética e de acordo com a Declaração de Helsínquia da Associação Médica Mundial.
Proveniência e Revisão por Pares: Não comissionado; revisão externa por pares.
Ethical Disclosures
Conflicts of interest: The authors have no conflicts of interest to declare.
Financing Support: This work has not received any contribution, grant or scholarship
Confidentiality of Data: The authors declare that they have followed the protocols of their work center on the publication of data from patients.
Protection of Human and Animal Subjects: The authors declare that the procedures followed were in accordance with the regulations of the relevant clinical research ethics committee and with those of the Code of Ethics of the World Medical Association (Declaration of Helsinki).
Provenance and Peer Review: Not commissioned; externally peer reviewed.
© Autor (es) (ou seu (s) empregador (es)) 2019. Reutilização permitida de acordo com CC BY-NC. Nenhuma reutilização comercial.
© Author(s) (or their employer(s)) 2019. Re-use permitted under CC BY-NC. No commercial re-use.
Correspondence / Correspondência:
Carlos Pinhão Ramalheira - carlos.ramalheira@gmail.com
Serviço de Medicina, Hospital Professor Doutor Fernando da Fonseca IC 19, 2720-276 Amadora, Portugal
Received / Recebido: 15/02/2020
Accepted / Aceite: 14/04/2020
Publicado / Published: 27 de Junho de 2020

