


Serviços Personalizados
Journal
Artigo
 Inglês (pdf)
 Artigo em XML
 Referências do artigo
 Enviar este artigo por email
Indicadores
-
 Citado por SciELO
 -
 Acessos
Links relacionados
-
 Similares em
SciELO
Similares em
SciELO
Compartilhar

 Permalink
Portugaliae Electrochimica Acta
versão impressa ISSN 0872-1904
Port. Electrochim. Acta vol.38 no.6 Coimbra set. 2020
https://doi.org/10.4152/pea.202006365
ARTIGOS
Kinetic Study of the Metal Ions Doped TiO2 Samples for the Photocatalytic Degradation of E 131 VF
C. Estephanea, M. M. Kassirband M. M. El Jamala,*
a Faculty of Sciences (I), Chemistry Department, Lebanese University, Rafic Hariri Campus. El Hadath, Lebanon
b PhD School of Sciences and Technologies (PRASE), Lebanese University, Campus Rafic Hariri, Beyrouth, Lebanon
ABSTRACT
The present work is focused on the influence of the metal salts on the photocatalytic efficiency of TiO2 for the elimination of E 131 VF food colorant. Two series of TiO2 photocatalysts loaded with Fe(II) and Cu(II) were prepared by using the wet impregnation method. The samples were characterized by XRD, IR, Raman and scanning electron microscopy. The degradation of the food colorant was followed by the measurement of the absorbance. The kinetics of degradation fitted well to the zero pseudo order with Cu-TiO2, but it followed the 1st order with Fe-TiO2. In general, the photoactivity of TiO2 was reduced by the presence of the transition metal ions, even at low molar ratio %. The recalcination of the doped samples at higher temperatures reduced more the degradation activity. Several reasons were suggested to explain the dramatic decrease in the activity of the prepared samples.
Keywords: Cu(II) and Fe(II) doped TiO2, photocatalysis, kinetic and E 131 VF.
Introduction
Food products may lead to numerous problems for human health, because they contain a number of harmful organic compounds. A number of studies have focused on the use of additives and their influence on humans and on the environment [1, 2]. The E102 (yellow), E 123 (red), E131 and E 133 (blue) food colorants find large applications in food industry. The European Union placed regulations on labeling food dyes to inform consumers on the health risks.
An environmental regulation applied in most countries requires the discoloring of industrial wastewater prior to its discharge. A number of techniques of dyed wastewater purification based on biodegradation [3], electrochemical treatment [4, 5], adsorption [6] and advanced oxidation [7, 8] were suggested as a solution to remediate this problem. Other studies have been devoted to the use of photocatalysis in the removal of dyes from wastewaters, particularly, because of the ability of this method to completely mineralize the target pollutants [9-11].
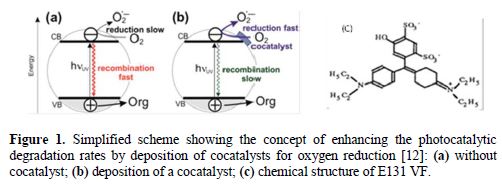
Photocatalytic reactions are activated by the absorption of radiation with sufficient energy (equal or higher than the band-gap energy of the catalyst). The absorption promotes an electron (e−) from the valence band (VB) of the photocatalyst (TiO2, ZnO, CdS) to the conduction band (CB), thus generating a hole (h+) in the valence band (Fig. 1). TiO2 has been found to be the most suitable because of its nontoxic, insoluble, and highly reactive nature. It exists in four mineral forms.
Anatase-type TiO2 has a crystalline structure that corresponds to the tetragonal system (with dipyramidal habit) and is used mainly as a photocatalyst. Rutile-type TiO2 is mainly used as white pigment in paint. TiO2 has other applications in various products such as sunscreen lotions, capacitors, solar cells and even as a food coloring agent.
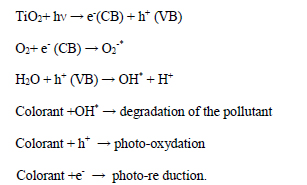
The photogenerated electrons could reduce the colorant or react with electron acceptors such as O2 adsorbed onto the Ti(III)-surface or dissolved in water, reducing it to O2−* superoxide radical anion [13]. The photogenerated holes can oxidize the organic molecule, or react with OH− or H2O, oxidizing them into OH* radicals (see the equations below). The efficiency of photo-catalytic reactions is limited by the high recombination rate of photoinduced e- - h+ pairs formed in photocatalytic processes; for this reason, the recombination of the electron and the hole should be prevented. The reactions at the semiconductor surface causing the degradation of the colorant can be expressed as follows [13]:
Many attempts have been made to improve the photocatalytic efficiency of TiO2, such as doping metal via impregnation or sol-gel method: Cu(II)[14], Zn (II) [15], Pt (II)[16], Ag (I)[17-18], Fe(III) [19]. Fig. 1b shows how the deposition of small amounts of metal onto TiO2 leads to enhanced photocatalytic efficiencies for pollutant degradation. Other researchers tried the deposition of a monolayer of polyaniline on the surface of TiO2 [20, 21] to increase the photoactivity of TiO2 or to make it photoactive to visible radiation.
The effects of metal ions have been studied on the photodegradation of organic pollutants [22-25]. Some studies have suggested that the enhancement of the photocatalytic degradation rates was due to electron trapping by the metal ions, leading to the prevention of electron-hole recombination [25].
However, high concentrations of metal may have a detrimental effect on the photoactivity of TiO2 [26]. The nature of the metal and the dopant concentration that give the best efficiency are function of the pollutant to be removed [27]. In contrast, some studies showed that the presence of some metals such as Fe(III), Co(II) and Cr(III) decreases the degradation rate constant of TiO2 [28]. The author explained the dramatic decrease by a progressive loss of total crystallinity, partial transition from anatase into rutile and, in the case of Co(II), formation of the titanate mixed oxide cobalt. The various experimental conditions for sample preparation affect the photoactivity of TiO2 [15, 26, 29, 30]. Then, to access the influence of transition metals on photocatalysis, experiments are necessary to point out the effect.
A recent study in our laboratory showed that the Polyaniline (Pani) polymer and Pani/TiO2 work as adsorbants of E 131 VF and that the deposition of Pani on TiO2 stops totally or partially the photoacatalytic activity of TiO2, whatever is the molar weight % of Pani (0.5 to 3 %) [31]. In this work, we tried to improve the photoactivity of TiO2 towards the degradation of E 131 VF, by doping it with Cu(II) and Fe(II).
Experimental
Samples preparation
Commercially available TiO2 (P25) from Degussa (Sigma Aldrich, Germany) consists of 80% anatase and 20% rutile, with a specific BET surface area of 50 m2 g-1 and primary particle size of 21 nm. E131VF food colorant was used as purchased from Sigma Aldrich (C27H31N2O6S2-Na, purity: 50 %, MW:565.67 g). The impregnation method was selected to deposit the metal according to the procedure in ref. 17. Several masses of Cu(NO3)2 3H2O (BDH, GPR) were added each time to 2 g of TiO2 (25x10-3 mole), in order to have samples with 0.4 % (0.0244g of Cu(II) salt), 0.8 %, 1 %, 1.2 % and 1.6 % mole ratio of Cu(II)/TiO2. Then, 100 mL of distilled water were added to each sample and stirred with a magnetic stirrer for 8 h, at room temperature. The solutions were allowed to stand at room temperature for 12 h and were dried at 100 oC for another 12 h. After that, the dried samples were ground in a mortar and calcined at 300 oC for 4 h. Part of these samples were calcined at 400 and 500 oC, to study the effect of the calcination temperature on the rate constant. In this impregnation method, the metal ion gets deposited on the surface of TiO2 [17]. Another series was prepared with FeSO4 7 H2O. 2 g of TiO2 followed the same steps without addition of a metal ion, in order to compare it with the doped catalyst. XRD, IR, Raman and SEM were used to characterize the prepared samples and the bare TiO2. A stock solution of E 131 VF was prepared by dissolving 40 mg in one liter of distilled water. The concentration of the dye in the experiment was selected in such a way that the absorbance of the dye followed Beer’s law. The x% Cu-TiO2 abbreviation was adapted to name the prepared catalysts without precising the oxidation degree of the cupper after treatment.
Photocatalytic tests
The degradation rate of the food colorant was followed by measurement of the absorbance at the maximum wave length of E 131 VF (640 nm) with time. UV-visible spectra were recorded on a double beam UV-visible spectrophotometer.
Prior to commencing illumination, a suspension containing 0.08 g of the catalyst and 100 mL of an aqueous solution of E 131 VF was stirred continuously at least for 15 min in the dark; then, the sample was irradiated under magnetic stirring by two UVB lamps (λmax: 320 nm) positioned at 10 cm above the glass bowl (Luzchem LZC-4V, Canada). To quantify the decrease in the concentration, a sample of 3 mL was taken (with a pipette) at predetermined intervals of time and centrifuged at 4000 rpm for 10 min.
Samples characterization
The X-ray diffraction pattern was recorded on a D8 Focus, Bruker, X-ray diffractometer operating at 50 kV, using Cu-Kα radiation (λ= 1.541 Ao). The measurement was performed over a diffraction angle range of 2θ = 5°–80°. Fourier transform infrared (FTIR) spectroscopy for the samples was recorded on a Jasco FT/IR- 6300 spectrometer in the wavelength range from 400 to 4000 cm–1. The FTIR study was performed by using a KBr pellet.
Raman spectra were recorded on Horiba Scientific, operating with green laser at 532 nm. Scanning electron microscopy (SEM) images were taken with Ametek materials analysis division (AIS 2300C series) instrument (working distance: 25 mm, 20 kV voltage).
Results and discussion
Characterization of the doped TiO2 samples
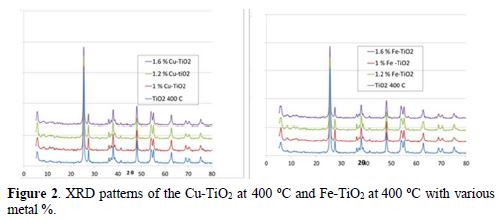
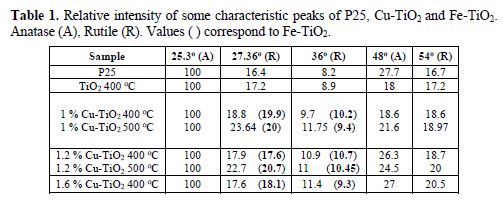
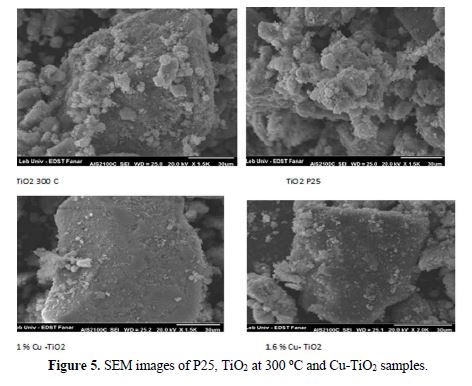
The 0.4 % Cu-TiO2 powder is slight blue and the 0.4 % Fe-TiO2 is slight yellow. The color of the samples becomes deeper with the increase in metal %. The TiO2 treated at 300 oC remained white. The doped samples and the treated TiO2 did not have the same granulometry size as the untreated one (P25). There was agglomeration of tiny particles. The XRD patterns of TiO2 and doped TiO2 treated at 400 oC are shown in Fig. 2 as a function of 2θ. It shows five primary peaks at 25.3o (100), 38o (20 %), 48.2o (28 %) and 62.5o (10 %), which can be attributed to different planes of pure anatase [32, 33]. Other peaks at 27.36o (100%), 36o (45%), 54o (53 %) and 69o (8 %) can be attributed to pure rutile form of TiO2 [29, 34]. The XRD patterns of the Cu-TiO2 and Fe-TiO2 samples almost coincide with that of the bare TiO2(P25) or TiO2 treated at 400oC, showing no new diffraction peaks due to iron or to cupper doping, which suggests that the small metal ions amount are placed on the surface of the crystals (Fig. 2a and 2b) [32]. The % of several peaks of the different samples is shown in table 1. The peaks at 36o and 54o, characteristic of rutile form, increase little with the increase in Cu % (or Fe %) [28]. The slight increase in these two peaks may be due to a slight transformation from anatase to rutile phase, when calcined at 400 and 500 oC (table 1) [12].
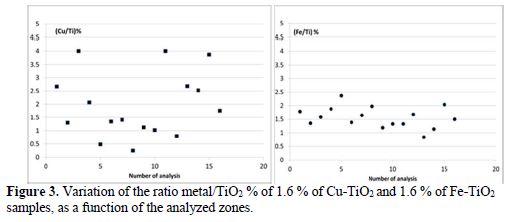
The EDX was done to confirm the presence of Fe and Cu particles. The EDX spectra of 1.6 % Cu- TiO2, 1.6 % Fe-TiO2 and TiO2 treated at 400 oC were recorded in the binding energy region of 0 – 8 keV. The EDX spectrum of P25 and TiO2 treated at 400 oC reveals the presence of several peaks characteristic of Ti. The intense peak at 4.51 keV is assigned to the bulk TiO2 [30]. The new peak at 0.8 keV in the EDX spectrum of 1.6 Cu-TiO2 confirms the existence of Cu atoms in the TiO2 matrix [34] (Figure not shown). Also, the new peak in the EDX spectrum of the Fe- TiO2 sample reveals the presence of Fe atoms. Sixteen zones of each sample were analyzed; the corresponding atomic ratio Cu/TiO2 % varied from 0.5 to 4, which reveals the inhomogeneity in the distribution of Cu at the surface of TiO2. However, the ratio of Fe/TiO2 % varied between 0.8 and 2, which means a uniform distribution of iron on TiO2 (Fig. 3). Fig. 4a shows the FTIR spectrum of TiO2 and Cu(II) –TiO2. The TiO2 spectrum shows three bands: a broad and intense one at 3420 cm-1; and the two other bands at 1620 cm-1 and 620 cm-1. The peaks of TiO2 observed at 476 cm-1 and 620 cm-1 are assigned to the vibrations of Ti–O and Ti–O–Ti framework bonds of TiO2 [36]. The zoom in the region between 400 cm-1 and 600 cm-1 does not show any characteristic peak of CuO (432.3 cm-1, 497 cm-1 and 603 cm-1) [37].
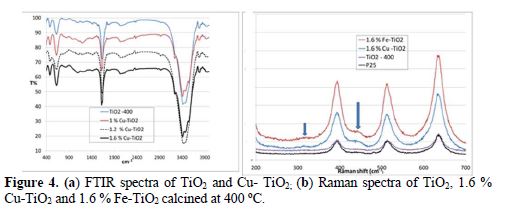
The broad peaks at 3420 cm-1 and 1620 cm-1 are characteristic of the H–O bending mode of hydroxyl groups present on the surface of the catalyst, due to moisture. These are crucial to the photocatalytic reactions, since they can react with photoexcited holes generated on the catalyst surface and produce hydroxyl radicals, which are a powerful oxidant. As the added amount of the metal salts was small, no new band and no shift is observed in the bands of the bare TiO2 after doping. In the Raman spectrum of P25, the peaks centered at 141 cm−1 (highest peak), 396 cm−1, 514 cm−1 and 636 cm−1 are attributed to the anatase phase, while the peaks, located at 235 cm−1 , 443 cm−1 and 608 cm−1, are characteristic of the rutile phase [35, 38]. The Raman spectrum of P25 and of TiO2 treated at 400 oC consisted of characteristic peaks of anatase (Fig. 4b).
The Raman spectra of the 1.6 % Cu-TiO2 and 1.6 % Fe-TiO2 are similar to that of P25 and TiO2 at 400oC (Fig. 4b). A very slight shift (1.3 cm-1) was observed at 140.71 cm-1, after doping with 1.6 %. Higher shift was observed with higher Cu % [39]. Also, we observed a new broad peak at 315 cm−1 and 441 cm-1, which corresponds to the rutile phase. The introduction of Cu (II) and Fe(II) favors the partial transformation of anatase into rutile. As in the case of XRD, the presence of copper oxide or ferric oxides could not be detected by Raman spectroscopy [24, 30, 35, 39, 40]. The non-detection of the corresponding metallic oxides by these techniques (Raman, XRD, and IR) does not mean their absence, due to the small added amount. SEM was used for the direct observation of particle size and morphology of sample powders. Fig. 5 shows the images of 1% Cu-doped TiO2 nanoparticles. The particles became bigger after treatment at 300 oC, due to agglomeration.
Photocatalytic activity of Fe(II) doped TiO2
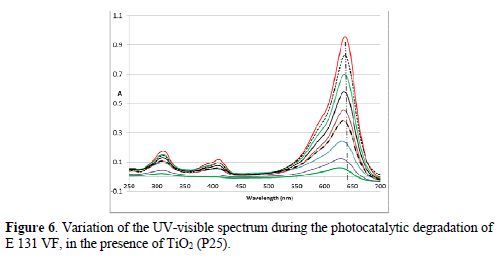
The absorbance of the food colorant solution in the presence of the TiO2 photocatalyst, at 640 nm after stirring in the dark for 20 min (and even for more longtime), decreased less (< 6 %). So, the adsorption of the colorant is negligible. In the absence of the photocatalyst, A640 decreased ~ 10 % after irradiation under UV for 30 min (13 % after 2h, 20 % after 4 h). The combination of the UV irradiation and the catalyst led to a fast decrease in A640 and, consequently, to a fast degradation of E 131 VF. As the adsorption is negligible, we can say that the degradation of the colorant does not occur at the surface of TiO2, but in the zone around the particles of the photocatalyst (by interaction with the different produced radicals). There is a decrease in the whole spectrum during the experiment; Amax of E131 VF showed a slight hypsochromic shift during the photodegradation (Fig. 6). No new absorption bands appeared in the UV-V as spectra of the colorant. This result is in accordance with that obtained by Chen [9]. Chen, in this article, suggests a mechanism showing total mineralization of the dye.
The kinetic study of the degradation of E 131 VF at TiO2 follows perfectly the pseudo first order (Fig. 7). Similar result was obtained by Baraka [41]. The Fe(II) impregnated TiO2 follows also 1st order. The rate constant obtained with low % of Fe(II) is a little higher than the undoped TiO2; then, the rate constant decreased with the increase in Fe(II) molar ratio % (table 2). A similar decrease in the rate constant was observed by Bouras et al. [28] and Paola et al. [22]. Bouras et al. explained the decrease in a progressive loss of cristallinity and some transformation of anatase into rutile, whereas Paola et al. explained that decrease by the increase in the recombination rate e--hole.
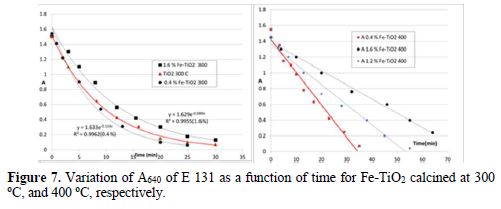
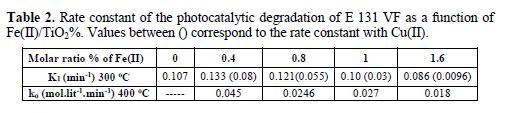
The recalcination of the same Fe(II) doped samples at 400 oC showed a change in the kinetic model. The absorbance decreases linearly with time (pseudo zero order), but remained 1st order after treatment and calcination of P25 at 400 oC. The total degradation took more time than at 300 oC. Neubert suggested that the treatment above 200 oC was strongly detrimental to photocatalytic activity of TiO2 [12]. Bouras et al. explained the decrease in the photoactivity of TiO2 by transformation of anatase into rutile phase and by progressive loss of crystallinity [28].
Photocatalytic activity of Cu(II) doped TiO2
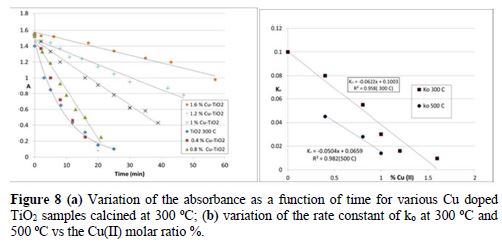
The kinetic study of the Cu(II) doped TiO2 treated at 300 oC shows that the absorbance of all the samples decreases linearly with time (Fig. 8a). So, the kinetic order follows pseudo zero order, in contrast to the order obtained with TiO2 calcined at 300 and 400 oC (1st order). The rate constant of the photodegradation of E 131 VF on Cu(II) doped TiO2 decreases linearly with the increase in Cu(II) molar ratio (Fig. 6b). A decrease in the photoactivity of Cu-TiO2 with Cu% higher than 0.4 % was also observed by Xin et al. [14]. The recalcination of the same doped samples at 400 oC and 500 oC did not change the kinetic model, as it was the case with the Fe(II) doped samples. The rate constant of Cu(II) doped TiO2 calcined at 300 oC or at higher temperatures decreases linearly with the increase in Cu (II) amount (Fig. 8b). Also for 0.4 % of Cu (II), the rate constant decreased with the increase in calcination temperature.
By comparison between Cu(II)-TiO2 and Fe(II)- TiO2 we observed that the decrease in the photoactivity of TiO2 in the presence of Cu(II) is more severe than that in the presence of Fe(II) (table 3). There is not only one reason to explain the decrease in the activity of TiO2 after doping; there are rather many causes which lead to this decrease: 1) metal-TiO2 particles tend to agglomerate and become heavier; so, the particles of these catalysts are not well distributed in the liquid solution, as it was the case with P25. The surface area available for photon absorption would be reduced; 2) the recombination of photogenerated electrons and holes is one of the most significant factors that influence the photoactivity of the samples. Paola et al. [22] showed that metal loading increases the rate constants of e--h+ recombination and furtherly increases along with the amount of transition metal; 3) the increase in the temperature of calcination may lower the anatase/rutile ratio. Powders with more rutile could be less active [28, 29]; 4) the surface oxygen vacancy concentration of anatase excessive oxygen vacancies and Cu species can become the recombination centers of photoinduced electrons and holes [14].

Conclusions
The degradation of the E 131 VF food colorant follows the pseudo first order model on TiO2 and on Fe(II)-TiO2 treated at 300 oC. However, it follows the pseudo zero order at Cu-TiO2, and grains are increased with the increase in metal dopant content, in the case of the Fe-TiO2 treated at 400 oC. The XRD, Raman and FTIR techniques, which are bulk techniques, are unable to prove the presence of a small amount of copper and iron on the surface of TiO2, but the EDX analysis confirms their presence. Doping TiO2 with Fe(II) or Cu(II) ions by impregnation has a detrimental effect on the photocatalytic activity of TiO2, and this effect is more severe at higher calcination temperatures and in the presence of Cu(II). To overcome the aggregation problem, we suggest to prepare the M/TiO2 via solvothermal or sol-gel method.
References
- Fonovich TM. Drug Chem Toxicol. 2013; 36 (3): 343-352.
- Inetianbor JE, Yakubu JM, Ezeonn SC. Asian J Sci Technol. 2015; 6(2):1118.
- Banat IM, Nigam P, Singh D, et al. Bioresour Technol. 1996; 58 (3): 217.
- El-Ashtoukhy E-S Z, Amin NK, et al. Int J Electrochem Sci. 2012; 7: 11137- 11148.
- Ayoub ZA, El Jamal MM. Port Electrochim Acta. 2017; 35(2): 81-90.
- Bangash FK, Alam S. Braz J Chem Eng. 2009; 26 (2): 275-285.
- Gosetti F, Gennaro MC, et al. J. Chromatogr A. 2004; 1054(1-2): 379-387.
- NaserElddine HA, Damaj ZK, Yazbeck OA, et al. Port Electrochim Acta. 2015; 33(5): 275-288.
- Chen C-C, Fan H-J, Jan J-L. J Phys Chem C. 2008; 112(31): 11962-11972.
- Diao Z-H, Xu X-R et al. Sep Purif Technol. 2015; 154: 168-175.
- Saquib M, Abu Tariq M, Faisal M, et al. Desalination. 2008;219(1-3):301-311.
- Neubert S, Mitoraj D, Shevlin SA, et al. J Mater Chem A. 2016;4:3127-3138.
- Akpan UG, Hameed BH. J Haz Mat. 2009; 170 (2-3): 520-529.
- Xin B, Wang P, Ding D, et al. Appl Surf Sci. 2008; 254: 2569-2574.
- Liao DL, Badour CA, Liao BQ. J Photochem Photobiol A: Chem. 2008; 194:11-19.
- Sakthivel S, Shankar MV, Palanichamy M, et al. Water Res. 2004; 38 (13): 3001-3008.
- Gupta AK, Pal A, Sahoo C. Dyes Pigm. 2006; 69 (3): 224-232.
- Liu R, Wang P, Wang X, et al. Phys Chem C. 2012; 116 (33):17721- 17728.
- Mahmoud GEA, Ismail LFM. J. Am Sci. 2012; 8(10): 83-99.
- Zhang H, Zong R, Zhao J, et al. J Environ Sci Technol. 2008; 42:3803-3807.
- Elsayed MA, Gobara M. Mater Res Express. 2016; 3 : 1.
- Paola AD, Marci G, Palmisano L, et al. J Phys Chem B. 2002;106 (3):637-645.
- Paola AD, Garcia-Lopez E, Ikeda S, et al. Catal Today. 2002;75(1-4):87-93.
- Tayade RJ, Kulkarni RG, Jarsra RV. Ind Eng Chem Res. 2006;45(15):5231-5238.
- Bideau M, Claudel B, Faure L, et al. Chem Eng Comm. 1990;93(1):167-179.
- Rao KVS, Lavédrine B, Boule P. J Photochem Photobiol A: Chem. 2003; 154: 189.
- Riaz N, Bustam MAB. Iron doped TiO2 photocatalysts for environmental applications: fundamentals and progress. Proceedings of the 2013 International Conference on Biology and Biomedicine. 2013.
- Bouras P, Stathatos E, Lianos P. Appl Catal B: Environm. 2007;73(1-2):51-59.
- Behnajady MA, Modirshahla N, Shokri M, et al. Global NEST J. 2008; 10,1: 1-7.
- Abd El-Rady AA, Abd El-Sadek MS, El-Sayed Breky MM, et al. Adv Nanoparticles. 2013; 2(4): 372-377.
- El Zein Z. MR2 inorganic. In : Faculty of Sciences, Lebanese Univ. Dégradation du colorant alimentaire E 131 VF par le procédé photocatalytique. 2017.
- Lu SC, et al. IOP Conf Ser : Mater Sci Eng. 2016; 107:12012.
- Anku W W, Osei-Bonsu S, Oppong, et al. Acta Chim Slov. 2016; 63: 380-391.
- Ijadpanah-Saravy H, Safari M, Khodadadi-Darban A, et al. Anal Lett. 2014; 47(10): 1772-1782.
- Tasbihi M, Koci K, Troppova I, et al. Env Sci Pollut Res. 2017: 1-9.
- Elsalamony R, Abd El-Hafiz D. Chem Mater Res. 2014; 6 (4):122-134.
- Ethiraj AS, Kang DJ. Nanoscale Res Lett. 2012, 7(1):70.
- Lagopati N, Tsilibary E-P, Falaras P, et al. Int J Nanomed. 2014; 9(1): 3219-3230.
- Choudhury B, Dey M, Choudhury A. Int Nano Lett. 2013; 3:25
- Nguyen VN, et al. Adv Nat Sci Nanosci Nanotechnol. 2011; 2: 035014
- Barka N, Qourzal S, Assabbane A, et al. Arab J Sci Eng. 2010; 35 (2A): 133.
Received June 7, 2018 ; accepted August 15, 2020
* Corresponding author. E-mail address: mjamal@ul.edu.lb
Acknowledgments
The author thanks the Lebanese University for providing financial assistance to carry out this work.

