


Services on Demand
Journal
Article
 English (pdf)
 Article in xml format
 Article references
 Send this article by e-mail
Indicators
-
 Cited by SciELO
 -
 Access statistics
Related links
-
 Similars in
SciELO
Similars in
SciELO
Share

 Permalink
Portugaliae Electrochimica Acta
Print version ISSN 0872-1904
Port. Electrochim. Acta vol.38 no.3 Coimbra June 2020
https://doi.org/10.4152/pea.202003165
ARTIGOS
Simulation of Irreversible Electro-oxidation on a Partially Blocked Electrode
Milivoj Lovric* and Šebojka Komorsky-Lovric
Divkoviceva 13, HR 10090 Zagreb, Croatia
ABSTRACT
An irreversible electrode reaction influenced by the reversible potential dependent inhibition is theoretically analysed. The consequence of reactivation of the electrode surface is the continuation of electro-oxidation and the appearance of the second anodic peak in cyclic voltammetry. An indicator of the change of the electrode kinetics caused by the inhibitor is proposed.
Keywords: electrode reactivation, inhibition, partially blocked electrode, simulation.
Introduction
Partially blocked electrodes and arrays of microelectrodes may operate under similar diffusion conditions. The mass transport towards an array of microelectrodes on the stationary platform depends on the geometry of electrodes and the distance between them [1 - 5]. The material lying above the insulating part of the platform is diffusing towards the edge of the microelectrode, and thus contributes to the flux. Hence, the diffusion layers of individual electrodes overlap, and the response of the array changes from the sum of responses of the microelectrodes to the response of the planar macroelectrode [2, 6-8]. The arrays of microelectrodes are suitable for use in highly resistive media [9], and for the kinetic measurements using high scan rates [10-11]. Furthermore, they are employed in sensors [5] and in electrosynthesis [12]. Also, they may appear as electrodes modified with catalytically reactive microdroplets of liquid which is not miscible with water [13-14]. Particularly, the electrodes that are inactivated by the adsorption of the inhibitor of a certain electrode reaction are interesting [15 - 17]. To the first approximation, a partially blocked electrode can be considered as an array of inert disks on an electroactive surface [18-19]. A special case of blocked electrodes appears in the electro-oxidation of methanol [20 - 30] and ethanol [31 - 35]. These irreversible electrode reactions are hindered by the adsorption of carbon monoxide [21, 30]. In cyclic voltammetry, the inhibitor is adsorbed in the anodic branch and desorbed in the cathodic one. So, the electrode is firstly inactivated and then reactivated. The consequence is an anomalous cyclic voltammogram consisting of anodic peaks in both branches. In this short communication, the simplest model of the influence of partial and complete deactivation and reactivation of the electrode surface in staircase cyclic voltammetry of an irreversible electrode reaction is developed. The purpose of the work is to investigate the influence of the electrode kinetics on the second anodic peak current.
Model
A totally irreversible electro-oxidation of the dissolved reactant giving a dissolved product is considered:

It is imagined that the inactivation and reactivation of the electrode surface are caused by unknown processes that depend on the electrode potential. The ratio of active area and total geometric area of the electrode surface may be changed from one to zero:

For the stationary, planar diffusion, the simplest model is based on the assumption that the electrode surface is covered by equally wide strips of the inhibitor that are separated by equally wide strips of the active area. The edges of the electrode are neglected. The motive that is repeated starts at the middle of the inhibitor strip and finishes at the middle of the active strip. It is shown in Scheme 1.
For the purpose of simulation, the motive is divided in twenty increments. The width of the inhibitor can be changed from zero to 20. It is assumed that the inhibitor prevents the transfer of electrons from the reactant to the electrode. Under these conditions, the reaction (1) can be described by the following differential equation and boundary conditions:
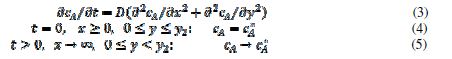
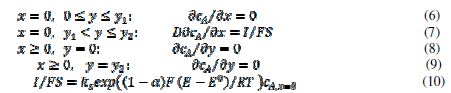
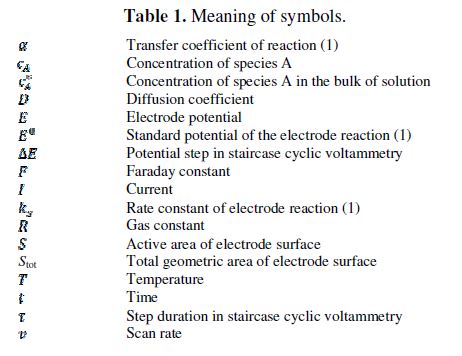
The meanings of the symbols are listed in table 1. Equation (3) was solved by the digital simulation method [36]. In chronoamperometry, the dimensionless current density,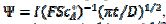 , and the average dimensionless current density,
 , are calculated as functions of the active area of the electrode surface. The current depends on the dimensionless rate constant
  . In cyclic voltammetry, the average dimensionless current density is defined as
  , and the dimensionless rate constant is
  .
.
Results and discussion
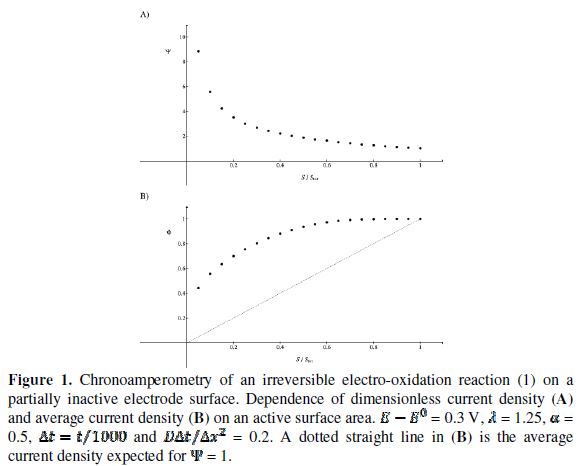
The relationship between the dimensionless current density and the relative area of the active electrode surface is shown in Fig. 1A. The corresponding average current density is shown in Fig. 1B. The density decreases with the increasing active area and tends to be 1 for  . As consequence, the average density is bigger than 0.99, if
  0.7. This means that the influence of the inhibitor is negligible if it covers less than 30% of the geometric area of the electrode surface. Moreover, on a heavily blocked surface, on which only 5% of the geometric area remains active, the current density increases to 8.83, and the average density decreases only to 0.44, comparing to 0.05 that is expected from the linear relationship between
  and
and  .
.
These phenomena are explained in Fig. 2 that shows the concentration profiles at the potential at which the electrode reaction (1) is diffusion controlled. The profiles are calculated for  = 0.25. This means that
  = 15. Firstly, one can notice that the diffusion layer extends over the blocked surface and that the concentration gradient is the highest on the edge of the active area (
 = 16) and decreases towards the middle of the active area ( = 20). So, the real current density is not uniform over the active area. Looking at Fig. 1, it can be seen that
  = 3.02 and = 0.75 for = 0.25. At the edge of the block (= 15), a strong lateral flux decreases with the increasing distance from the electrode surface. This flux tends to zero at the middle of the block ( y = 0). These results show that, on a partially blocked electrode, there is no linear relationship between the average current density and the active surface area, and that the influence of the inhibitor cannot be neglected if it covers more than 50% of the geometric surface area.
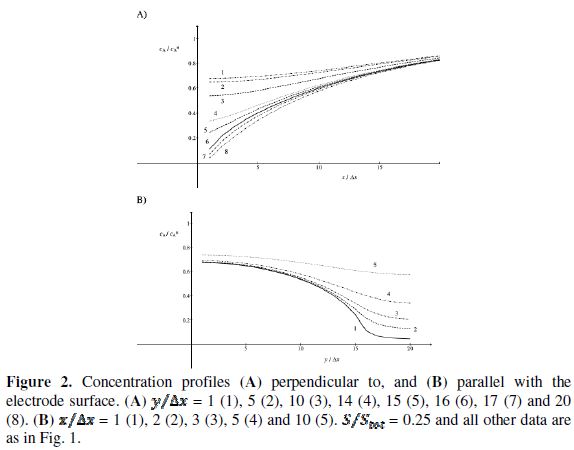
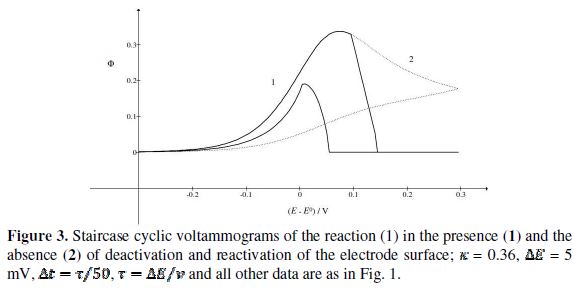
Fig. 3 shows cyclic voltammograms of the reaction (1). If there is no inactivation of the electrode surface (curve 2), the dimensionless peak current and peak potential are  = 0.338 and
  = 0.075 V, respectively. Under the influence of deactivation and reactivation of the electrode surface (curve 1), another anodic peak appears in the reverse, cathodic branch of the voltammogram. Its peak current and potential are
  = 0.191 and
  = 0.010 V. This response was calculated under the assumption that, in the anodic branch, the active area is equal to the geometric area (
 ) if -0.3 /V < 0.1, and that it decreases linearly with the electrode potential between 0.1 V and 0.145 V (
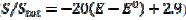 ). At the higher potentials, the electrode surface is totally blocked (A = 0). In the cathodic branch, the surface remains totally blocked between 0.3 V and 0.055 V, and then the relative active area increases linearly with the potential from 0.055 V to 0.005 V vs. (
 ). At lower potentials, the electrode surface is fully active. In the anodic branch, the voltammogram is not influenced by the inhibitor at potentials lower than 0.1 V vs. (
  = 0.338 and
  = 0.075 V), but then the current quickly decreases to zero because of the electrode inactivation. In the reverse branch, the current reappears as the consequence of reactivation of the electrode surface. Once the current is diminished to zero, the reactant concentration at the electrode surface increases until the electrode is reactivated. For this reason, the second anodic peak current is higher than the current at the second peak potential, in the absence of deactivation [37]. However, the second peak current is smaller than the current of the anodic branch at the same potential (
 ). This is because the initial conditions are not re-established during the electrode deactivation.
In many experiments, it was observed that the second peak current is not much lower than the first peak current. This can be explained by the change of kinetics of the electrode reaction after the reactivation of the electrode surface. Possible examples are shown in Fig. 4. These voltammograms were calculated by assuming that there are two kinetic parameters: , that applies to the anodic branch and
  , applying to the cathodic branch. We are proposing the ratio of the second peak current to the current at the same potential in the anodic branch as the characteristic function of the ratio of and kinetic parameters. The voltammogram 1 in Fig. 3 was calculated for = and the characteristic ratio is
  = 0.77. In Fig. 4, the values of this ratio are:
  = 0.49, 1.13 and 1.56 for k2/k1= 0.5, 2 and 5, respectively. These two ratios are connected by the following linear relationship:
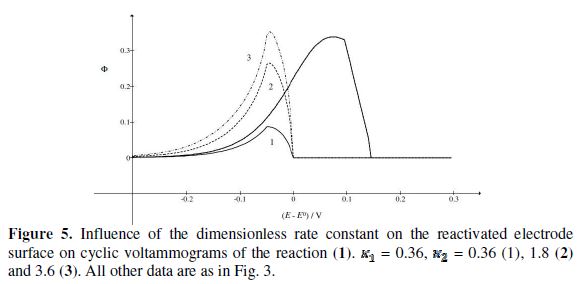
  = 1.13 log(k2/k1) + 0.77. The slope of this straight line depends on the difference between the potentials of the first and the second peak, but the intercept is independent of this difference. This is shown in Fig. 5. The voltammograms that are reported in this figure were calculated for the relationship
  . This means that the electrode is reactivated between 0 V and -0.050 V vs.
  . The potentials of the first and the second peak are 0.075 V and -0.050 V vs. , respectively, and the difference between them is 125 mV. The characteristic ratios of the curves in Fig. 5 are as follows:
  = 0.77, 2.19 and 2.92 for k2/k1= 1, 5 and 10, respectively. They satisfy the relationship:
  = 2.02 log(k2/k1) + 0.77. Similar calculations were performed by using several values of the difference
  , and the following relationship was found:

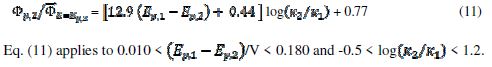
In the electro-oxidation of methanol on a platinum electrode, the difference  =0.150 V and the ratio
  3 were observed [20]. Using the theoretical relationship between these variables, the ratio k2/k1=8.7 can be calculated. Also, in the electro-oxidation of ethanol catalysed by palladium, the cyclic voltammogram is characterised by
  = 0.130 V and
  =2.2, which corresponds to the ratio k2/k1=4.7 [31]. Considering some other data published for methanol [22-23] and ethanol [32], an average ratio k2/k1=2.5 ± 0.5 was calculated. These show that the proposed indicator can be used for the estimation of an increased activity of the catalyst after the reactivation in the electro-oxidation of methanol [29-30], ethanol [35], glycerol [38] and formic acid [39].
Conclusions
The proposed model takes in consideration the edge effects on a partially blocked electrode and the change of concentration profiles during the complete blockade. So, it is proper to describe an irreversible electro-oxidation that is complicated by the potential dependent inactivation and reactivation of the electrode surface. The model predicts that the second anodic peak that appears in the reverse, cathodic branch of cyclic voltammogram depends on the kinetics of the electrode reaction after the reactivation of the surface. A ratio between the second peak current and the current at the same potential in the anodic branch is proposed as an indicator of the difference in electrode kinetics, before and after the inactivation. This ratio is independent of the scan rate. If the kinetic parameter does not change, the ratio is equal to 0.77 and does not depend on the difference between the potentials of the first and second peaks. Generally, this ratio is a linear function of the logarithm of the ratio between rate constants on the initial and the reactivated electrode surface. The model is formal and does not consider the actual mechanism of the inhibition of the electrode reaction.
References
- Szunerits S, Thouin L. Microelectrode array. In: Zoski CG (ed) Handbook of electrochemistry, Elsevier, Amsterdam, p. 391; 2007.
- Szabo A, Zwanzig R. Chronoamperometric current at a random ensemble of microdisk electrodes. J Electroanal Chem. 1991; 314: 307 -311.
- Zoski CG, Wijesinghe M. Electrochemistry at ultramicroelectrode arrays and nanoelectrode ensembles of macro- and ultramicroelectrode dimensions. Isr J Chem. 2010; 50:347-359.
- Arrigan DWM. Nanoelectrodes, nanoelectrode arrays and their application. Analyst. 2004;129:1157-1165.
- Bard AJ. Integrated chemical systems. Wiley, New York. 1994.
- Wadhawan JD, Welford PJ, Yunus K, et al. Voltammetry at micro-mesh electrodes. J Braz Chem Soc. 2003;14:510-516.
- Amatore C, Fosset B. Equivalence between microelectrodes of different shapes: between myth and reality. Anal Chem. 1996;68:4377-4388.
- Feeney R, Kounaves SP. Microfabricated ultramicroelectrode arrays: development, advances and applications in environmental analysis. Electroanalysis. 2000;12:677-684.
- Bond AM, Pfund VB. Cyclic voltammetry at gold, platinum and carbon microelectrodes in ice without added supporting electrolyte. Evidence for liquid microphases at temperatures well below the freezing point of water. J Electroanal Chem. 1992;335:281-295.
- Amatore C, Bonhomme F, Bruneel JL, et al. Mapping dynamic concentration profiles with micrometric resolution near an active microscopic surface by confocal resonance Raman microscopy. Application to diffusion near ultramicroelectrodes: first direct evidence for a comproportionation reaction. J Electroanal Chem. 2000;484:1-17.
- Komorsky-Lovric Š, Lovric M, Bond AM. Square-wave voltammetry at spherical and disk microelectrodes as a function of electrode radius and frequency. Electroanalysis. 1993;5:29-40.
- Belmont C, Girault HH. Coplanar interdigitated band electrodes for electrosynthesis – Part 3: epoxidation of propylene. Electrochim Acta. 1995;40:2505-2510.
- Davies TJ, Brookes BA, Compton RG. A computational and experimental study of the cyclic voltammetry response of partially blocked electrodes. Part III: interfacial liquid-liquid kinetics of aqueous vitamin B12 with random arrays of femtolitre microdroplets of dibromocyclohexane. J Electroanal Chem. 2004;566:193-216.
- Lovric M, Komorsky-Lovric Š, Compton RG. Electrodes covered with random arrays of microdroplets: heterogeneous electron transfer coupled to catalytic reaction at the liquid/liquid interface in the prism film geometry approximation. Electrochim Acta. 2005;50:1377-1381.
- Chevallier FG, Davies TJ, Klymenko OV, et al. Numerical simulation of partially blocked electrodes under cyclic voltammetry conditions: influence of the block unit geometry on the global electrochemical properties, J Electroanal Chem. 2005;577:211-221.
- Deslouis C, Gabrielli C, Keddam M, et al. Impedance techniques at partially blocked electrodes by scale deposition. Electrochim Acta. 1997;42:1219-1233.
- Myland JC, Oldham KB. The electrochemistry of electrodes edges and its relevance to partially blocked voltammetric electrodes. J Solid State Electrochem. 2009;13:521-535.
- Compton RG, Laborda E, Ward KR. Understanding voltammetry. Imperial College Press, London, p. 214; 2014.
- Brookes BA, Davies TJ, Fisher ACF, et al. Computational and experimental study of the cyclic voltammetry response of partially blocked electrodes. Part 1. Nonoverlapping, uniformly distributed blocking systems. J Phys Chem B. 2003;107:1616-1627.
- Metikoš-Hukovic M, Babic R, Piljac Y. Kinetics and electrocatalysis of methanol oxidation on electrodeposited Pt and Pt70Ru30 catalysts. J New Mater Electrochem Systems. 2004;7:179-190.
- Khan ASA, Ahmed R, Mirza ML. Evaluation of catalytic activity of Pt and Pt-Ru catalysts for electro-oxidation of methanol in acid medium by cyclic voltammetry. Port Electrochim Acta. 2009;27:429-441.
- Kashyout AB, Nassr ABAA, Giorgi L, et al. Electrooxidation of methanol on carbon supported Pt-Ru nanocatalysts prepared by ethanol reduction method. Int J Electrochem Sci. 2011;6:379-393.
- Zhang D, Zhang L, Zhang W, et al. Morphology-dependent electrocatalytic performance of Fe2(MoO4)3 for electro-oxidation of methanol in alkaline medium. J Materiomics. 2017;3:135-143.
- Haghnegahdar S, Noroozifar M. Deposition of PdPtAu nanoparticles on hollow nanospheres of Fe3O4 as a new catalyst of methanol electrooxidation: application in direct methanol fuel cell. Electroanalysis. 2017;29: 2896-2905.
- Ye W, Chen Y, Zhou Y, et al. Enhancing the catalytic activity of flowerlike Pt nanocrystals using polydopamine functionalized graphene supports for methanol electro-oxidation. Electrochim Acta. 2014;142:18-24.
- Momeni MM. Evaluation of the performance of Pt-MWCNTs nanocomposites electrodeposited on titanium for methanol electro-oxidation. Port Electrochim Acta. 2015;33:331-341.
- Sheng T, Lin X, Chen ZY, et al. Methanol electro-oxidation on platinum modified tungsten carbides in direct methanol fuel cells: a DFT study. Phys Chem Chem Phys. 2015;17:25235-25243.
- Ordoñez LC, Roquero P, Ramirez J, et al. Methanol electro-oxidation on bimetallic PtMo/C catalysts and Pt/C – Mo/C mechanical mixtures. Int J Electrochem Sci. 2016;11:5364-5379.
- Liang R, Hu A, Persic J, et al. Palladium nanoparticles loaded on carbon modified TiO2 nanobelts for enhanced methanol electro-oxidation. Nano-Micro Lett. 2013;5:202-212.
- Zhong X, Chen J, Yang L, et al. Electrocatalytic properties of platinum catalyst for methanol electrooxidation enhanced by nafion – thionine ion – pair. Indian J Chem. 2008;47 A:504-509.
- Carrera Cerritos R, Guerra-Balcazar M, Fuentes Ramirez R, et al. Morphological effect of Pd catalyst on ethanol electro-oxidation reaction. Materials. 2012;5:1686-1697.
- Cantane DA, Ambrosio WF, Chatenet M, et al. Electro-oxidation of ethanol on Pt/C, Rh/C and Pt/Rh/C – based electrocatalysts investigated by on – line DEMS. J Electroanal Chem. 2012;681:56-65.
- Perez J, Paganin VA, Antolini E. Particle size effects for ethanol electro-oxidation on Pt/C catalysts in half-cell and in a single direct ethanol fuel cell. J Electroanal Chem. 2011;654:108-115.
- Barbosa AFB, Oliveira VL, van Drunen J, et al. Ethanol electro-oxidation reaction using a polycrystalline nickel electrode in alkaline media: temperature influence and reaction mechanism. J Electroanal Chem. 2015;746:31-38.
- Martins CA, Fernandez PS, Troiani HE, et al. Ethanol vs. glycerol: understanding the lack of correlation between the oxidation currents and the production of CO2 on Pt nanoparticles. J Electroanal Chem. 2014;717-718:231-236.
- Britz D, Strutwolf J. Digital simulation in electrochemistry, Springer,Berlin, 2016.
- Lovric M, Komorsky-Lovric Š. Manifestation of reactivation of electrode surface in staircase cyclic voltammetry. Electrochem Commun. 2018;86:48-52.
- Etesami M, Mohamed N. Catalytic application of gold nanoparticles electrodeposited by fast scan cyclic voltammetry to glycerol electro-oxidation in alkaline electrolyte. Int J Electrochem Sci. 2011;6:4676-4689.
- Al Amri Z, Mercer MP, Vasiljevic N. Surface limited redox replacement deposition of platinum ultrathin films on gold: thickness and structure dependent activity towards the carbon monoxide and formic acid oxidation reactions. Electrochim Acta. 2016;210:520-529.
Received February 18, 2018; accepted December 18,2018
* Corresponding author. E-mail address: mlovric@irb.hr

