


Services on Demand
Journal
Article
 English (pdf)
 Article in xml format
 Article references
 Send this article by e-mail
Indicators
-
 Cited by SciELO
 -
 Access statistics
Related links
-
 Similars in
SciELO
Similars in
SciELO
Share

 Permalink
Portugaliae Electrochimica Acta
Print version ISSN 0872-1904
Port. Electrochim. Acta vol.37 no.4 Coimbra Aug. 2019
https://doi.org/10.4152/pea.201904217
ARTIGOS
Electrochemical DFT and MD Simulation Study of Substituted Imidazoles as novel Corrosion Inhibitors for mild Steel
Parul Doharea, M.A. Quraishia,b H. Lgazc, d and R. Salghid
a Department of Chemistry, IIT BHU, Varanasi 221005, India
b Center of Research Excellence in Corrosion, Research Institute, King Fahd University of Petroleum and Minerals, Dhahran 31261, Saudi Arabia
c Laboratory of Separation Methods, Faculty of Science, Ibn Tofail University P.O. Box 242, Kenitra, Morocco
d Laboratory of Applied Chemistry and Environment, ENSA, Ibn Zohr University,P.O. Box 1136, 80000 Agadir, Morocco
ABSTRACT
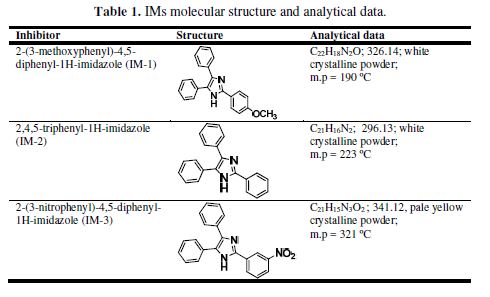
Three substituted imidazoles – 2-(3-methoxyphenyl)-4,5-diphenyl-1H-imidazole (IM-1), 2,4,5-triphenyl-1H-imidazole (IM-2), and 2-(3-nitrophenyl)-4,5-diphenyl-1H-imidazole (IM-3) – were synthesized, and their inhibiting action was tested using mass loss, electrochemical impedance spectroscopy (EIS) and potentiodynamic polarization (PDP) methods. The results show that methoxy substituted imidazole performed better as a corrosion inhibitor than NO2 substituted imidazole. These findings were corroborated by density functional theory (DFT) and molecular dynamics (MD) simulations methods. IM-1 was found to exhibit maximum IE of 97.5%, at 100 mgL-1, among the studied IMs. PDP study revealed that all the three IMs inhibitors predominantly acted as cathodic inhibitors, and the adsorption study showed that they followed Langmuir adsorption isotherm. The formation of an inhibitor film on the MS surface was confirmed by scanning electron microscopy (SEM) and atomic force microscopy (AFM). MD study revealed that binding energy and interaction energy of the inhibitors molecules on the MS surface followed the order IM-1> IM-2> IM-3. All the three IMs molecules adsorbed onto the mild steel surface by flat orientation. DFT and MD study results corroborated the experimental results.
Keywords: Corrosion inhibition, adsorption, EIS, AFM, DFT and MD.
Introduction
Metallic corrosion has drawn significant attention of scientists and technologists all over the world, because it causes enormous economic losses. The global economic loss due to corrosion has been estimated to be approximately US $ 2.5 trillion, by NACE [1]. Hydrochloric acid is widely used in many industrial processes during descaling, cleaning, oil well acidizing and pickling. Heterocyclic compounds containing nitrogen atoms, such as imidazoles and pyrimidines, have been reported as efficient corrosion inhibitors in a HCl solution [2-4]. Among these heterocyclic compounds, imidazole derivatives have attracted more attention, because of their wide biological activities, such as analgesic, fungicidal and antitumor actions [5-7], and corrosion inhibition properties [8-16]. The literature survey reveals that few imidazole derivatives act as good corrosion inhibitors. Zheng et al. [17] have studied the corrosion inhibition behavior of two ionic liquid based imidazoles, which exhibited maximum IE of 96.4% and 95.2%, at 238 ppm, respectively. Yesudass et al. [18] have studied the corrosion inhibition properties of others imidazole based ionic liquids. These compounds showed an IE of 92%, at 500 ppm. El-Haddad [19] has investigated the corrosion inhibition behavior of imidazole and methyl substituted imidazoles. These compounds exhibited an IE of 70- 77%, at 150 ppm. Gutierrez et al. [20] have reported several imidazole derivatives as corrosion inhibitors, which showed maximum IE of 57- 69%, at the concentration of 100 to 200 ppm. Their non toxic nature and significant anticorrosion properties prompted us to investigate the corrosion inhibition properties of some new imidazoles derivatives. In view of this, we synthesized three substituted imidazoles – 2-(3-methoxyphenyl)-4, 5-diphenyl-1H-imidazole (IM-1), 2,4,5-triphenyl-1H-imidazole (IM-2), and 2-(3-nitrophenyl)-4,5-diphenyl-1H-imidazole (IM-3) –, to study their corrosion inhibition performance on mild steel corrosion in HCl, using chemical and electrochemical methods. These compounds were selected as corrosion inhibitors, because of their non toxic nature and facilitating molecular structure. These inhibitors contain one imidazole ring, two nitrogen atoms, three phenyl rings, and one electron donating methoxy group. Through these groups, imidazole derivatives can absorb onto mild steel, and are likely to give high inhibition efficiency. All the selected compounds have been investigated as corrosion inhibitors on MS corrosion in HCl, using chemical and electrochemical methods. Scanning electron microscopy (SEM) and atomic force microscopy (AFM) were used for surface characterization. Density functional theory (DFT) was used to study the molecular structure effect on IE. Molecular dynamics (MD) simulations were used to study imidazole molecules adsorption behavior onto the metal surface. A very good correlation was obtained between experimental and theoretical results.
Experimental
Materials and chemicals
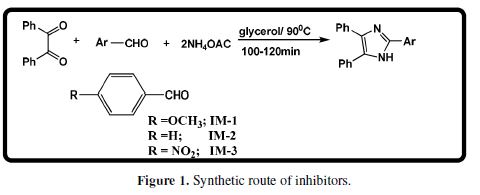
A mixture of benzyl (1.0 mmol), substituted aldehyde (1.1 mmol) and ammonium acetate (2.0 mmol) was taken in the RB flask. Then, 5-6 mL of glycerol were added, and the mixture was stirred at 90 ºC. After 3-5 h, the obtained reaction mixture was poured in the water. The precipitated solid was filtered, washed with water, and the obtained product was purified and recrystallized from ethanol. The inhibitors synthesis has been carried out by the reported literature [21], and is given in Fig. 1. The molecular structures of the synthesized compounds are given in Table 1. MS specimens, with the composition (in Wt %) 0.076 C, 0.012 P, 0.026 Si, 0.192 Mn, 0.050 Cr, 0.135 Cu, 0.023 Al, 0.050 Ni and the remainder iron, were successively polished with fine grade emery papers from 600 to 1200 grades. The specimens were thoroughly washed with double distilled water, and dried at room temperature. The aggressive 1 M HCl solution was prepared by dilution of analytical grade HCl (37%) with double distilled water, and all experiments were carried out in unstirred conditions.
Methods
Mass loss measurements
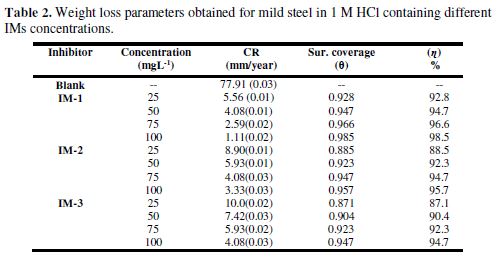
The mass loss experiments were executed for optimization of the inhibitor concentration. By the standard ASTM method, the mass loss experiments have been performed [22] immersing abraded MS coupons in 1 M HCl, in the inhibitors (IM-1, IM-2 and IM-3) absence and presence, at different concentrations (from 25 mgL-1 to 100 mgL-1). The MS coupons were taken out after 3 h of immersion, and then they were washed, dried and accurately weighted. The corrosion rates (CR (mg cm-2 h-1)) were calculated from the following equation [23]:
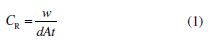
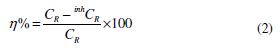
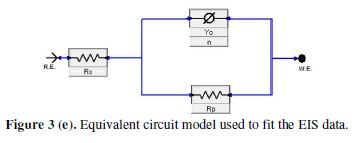
where W is the weight loss of a MS strip, A is the total area of a MS strip and t is the immersion time (3 h). With the calculated corrosion rate, the inhibition efficiency (η%) was calculated as follows [23]:
and surface coverage (θ) values were calculated by:
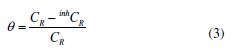
where CR and inhCR are MS corrosion rates (mg cm-2 h-1) values in the inhibitors absence and presence, respectively.
Electrochemical measurements
EIS and PDP were recorded from Echem Analyst (5.50 V) software for the data fitting. It was a three cell structure assembly, in which platinum was used as counter electrode, saturated calomel rod was used as reference electrode, and MS was used as working electrode. The open circuit potential was measured after 30 min of immersion of the working electrode, with 1.0 cm2 of exposed area. EIS measurements were performed at corrosion potentials (Ecorr), over a frequency range of 100 kHz to 10 mHz, with an AC signal amplitude perturbation of 10 mV peak to peak. The potential range for PDP measurement was +250 mV, with a scan rate of 1 mVs−1. All potentials were recorded with respect to the saturated calomel electrode (SCE).
Surface characterization
Scanning electron microscope (SEM) and Atomic Force Microscopy (AFM)
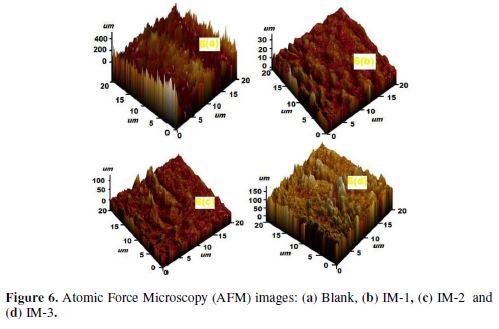
SEM study was carried out at an accelerating voltage of 5 kV and 5 K× magnification, using a Ziess EVO 50 XVP instrument. SEM micrograph was captured for the MS coupon, in the inhibitors absence and presence, at optimum concentration (100 mgL-1), with the dimensions of (2.5 × 2 × 0.025) cm3, for 24 h. The three-dimensional images of MS coupons were recorded by AFM, using NT-MDT multimode, with a dimension of 20 × 20 μm.
Quantum chemical calculations
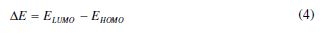
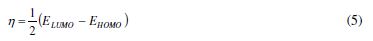
Quantum chemical calculations were performed using Gaussian 03 suited program [24]. The complete geometry optimization was conducted by DFT, with Becke’s three parameter exchange functional, and with the Lee–Yang–Paar correlation functional (B3LYP) [25]. Calculations were carried out by the basic 6-311G (d, p) set, for neutral and protonated forms in the gas phase, respectively. The quantum chemical parameters, such as energy of highest occupied molecular orbital (EHOMO), and lowest unoccupied molecular orbital (ELUMO), have been calculated by IMs optimized molecular structures. Other quantum parameters, such as Energy gap (?E) among ELUMO- EHOMO, hardness (η), softness (σ), electronegativity (χ), and the electrons transfer fraction were calculated by the following equations:

fraction of transferred electrons (ΔN) from the inhibitor to the mild steel surface can be calculated with the help of χ and ? values, using the equation given below: [26]
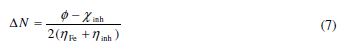
where χFe and χinh denote the absolute electronegativity of iron, and the inhibitor molecule, respectively; and ?Fe and ?inh denote the absolute hardness of iron, and the inhibitor molecule, respectively. ? and ?Fe values were taken as 4.82 and 0 eV mol-1, respectively [27].
Molecular dynamics simulations
MD simulations for investigated IMs molecules were carried out in a simulation box with periodic boundary conditions, using Materials Studio 6.0 (from Accelrys Inc.) [28]. The iron crystal was imported and cleaved along (110) plane, and a slab of 5 Å was employed. The Fe (110) surface was relaxed by minimizing its energy, using a smart minimiser method. The Fe (110) surface was enlarged to a 10 × 10 supercell, to provide a large surface for the inhibitors interaction. A vacuum slab with zero thickness was built. A supercell, with a size of a = b = 24.82 Å, and c = 25.14 Å, containing 500 H2O, and one molecule of tested inhibitors, was created. The simulation was carried out in a simulation box (24.82 × 24.82 × 35.69) Å3, using a discover module with a time step of 1 fs, a simulation time of 500 ps, at 303 K, NVT ensemble (constant number of atoms, constant-volume, constant-temperature) and COMPASS force field [29]. In the simulation system, the interactions between inhibitors and Fe (110) surface can be understood by the interactions and binding energies calculated using the following equations [30]

where Etotal is the total energy of the entire system, Esurface+solution is the total energy of the Fe (110) surface and of the solution without inhibitor, Einhibitor+solution is the total energy of the inhibitor and of the solution, and Esolution is the total energy of the solution.
Results and discussions
Gravimetric measurements
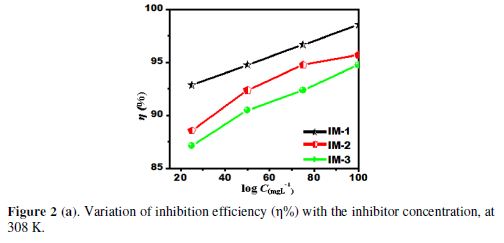
Inhibitor concentration effect
The corrosion inhibition parameters data obtained from Fig. 2 (a) are listed in Table 2. The results show that the corrosion inhibition efficiency increased with higher imidazoles concentrations, which is attributed to the maximum metal surface coverage by inhibiting molecules. The maximum inhibition efficiency observed, in the present case, for IM-1- , IM-2- and for IM-3-, was 97.6%, 94.2% and 91.8%, respectively, at 100 mgL-1.
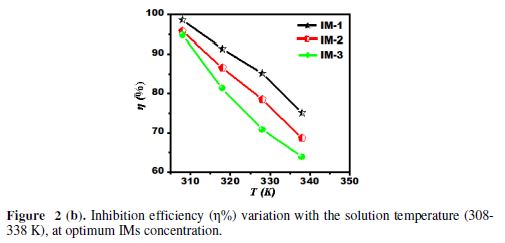
Temperature effect
The variation of IE with temperature is shown in Fig. 2 (b). It is clearly seen from the graph that IE decreases with the rise in temperature from 308 to 338 K. The decrease in IE may be attributed to the IMs molecules desorption from the metal surface, at elevated temperatures [31].
Thermodynamic adsorption parameters
The temperature effect on the corrosion rate (CR) for mild steel, in IMs absence and presence, is shown in Fig. 2 (c), and can be represented by Arrhenius equation:
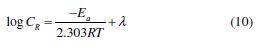
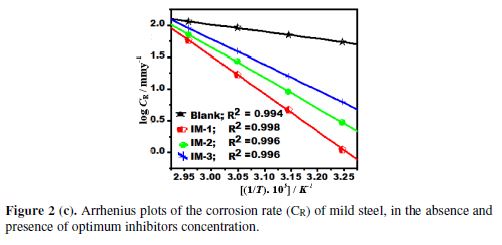
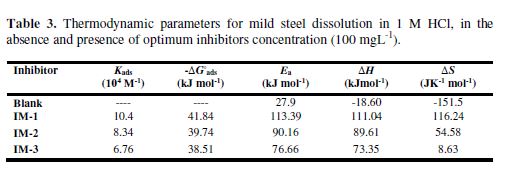
where Ea is the apparent activation energy, R is the universal gas constant, λ is the Arrhenius pre-exponential factor, and T is the absolute temperature. The ?H*, ?S*and ?Ea values are given in Table 3. The calculated Ea value for mild steel in 1 N HCl, in the inhibitors absence, was 27.9 kJmol-1, while in the imidazoles presence, the Ea values were 113.3, 90.1 and 76.6 kJmol-1, for IM-1, IM-2 and IM-3, respectively (Table 3). The higher Ea values, in the inhibitors presence, can be attributed to the creation of a physical barrier at the metal/solution interface, which decreases MS corrosion rate [31].
Adsorption isotherm
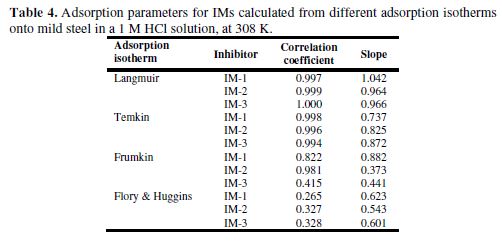
Adsorption isotherms studies play an important role in understanding the inhibitors adsorption behavior onto the metal surface. [32-33]. Various adsorption isotherms, such as Frumkin, Langmuir, Temkin, and Flory–Huggins, have been tested and fitted; however, the best fit was found to be Langmuir adsorption isotherm (Fig. 2 (d). The calculated data are given in Table 4. Langmuir adsorption isotherm is represented by the following equation:
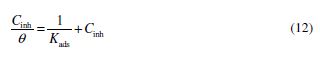
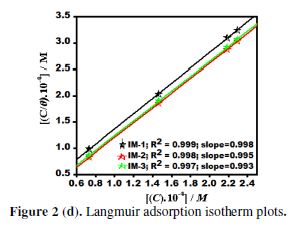
where Kads is the equilibrium constant, C is the inhibitor concentration and θ is the surface coverage. A straight line was observed by plotting a graph between log Cinh/θ vs. Cinh, as shown in Fig. 2 (d), which suggested that the inhibitor molecules adsorption onto the metal surface obeyed Langmuir adsorption isotherm.
The values of Kads and standard Gibbs free energy of adsorption (ΔGo(ads)) were obtained from the Langmuir adsorption isotherm, by the following equation:
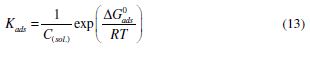
where R is the universal gas constant, T is the absolute temperature and C is the water concentration (1000 g/L). The Kads values are herein represented in g-1L; thus, in this equation, the water concentration is taken in g/L (1000 g/L), instead of 55.5 mole/L. Kads and ΔGo(ads) values are reported in Table 3. Generally, the higher Kads value is associated to stronger adsorption and higher inhibition. In our present study, Kads value obeyed the order IM-1 > IM-2 > IM-3, which is in accordance with the inhibition efficiency order obtained by the mass loss method. ΔG0ads values varied from -41.84 to -38.59 kJ mol-1, which means that the inhibitors were adsorbed onto the mild steel surface by a mixed mode mechanism; predominantly, by the chemical adsorption mode [23, 34].
Electrochemical impedance spectroscopy (EIS) study
Fig. 3 (a) represents the impedance results in the form of Nyquist plots, in the inhibitors (IMs) absence and presence, at their optimum concentration of 100 mgL-1.
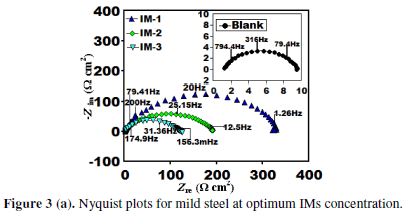
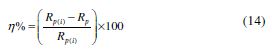
The fitted Nyquist plots for IMs molecules are given in Figs. 3 (b-d). A careful examination of Nyquist plots reveals that the capacity loop diameter was higher in the imidazoles presence than in their absence, which indicates that mild steel corrosion in a 1 M hydrochloric acid solution was controlled by polarization resistance [35]. Generally, the difference in the real impedance at the lower frequency and higher frequency is denoted as the charge transfer resistance (Rct). IE (Fig. 3(a)) was calculated by the polarization resistance obtained from Nyquist plots, according to the following equation:
where Rp is the sum of Rct and Rf, Rf is the film resistance, in the inhibitors presence, and Rp is the polarization resistance, in the inhibitors absence.
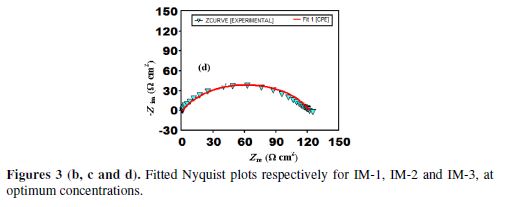
EIS data were analyzed using the equivalent circuit (Fig. 3(e)) [36-37], which includes reference electrode (R.E), solution resistance (Rs), constant phase angle (Yo), phase shift (n), polarization resistance (Rp), and working electrode (WE).
For metal corroding in an acidic solution, replacement of the capacitance with CPE gives a better approximation. The CPE impedance can be represented as follows:
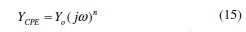
where Y0 is the constant phase element (CPE), ω is the angular frequency, j is the imaginary number, and n is the phase shift that measures the surface homogeneity [38].
Table 5 shows that, with an increasing inhibitor concentration, Rp increases, due to the formation of a protective film onto the metal surface, and the Cdl value decreases, which is attributed to the increase in the thickness of the electrical double layer on the metal/solution interface, or to the decrease in the local dielectric constant.
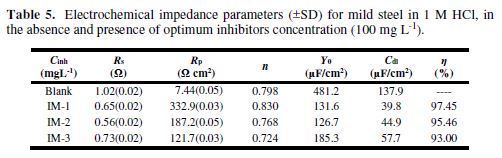
Table 5 shows that the IMs molecules’ IE follows the order IM-1> IM-2> IM-3, which is in accordance to the data obtained from mass loss and PDP methods. The double layer capacitance (Cdl) was derived from the following relationship:

where ωmax is the frequency at which the impedance imaginary part has attained the maximum (rad s-1) value.
EIS results depicted in Table 5 reveal that the “n” value for the present case ranges from 0.798 to 0.830, which signifies that CPE behaves as a non ideal capacitor. Deviation from the ideal capacitive behavior (deviation from n = 1) is attributed to surface heterogeneity [31].
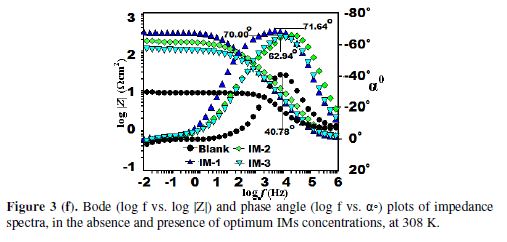
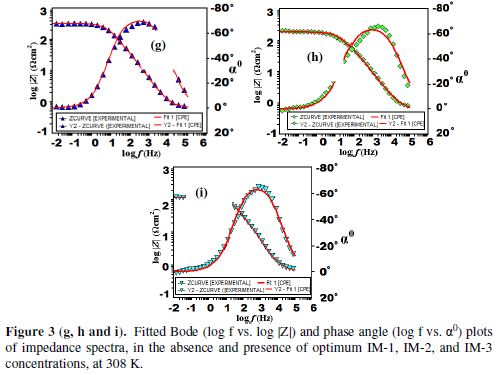
The fitted Bode plots for IMs are given in Figs. 3 (g-i). Generally, the ideal capacitor slope and phase angle (α0) values should be -1 and -900, respectively. However, in the present case, the corresponding slope and phase angles values are as follows: -0.503, -40.780 for the blank; -0.825, -71.240 for IM-1; -0.739, -70.000 for IM-2; and -0.733, -62.940 for IM-3. This deviation in the slope and phase angle is due to the surface heterogeneity, which has structural and interfacial origins [39-40]. However, in IMs presence (Fig. 3 (f)), phase angles values have been enhanced, indicating significant improvement in the surface smoothness, due to the formation of a protective film of imidazoles over the metallic surface, which protects it from corrosion [41-42].
Potentiodynamic polarization study
mild steel potentiodynamic polarization curves in a 1 M HCl solution at 35 ºC, with optimum imidazoles molecules concentration (100 mgL-1) are shown in Fig. 4.
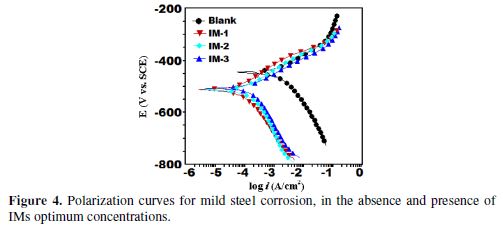
Potentiodynamic polarization parameters, i.e., corrosion potential (Ecorr), cathodic and anodic Tafel slopes (βc, βa), and corrosion current density (icorr), obtained from the Tafel extrapolation of the polarization curves, are given in Table 6.
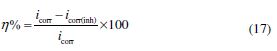
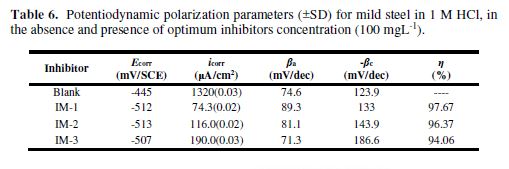
where icorr and icorr(inh) are the corrosion current densities, in the inhibitor absence and presence, respectively. The polarization results showed that the corrosion current density was significantly reduced in imidazoles presence, without any change in the appearance of polarization curves. This reveals that IMs inhibit the corrosion by blocking the metallic surface’s active sites, without any change in the corrosion mechanism [43]. The maximum displacement in the Ecorr values for the inhibited specimen, with respect to the uninhibited specimen, is 67 mV towards the cathodic side, which is less than 85 mV. This clearly suggests that the investigated IMs are mixed type inhibitors, and predominantly act as cathodic inhibitors. Fig. 4 reveals that IMs addition decreases both anodic and cathodic reactions, which suggests that inhibiting molecules are adsorbed on anodic and cathodic sites. The values of both anodic and cathodic tafel slopes (βa, βc) slightly changed with the IMs addition, indicating the reduction of MS anodic dissolution and cathodic hydrogen evolution reactions, without affecting the reaction mechanism [44].
Surface characterization
Scanning electron microscopy
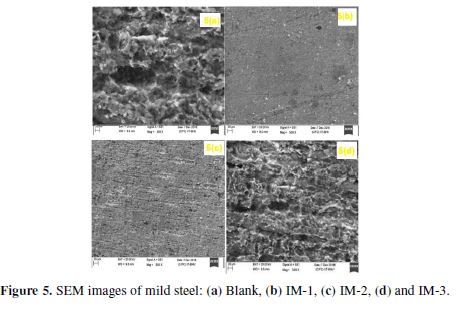
The MS surface, which has been immersed in the uninhibited test solution, is rough and damaged, due to metal dissolution (Fig. 5 a). however, the inhibited MS specimens (IM-1, IM-2, IM-3) surfaces are relatively smooth, which reveals the formation of a protective inhibitor film on it (Figs. 5 (b-d) ).
Atomic force microscopy
The three-dimensional AFM images of uninhibited and inhibited MS samples are shown in Figs. 6 (a-d) . The average roughness of the MS sample in a 1 M HCl solution without sinhibitor (Fig. 6 (a)) was 400 um. However, with IM-1, IM-2 and IM-3 optimum concentration (100 mgL-1), as shown in Figs. 6 (b-d), the average roughness was reduced to 30 um, 100 um and 150 um, respectively. The lower roughness value for imidazoles reveals the presence of a protective film on the metal surface.
Quantum chemical calculations
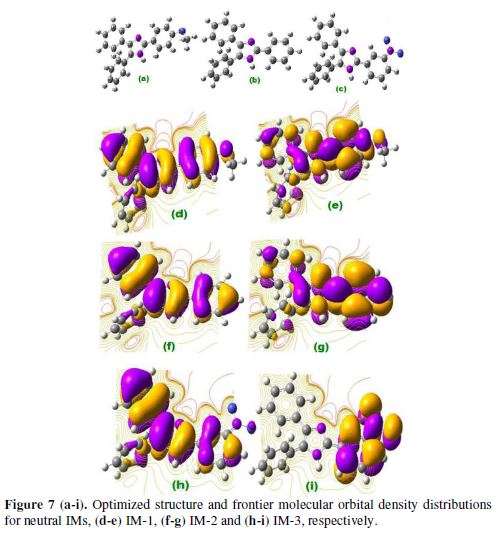
Quantum chemical study played an important role in analyzing the molecular structure effect on inhibition performance. IMs EHOMO and ELUMO for neutral and protonated inhibitors, are shown in Figs. 7 (a–i), and Figs. 8 (a–i).
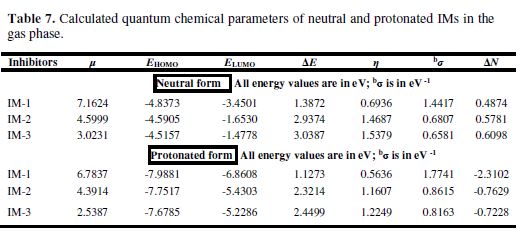
Energy of highest occupied molecular orbital (EHOMO), energy of lowest unoccupied molecular orbital (ELUMO), energy gap (?E) (?ELUMO-EHOMO), dipole moment (µ), electronegativity (χ), hardness (?), softness (σ), and the electrons transfer (?N) fraction calculations for neutral and protonated molecules are given in Table 7. According to the frontier molecular orbital theory, only HOMO and LUMO are involved in electrons sharing during the adsorption process [46]. It was reported that EHOMO is often associated with the inhibitor’s electron donating capacity to the metal’s vacant d-orbital, whereas ELUMO indicates its ability to accept electrons from the filled metal orbitals. Lower energy gap (?E) favors inhibitor molecules adsorption onto the metal surface [47]. A good corrosion inhibitor easily gives electrons to metal, and readily accepts electrons from the filled metal orbital [48].
Neutral IMs
From Figs. 7(d-i) it can be observed that IM-1 and IM-2 HOMO regions are delocalized over the imidazole ring, but IM-3 HOMO is distributed over the NO2 group and the imidazole ring. IM-1 and IM-2 LUMO regions are localized over the imidazole ring, and the methoxy substituted phenyl ring. In IM-3, these regions are spread over the NO2 substituted phenyl ring. Table 7 shows that the energy gap (?E) order among the three IMs is IM-1< IM-2< IM-3, respectively. A chemical species with high softness (σ) value and lower hardness (η) value is associated to a strong interaction with the metal, and a high IE. In the present study, the softness values follow the order IM-1> IM-2> IM-3, and the hardness order is IM-1< IM-2< IM-3, respectively, which is in accordance to the IE order experimentally obtained. The relative performance of inhibiting molecules can also be predicted on the basis of their ?N values (fraction of electrons transfer). It is reported that higher ?N values are associated to the high IE [49-50]. In the present study, the ?N value for imidazole did not follow the regular trends. Generally, dipole moment (µ) is a polarizability measure of any organic molecule. Chemical species with high µ values are more polarizable, and cover a wider area of the metal surface, thereby acting as good corrosion inhibitors, when compared to the molecule with a lower µ value [51-52]. In the present case, the dipole moment order is IM-1> IM-2> IM-3, indicating that IM-1 is the best inhibitor among the three imidazoles.
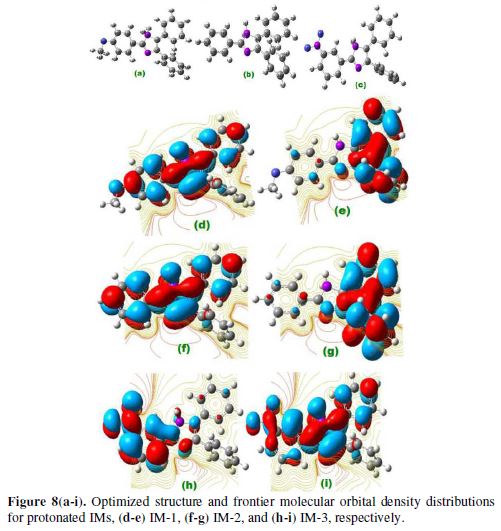
Protonated IMs
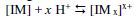
The inhibitor molecules undergo the protonation in the aqueous acidic media. These protonated inhibitors molecules (IMs) are adsorbed onto the mild steel surface over pre adsorbed chloride ions. Fig. 8 (a-i) represent optimized HOMO and LUMO of the protonated imidazole inhibitors. HOMO regions of protonated IM-1 and IM-2 are distributed over the 3,4 substituted phenyl rings of imidazole, while, in the case of IM-3 HOMO regions, they are distributed over 4 imidazole substituted phenyl rings. LUMO regions of IM-1 and IM-2 are distributed over the methoxy substituted phenyl ring of imidazole ring. And, in the case of IM-3, LUMO regions are distributed over the imidazole ring and the NO2 substituted phenyl ring. From Table 7, ΔE values are lower for protonated inhibitors than for neutral imidazoles, suggesting that protonated molecules are more readily adsorbed onto the MS surface than the neutral inhibitors. The predominant cathodic behavior of imidazole molecules supports the high IE of the protonated molecules.
The hardness values for the protonated molecules are given in Table 7, following the order IM-1<IM-2<IM-3, respectively. The protonated imidazole molecules’ softness follows the order IM-1>IM-2>IM-3. Table 7 reveals that all the calculated ΔN values are negative, which means that the electrons donation from the inhibitor molecules to the metal surface is not possible [31]. The ?E values for protonated IMs are lower as compared to the neutral molecules, which suggests that the former are more reactive than the latter, and that they readily accept electrons from the metal surface, thereby forming a strong bond between metal and inhibitor.
MD simulations
MD simulations have been carried out in the presence of 500 water molecules, 5 H3O+, 5 Cl- and one molecule of the tested imidazole inhibitor, to study the interaction between the inhibitor and the metal surfaces (Fe (110) [53]. Each simulation was run until the system reached equilibrium. Figs. 9 (a and b) show that both temperature and energy were balanced. The interactions and binding energies of the inhibitor molecules have been calculated by equations 9 and 10.
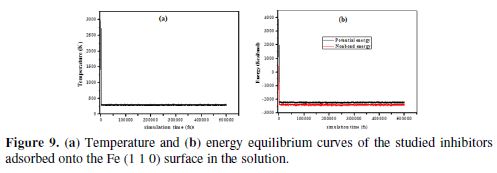
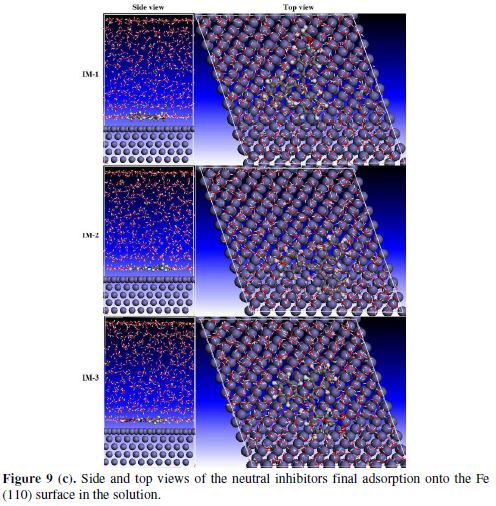
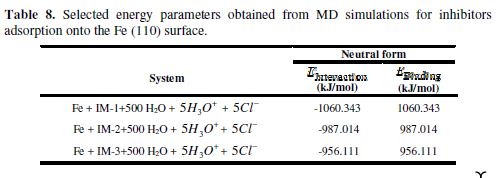
Fig. 9 (c) represents the top and side view of IMs inhibitors adsorption onto the Fe surface. To maximize the contact surface area, the inhibitors molecules gradually moved parallel to the Fe surface, which could enhance the surface coverage degree, by forming a protective film. There are significant interactions between the studied compounds and iron atoms, mostly due to the presence of π-bonds in phenyl rings, as well as of nitrogen atoms in imidazole rings. Table 8 shows that the interaction and the binding energies are higher for IM-1 than for IM-2 and IM-3, which suggests that IM-1 is strongly bonded to iron atoms, compared to IM-2 and IM-3. In the literature, it is reported that more negative interaction energy values indicate the highest adsorption ability of an inhibitor onto the Fe surface [54-57]. Furthermore, the higher magnitude of binding energies means easier inhibitor molecules adsorption onto the metal surface, and higher stability of the adsorptive system [56]. The lowest IM-3 IE is attributed to the electrons withdrawing (–NO2)(8), while the highest IM-1 IE is due to the electron donating group (–OCH3) [58].
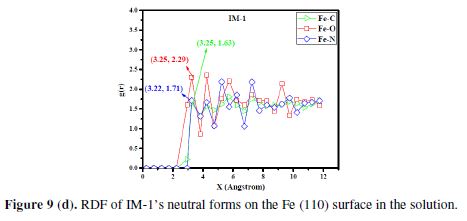
In the present study, we have also examined the different interactions between the inhibitor and iron atoms, using radial distribution functions (RDFs) [59]. RDF is widely used as a useful method to investigate the bond length between metal and inhibitor. RDFs were calculated from the MD simulations trajectories [60). RDF, g(r), is defined as the probability of finding particle B within the range r + dr around particle A. It is defined as follows [60]:
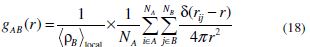
where (ρB)local is B’s particle density averaged over all shells around particle A. The peak distance in RDFs indicates how much meaningful are the interactions with the iron surface [61]. The peak within 3.5 Å is an indication of small bond length, which indicates the chemisorptions, while the peak greater than 3.5 Å shows the physical interactions [62]. Fig. 9 (d) shows RDF curves for the neutral IM-1 molecule. Bond lengths of IM-1 atoms (Fe-N, Fe-O and Fe-C) are around 3.22, 3.25 and 3.25 Å, respectively, which is lower than 3.5 Å, suggesting a strong chemical interaction between the metal and IM-1. The results are consistent with experimental findings.
Inhibition mechanism
On the basis of experimental and theoretical results, adsorption and inhibition mechanisms can be proposed (Fig. 10):

(1) The protonated inhibitor molecules in a chloride solution get adsorbed on chloride ions through electrostatic interaction (physical adsorption).
(2) At the cathodic site, these protonated molecules accept electrons and become neutral. These neutral inhibitor molecules are chemically adsorbed onto the metal surface, through their lone pair of electrons present on heteroatoms.
(3) Inhibitors molecules can also accept electrons in their antibonding orbital from the Fe d orbital, through retro-donation, thereby strengthening the adsorption onto the metal surface.
Conclusions
The main conclusions of this study are as follows:
- All the three IMs act as efficient CI for MS in a 1 HCl solution, and IM-1 exhibited 97.3%, at 100 mgL-1.
- The EIS results revealed that corrosion inhibition takes place by the adsorption process.
- PDP curves indicated that IMs acted as mixed inhibitors, but predominantly as from the cathodic type.
- The negative ?G°ads values suggest IMs spontaneous adsorption onto the metal surface.
- The IMs adsorption isotherm is followed by Langmuir adsorption isotherm.
- The higher Kads value suggests that the studied IMs are strongly adsorbed at the MS/hydrochloric acid interface.
- SEM and AFM investigations indicated the formation of an inhibitor film on the metal surface.
- DFT and MD corroborated the experimentally obtained results
References
- Koch GH, Thompson NG, Moghissi O, et al. Report No. OAPUS310GKOCH (AP110272) (Houston, TX: NACE International, 2016).
- Mu GN, Li X, Li F. Mater Chem Phys. 2004; 86: 59.
- Avdeev YG, Kuznetsov YI, Buryak AK. Corros Sci. 2013; 69: 50.
- Zucchi F, Trabanelli G, Brunoro G. Corros Sci. 1994; 36: 1683.
- Sathe BS, Jaychandrann E, Jagtap VA, et al. Der Pharm Chem. 2011; 3: 305.
- Roongpisuthipong A, Chalermchockcharoenkit A, Sirimai K, et al. Asian Biomed. 2010; 4: 443.
- Sondhi SM, Jain S, Dinodia M, et al. Med Chem. 2008; 4: 146.
- Hasanov R, Sadikoglu M, Bilgic S. Appl Surf Sci. 2007; 253: 3913.
- Ozcan M. J Solid State Electrochem. 2008; 12: 1653.
- Avci G. Colloids Surf A Physicochem Eng Aspects. 2008; 317: 730.
- Kovacevic N, Kokalj A. Corros Sci. 2011; 53: 909.
- El-Haddad NM, Fouda AS. J Mol Liq. 2015; 209: 480.
- Xua B, Ji Y, Zhang X, et al. Inst Chem Eng. 2016; 59: 526.
- Li X, Xie X, Deng S, et al. Corros Sci. 2014; 87: 27.
- Sorkhabi HA, Shaabanib B, Seifzadeh D. Electrochim Acta. 2005; 50(16): 3446.
- Negm NA, Badr EA, Aiad IA, et al. Corros Sci. 2012; 65: 77.
- Zheng X, Zhang S, Li W, et al. Corros Sci. 2015; 95 : 168.
- Yesudass S, Olasunkanmi LO, Bahadur I, et al. Inst Chem Eng. 2016; 64: 252.
- El-Haddad NM, Fouda AS. J Mol Liq. 2015; 209: 480.
- Gutiérrez E, Rodríguez JA, Borbolla JC, et al. Corros Sci. 2016;108: 23.
- Nemati F, Hosseini MM, Kiani H. J Saudi Chem Soc. 2013; DOI.org/10.1016/j.jscs.2013.02.004.
- Perdew JP, Burke K, Ernzerhof M. Phys Rev Lett. 1997; 78: 1396.
- Chaubey N, Savita, Singh VK, et al. Journal of the Association of Arab Universities for Basic and Applied Sciences. 2017; 22: 38.
- Gaussian 03, Frisch MJ, et al. Gaussian Inc., Wallingford CT, (2004).
- Popova A, Christov M, Vasilev A. Corros Sci. 2007; 49: 3276.
- Lee C, Yang W, Parr RG. Phys Rev B. 1988; 37: 785.
- Kovacevic N, Kokalj A. Corros Sci. 2011; 53: 909.
- Materials Studio, Revision 6.0, Accelrys Inc., San Diego, USA, 2013.
- Zhang Z, Tian NC, Huang XD, et al. RSC Adv. 2016; 6: 22250.
- Lgaz H, Salghi R, Jodeh S, et al. J Mol Liq. 2017; 225: 271.
- Dohare P, Ansari KR, Quraishi MA, et al. J Ind Eng Chem. 2017; 52: 197.
- Saleh MR, El Din SAM. Corros Sci. 1972; 12: 689.
- Maayta AK, Al-Rawashdeh NAF. Corros Sci. 2004; 46: 1129.
- Kowsari E, Payami M, Amini R, et al. Appl Surf Sci. 2014; 289: 478– 486.
- Yildiz R. Corros Sci. 2015; 90: 544.
- Youse A, Javadian S, Dalir N, et al. RSC Adv. 2015; 5: 11697.
- Solmaza R, Kardas G, Ulha MC, et al. Electrochim Acta. 2008; 53: 5941.
- Umoren SA, Li Y, Wang FH. Corros Sci. 2010; 52: 1777.
- Dohare P, Chauhan DS, Hammouti B, et al. Anal Bioanal Electrochem. 2017; 9: 762.
- Singh P, Ebenso EE, Olasunkanmi LO, et al. J Phys Chem C. 2016; 120: 3408.
- Yadav DK, Quraishi MA, Maiti B. Corros Sci. 2012; 55: 254.
- Dohare P, Chauhan DS, Sorour AA, et al. Material Discovery. https://doi.org/10.1016/j.md.2017.11.001.
- Yildiz R, Dogan T, Dehri I. Corros Sci. 2014; 85: 215.
- Qian B, Wang J, Zhang M, et al. Corros Sci. 2013; 75: 184.
- Zhang QB, Hua YX. Electrochim Acta. 2009; 54: 1881.
- Chiter F, Lacaze-Dufaure C, Tangb H, et al. Phys Chem Chem Phys. 2015; 17: 22243.
- Olasunkanmi LO, Obot IB, Kabanda MM, et al. J Phys Chem C. 2015; 119: 16004.
- Zhang D, Tang Y, Qi S, et al. Corros Sci. 2w016; 102: 517.
- Pearson RG. Inorg Chem. 1988; 27: 734.
- Singh A, Ansari KR, Haque J, et al. J of the Tai Inst of Chem Eng. 2017; 000:1.
- Petkova AGS, Peyerimhoff SD. Chem Phys. 2002;279: 1.
- Geerlings P, De Proft F, Langenaeker W. Chem Rev. 2003; 103: 1793.
- Lgaz H, Salghi R, Jodeh S, et al. J Mol Liq. 2017; 225: 271.
- Salarvand Z, Amirnasr M, Talebian M, et al. Corros Sci. 2017; 114: 133–145. doi:10.1016/j.corsci.2016.11.002.
- Kaya S, Guo L, Kaya C, et al. J Taiwan Inst Chem Eng. 2016; 65: 522.
- Saha SK, Murmu M, Murmu NC, et al. J Mol Liq A. 2016; 224: 629.
- Yan Y, Wang X, Zhang Y, et al. Mol Simul. 2013; 39: 1034.
- Fouda A, El-Ewady Y, Abo-El-Enien O, et al. Anti-Corros Method Mater. 2008; 55: 317.
- Zhang D, Tang Y, Qi S, et al. Corros Sci. 2016; 102: 517.
- Wu R, Qiu X, Shi Y, et al. Mol Simul. 2017; 43: 491.
- Benzon K, Mary YS, Varghese HT, et al. J Mol Struct. 2017; 1134 (2017) 330.
- Xie S-W, Liu Z, Han G-C, et al. Comput Theor Chem. 2015; 1063: 50.
Received July 23, 2017; accepted December 30, 2017
Acknowledgements
The author Parul Dohare acknowledges the financial support of Human Resources and Development (M.H.R.D.), New Delhi, provided as Senior Research Fellowship.
E-mail address:maquraishi.apc@itbhu.ac.in

