


Servicios Personalizados
Revista
Articulo
 Inglés (pdf)
 Articulo en XML
 Referencias del artículo
 Enviar articulo por email
Indicadores
-
 Citado por SciELO
 -
 Accesos
Links relacionados
-
 Similares en
SciELO
Similares en
SciELO
Compartir

 Permalink
Portugaliae Electrochimica Acta
versión impresa ISSN 0872-1904
Port. Electrochim. Acta vol.37 no.1 Coimbra ene. 2019
https://doi.org/10.4152/pea.201901001
Cordia Dichotoma as Corrosion Inhibitor for Aluminum Alloy (AA6063) in Hydrochloric Acid
S. Sharmaa,* and Y.C. Sharmab
a Department of Chemistry, University of Rajasthan, Jaipur (Rajasthan) - 302 015, India
b Faculty of Basic and Applied Sciences and Dean, Research & Development, Vivekananda Global University, Jaipur (Rajastha,) - 303 012, India
Abstract
Aluminum alloy corrosion behavior (AA6063) in a 0.5 M hydrochloric acid (HCl) solution was studied. It has been observed that the ethanolic extract of Cordia dichotoma seeds (EECdS) acts as an excellent inhibitor for AA6063 corrosion in a 0.5 M HCl solution. In this study, conventional weight loss, Fourier transformed infra-red spectroscopy (FTIR), electrochemical impedance spectroscopy (EIS) and scanning electron microscopy (SEM) analysis techniques were used. It was found that the percentage inhibition efficiency increased with higher CdS concentrations. The thermodynamic and kinetic parameters, along with the equilibrium constant for the adsorption processes, showed that CdS performed well as an inhibitor. CdS adsorption on the alloy followed the Langmuir adsorption isotherm, at all the studied concentrations. FTIR, EIS and SEM investigations also indicated that CdS presence effectively lowered the dissolution currents.
Keywords: 6063 aluminum alloy, Cordia dichotoma, inhibitor, FTIR and SEM.
Introduction
Corrosion inhibition is one of the most effective and economic methods used in industries, to reduce the corrosion rate of metals and alloys in contact with aggressive environments [1]. Most of the corrosion inhibitors are synthetic chemicals. Many studies have been devoted to aluminum (Al) corrosion inhibition in acidic media by inorganic anions, including chromate, phosphate, molybdate, tungstate, vanadate, etc. [2]. In some studies, most organic inhibitors act by adsorption onto the metal surface, through heteroatoms such as O, N, S, triple bond or aromatic ring. These organic compounds are adsorbed onto the metal surface, and block the active corrosion sites. These synthetic compounds show good anticorrosive activity, but most of them are highly toxic, expensive and very hazardous to the environment. Recently, the emphasis has been put on exploring natural products to be used as alternative, non-toxic, easily available, low cost and eco-friendly green corrosion inhibitors [3-6]. Earlier studies show that natural products of plant origin, containing different organic compounds, such as vitamins, flavonoids, tannins, alkaloids, amino acids, etc., have very good inhibiting action on metallic corrosion [7-10].
The aim of the present investigation was to evaluate a naturally occurring low cost and environmentally safe substance, i.e., Cordia dichotoma (CdS), for the use in the Al alloy (“AA6063”) acid corrosion inhibition. The study of the effectiveness of the ethanolic extract of Cordia dichotoma seeds (EECdS) on AA6063 acid corrosion has been evaluated using chemical and electrochemical methods. EECdS adsorption behavior onto AA6063 surface was analyzed by FTIR spectroscopy. A protective layer formed on the alloy surface was also justified by SEM analysis. EECdS inhibitory action was explained, and various adsorption isotherms were tested to fit in to the results. Electrochemical measurements were also performed to critically analyze the findings of other methods. From the results, it is suggested that EECdS can be used as a green inhibitor for AA6063 acid corrosion.
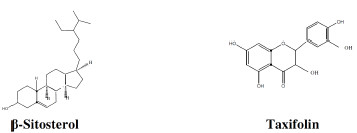
Cordia dichotoma is a medium sized tree, widespread in Rajasthan, India, where it is locally known as Lashooda or Lesua. It yields edible fruits, from which a very sticky white substance can be extracted, while the leaves, fruit, bark and seeds exhibit anti-diabetic, antiulcer, anti-inflammatory, immune-modulator and analgesic properties [11-14]. The scientific classification of the Cordia dichotoma is as follows: kingdom - Plantae; family - Boraginaceae; genus - Cordia ; species - C. dichotoma; bionomical name - Cordia dichotoma. Cordia dichotoma seeds have disclosed the presence of á-amyrins, betulin, octacosanol, lupeol-3-rhamnoside, ß-sitosterol, ß-sitosterol-3-glucoside, hentricontanol, hentricontane, taxifolin-3, 5-dirhmnoside and hesperitin-7-rhamnoside [15-17]. Some investigations show their adsorptive property over a metal surface, and their anticorrosive behavior [18-20]. The structure of some chemical constituents of CdS is:
The constituents present in Cordia dichotoma are found to be effective for mild steel corrosion inhibition activity in acidic media [21].
Experimental
Materials and methods
To determine the inhibitive property of EECdS on AA6063 in acidic media, chemical and electrochemical methods were employed. All the used aggressive solutions (0.5 M HCl) were made of AR grade reagent and deionized water. All sets of experiments were performed in triplicate, to confirm the reproducibility of the results. Preparation of test solutions, cleaning of Al coupons and preparation of CdS ethanolic extract were done as per standard practices [22-24].
Preparation of Al coupons
Industrial AA6063 of 98.99% purity has been used for test coupons. For weight loss experiments, mechanically press cut rectangular coupons (3 cm × 2 cm × 0.16 cm), with a hole of about 0.12 mm of diameter near the upper edge, were used. These were carefully examined to check for rough edges, and the surface treatment of the coupons was carried out by using various grades of emery paper (110 to 410), until the surface was free from scratches and other apparent defects. Then, they were degreased in acetone, finally washed with bi-distilled water, and dried in an oven. Thereafter, these specimens were kept in desiccators, until they cooled to room temperature, and then accurately weighed using a digital balance. They were further subjected to heating, cooling and weighing, until a constant weight was obtained, and then kept in desiccators. The surface treatment was immediately carried out before each corrosion test [25].
Ethanolic extract of cordia dichotoma seeds (EECdS)
The stock solutions of Cordia dichotoma seeds were prepared by soaking a weighed amount, dried at room temperature and finely powdered, in a properly corked container containing distilled ethanol. EECdS mass was found to be 25.0 g/L of the plant compound. On the soaking period completion, the ethanolic solutions were refluxed for 24 h, to concentrate the inhibiting chemicals, and then filtered to remove any suspended impurities. This stock solution of the extract was stored in a clean corked bottle, and used as inhibitor.
Preparation of test solutions
The aggressive solutions were measured to 100 mL in seven separate beakers, labeled as S0, S1, S2, S3, S4, S5 and S6. EECdS was added in order to increasing concentration, as to have 0.025, 0.075, 0.175, 0.275, 0.542 and 1.05 g/L, respectively, in S1, S2, S3, S4, S5 and S6 beakers, while no extract was added to S0, i.e., the first beaker solution. All the beakers were kept unstirred, and covered with Teflon tape throughout the experiment.
Fourier-transform infrared (FTIR) spectroscopy
FTIR analysis was carried out to identify the functional groups present in EECdS, and those in the corrosion products. The spectra were recorded with the 8400s Shimadzu, Japan spectrometer, by scanning the samples through a wave number range of 400 to 4000 cm-1. The samples were prepared for the analysis using KBr [26].
Electrochemical method
Electrochemical measurements were carried out using a three electrode chemical cell attached with a PGSTAT 12 potentiostat [Autolab make with GPES software (EcoChemie)] connected to a personal computer. Fresh electrodes and solutions were used for each experimentation sets [27]. The aerated solutions were kept in an unstirred position during the measurements, at a temperature of 298±1 K.
The AA6063 specimen embedded in Teflon tape with an exposed area of 0.34 cm2 was used as working electrode, while the counter electrode was a platinum wire, and the reference electrode was saturated Ag/AgCl/KCl. Initially, the working electrode was put in the test solution, and left for 10 min at the open circuit potential.
The EIS measurements were carried out using AC signals of amplitude 20 mV peak-to peak at the open circuit potential, in the frequency range of 10 000 Hz to 0.5 Hz. After the impedance spectrum was obtained, the polarization curves were immediately recorded by changing the electrode potential.
Potentiostatic polarization measurements
Using the above explained spectrum, the effect of EECdS concentration on electrochemical parameters values, such as corrosion current density (Icorr), corrosion potential (Ecorr) and polarization resistance (Rp), was calculated. The so obtained corrosion rate was used to find out EEgCdS inhibition efficiency value in an acidic environment (0.5 M HCl.
Electrochemical Impedance Spectroscopy (EIS) measurements
EIS plots were analyzed in an acidic medium (0.5 M HCl) with and without inhibitor, for AA6063 coupons. The measurements for EIS studies were made with optimum EECdS concentrations in inhibited solutions. The inhibition efficiency was calculated by using the charge transfer resistance (Rct) values obtained for uninhibited and inhibited (optimum concentration) solutions. The measurements were carried out at room temperature (298±1 K).
Scanning electron microscopy
AA6063 surface morphology, before and after immersion in the corrosion media, was examined using a SEM machine model- Quanta 3D FEG [28-31.
Results and discussion
FTIR analysis of the extract and corrosion product
EECdS adsorption onto AA6063 was analyzed by carrying out FTIR spectral studies (Figs. 1 and 2), using KBr pellet method.
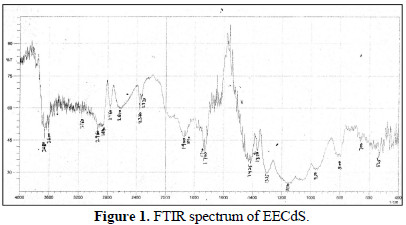
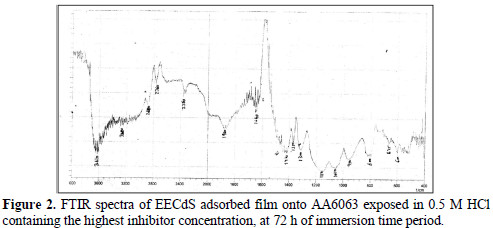
To understand the inhibitor adsorption mechanism, the peaks in the spectra were identified for various functional groups present in EECdS, and in AA6063 corrosion products, which are shown in Table 1.
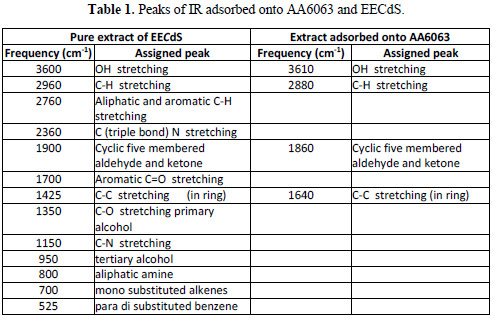
It was found that the OH stretch at 3600 cm-1 shifted to 3610 cm-1, the C-H stretch at 2960 cm-1 shifted to 2800 cm-1, and cyclic five member aldehyde and ketone stretchs at 1900 cm-1 shifted to 1860 cm-1. EECdS spectra values indicated that there was an interaction between EECdS and the metal surface, and that these functional groups were involved in the formation of a bond with AA6063. Moreover, it can be affirmed that the functional groups have coordinated with the Al3+ formed on the metal surface, resulting in the Al3+ extract complex formation on the metal surface, which promoted the coupon surface corrosion inhibition [28-29].
Weight loss measurements
The inhibitor effect on AA6063 acid corrosion was studied using the weight loss technique at room temperature, during various immersion time periods. Corrosion and adsorptive parameters such as corrosion rate (ρcorr) (in mmy-1), percentage inhibition efficiency (IE%), fractional surface coverage (Θ), adsorption equilibrium constant (Kad), etc., have been calculated, and are included in Table 2.
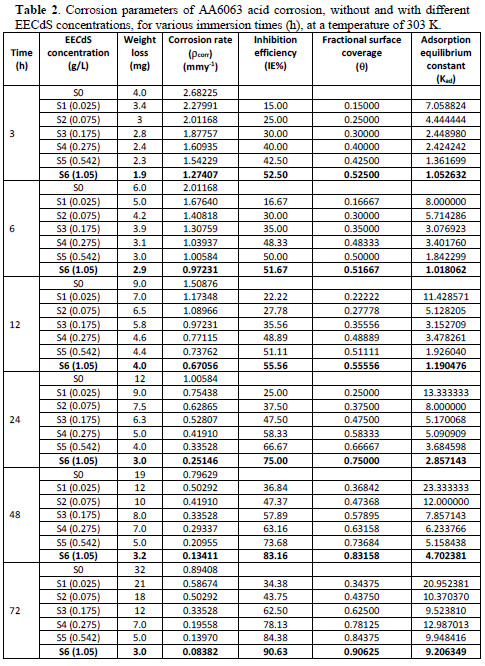
It has been observed from Fig. 3 and Table 2 that the weight loss decreased with EECdS addition.
This trend may result from the fact that the adsorption and surface coverage increase with higher inhibitor concentrations. Thus, the surface is efficiently protected from the medium. The adsorption of such compounds onto the metal surface creates a barrier for charge and mass transfer, leading to a decrease in the interaction between the metal and the corrosion solution. The presence of this barrier film inhibits the metal surface corrosion [32-33].
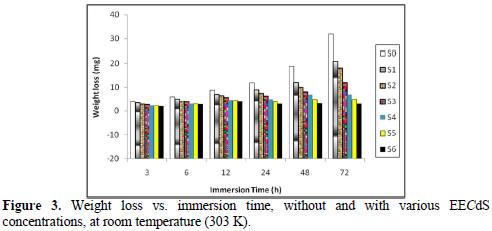
Fig. 4 represents the effect of varying EECdS concentrations and increasing immersion times on the AA6063 specimen corrosion rate, in uninhibited and inhibited solutions.
It was observed that the corrosion rates were lower than the value obtained for the blank solution, indicating that EECdS addition inhibits AA6063 corrosion. The corrosion rate decreased as the inhibitor concentration increased. This behavior is the result of EECdS increased adsorption and coverage onto the metal surface. The corrosion rate, with respect to the immersion time period in an uninhibited solution, sharply decrease up to 48 h; after that, for an immersion time period of 72 h, a slightly increase was observed. This means that, at higher immersion time periods, a corrosion product was formed. At lower inhibitor concentrations, the same trend was observed, but at higher inhibitor concentrations, the corrosion rate decreased with an increased period of contact. The minimum corrosion rate was found to be 0.0832 mmy-1, at 72 h, for the highest inhibitor concentration (1.05 g/L), thus clearly indicating that, at higher immersion time periods, the corrosion rate was observed to be independent from EECdS concentration.
Variation in inhibition efficiency with immersion time and inhibitor concentration
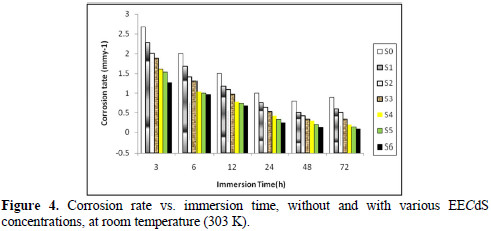
The effect of the exposure time variation on the stability of EECdS inhibitive behavior has been shown in Fig. 5, which reveals the increase in inhibition efficiency (90.63%), at 72 h. Further good inhibition efficiency was obtained for the lowest inhibitor concentration, at longer immersion time periods, which means that lower concentrations are sufficient for inhibiting corrosion.
Fig. 6 shows the variation in IE% with the variation in the inhibitor concentration.
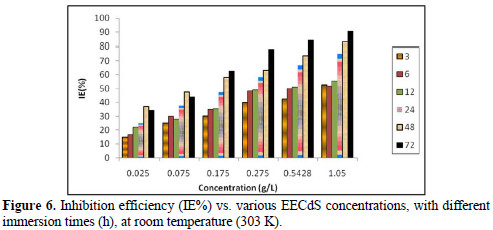
It was observed that IE% increased with higher inhibitor concentrations, and the maximum IE% value was found to be 90.63%, for a concentration of 1.05 g/L. The increase in IE% with higher concentrations indicates an increase in the number of components adsorbed onto the metal surface, by blocking the active sites.
Effect of temperature on the inhibition efficiency and corrosion rate
The effect of temperature variation is very complex, because many changes occur on the metal surface, such as inhibitor desorption, rapid etching and, moreover, it may undergo decomposition at high temperatures. Hence, the temperature (in the range of 293-353 K) effect on the adsorption and activation parameters was also studied. Weight loss measurements were carried out in the absence and presence of various inhibitor (EECdS) concentrations, at an immersion time period of 72 h.
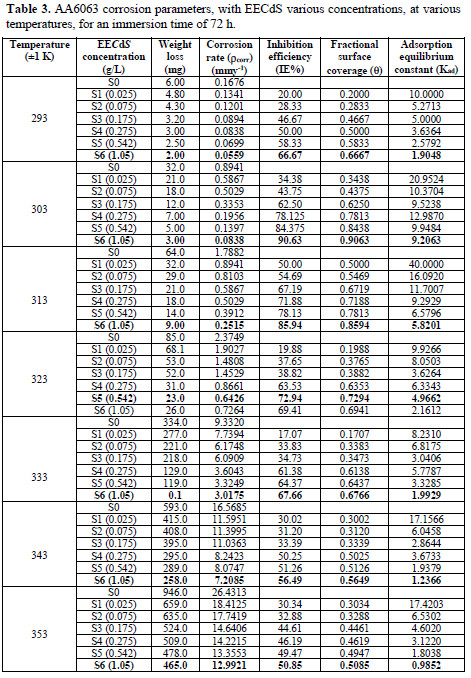
From the experimental data, corrosion parameters such as corrosion rate (ρcorr) (mmy-1), IE (%), fractional surface coverage (Θ) and adsorption equilibrium constant (Kad), etc., were obtained, and are shown in Table 2 and Fig. 7.
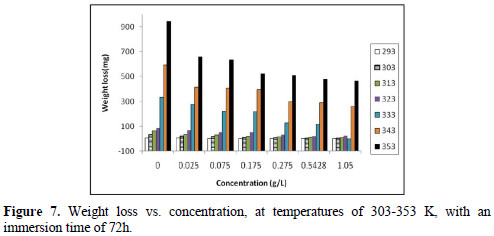
Table 3 and Fig. 8 show the effect of EECdS concentration variation on the weight loss and corrosion rate, at different temperatures, which clearly indicates that there was a progressive increase in the corrosion rate as the temperature is increased, and a decrease with higher EECdS concentrations, for an immersion time period of 72 h.
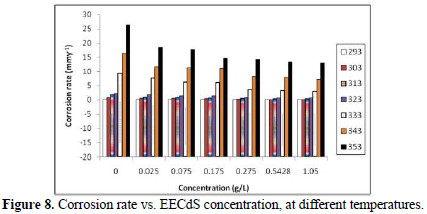
These findings confirm that the corrosion rate is dependent on temperature and concentration. The minimum corrosion rate was observed at 293 K, at the highest inhibitor concentration (1.05 g/L.
Table 3 and Fig. 9 illustrate the effect of IE% variation on different temperatures, at different EECdS concentrations.
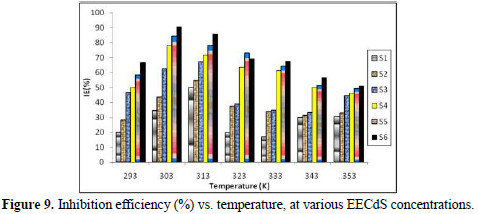
The obtained data reveal that the highest IE% found at room temperature was 90.63%, which decreased with an increase in temperature. It was found that the inhibition efficiency increased with higher EECdS concentrations, at all temperatures, which means IE is dependent on the concentration. But at a temperature of 323 K, an exception was found, where the second highest concentration yielded maximum inhibition efficiency.
The continual decline in the inhibition efficiency with the increase in temperature may be due to the thermal agitation, as well as to the desorption process occurring because of the breakdown of bulky molecules in smaller size molecules. It has also been found that, at higher temperatures, lower amounts of inhibitor inhibit the corrosion process. Cordia dichotoma (lashooda) is found in regions (e.g., Rajasthan), where temperatures range from 22 to 50 °C, during the year. The results of this study reveal that Lashooda has good inhibition efficiency in the reported temperature range.
Kinetic treatment of weight loss results
AA6063 corrosion reaction for the uninhibited and inhibited solutions obeys the kinetic relationship :
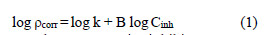
where k is the rate constant, equal to ρcorr at unity inhibitor concentration; B is the reaction constant which, in the present case, is the measure for the inhibitor effectiveness; and Cinh is EECdS concentration. Fig. 10 represents the curves of log ρcorr versus log Cinh, at various temperatures, for an immersion time period of 24 h.
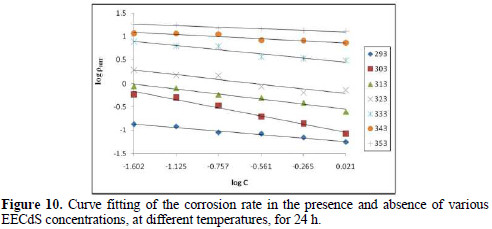
The straight lines show that the kinetic parameters (k and B) can be calculated by eq. 1.
The data obtained from the plots are shown in Table 4.
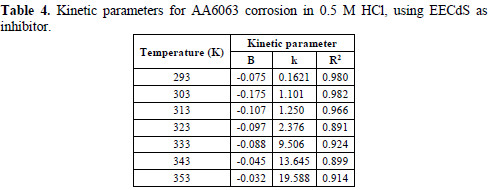
The negative sign of the B constant reaction values indicates that the corrosion rate process is inversely proportional to the inhibitor concentration, meaning that the inhibitor becomes more effective with increasing concentrations. The high negative B value observed at room temperature, when the change in .corr with the inhibitor concentration became steep (high negative value for constant B), reflected good inhibitive properties for EECdS. The k value increased with rising temperatures. At each temperature, a linear variation was observed in EECdS presence, thus confirming a first order kinetics [34].
Kinetic parameters of activation energy
The temperature study on the corrosion kinetic process in an acidic medium (0.5 M HCl), in the adsorbed inhibitor presence, provides more information about the adsorption nature, to evaluate the activation process. The relationship of Al corrosion rate (ρ) in an acidic medium with temperature (T) is given by Arrhenius equation :
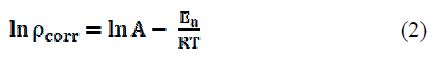
where ρcorr is the corrosion rate, Ea is the apparent activation energy, R is the molar gas constant (8.314 J K-1 mol-1), T is the absolute temperature, and A is the frequency parameter. The plot of ρcorr vs. 1/T gave a straight line, as shown in Fig. 11.
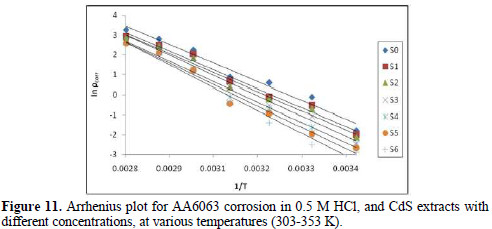
Ea values calculated from the plots in Fig. 11 are shown in Table 5.
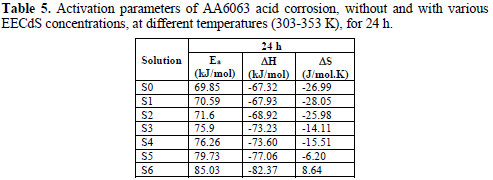
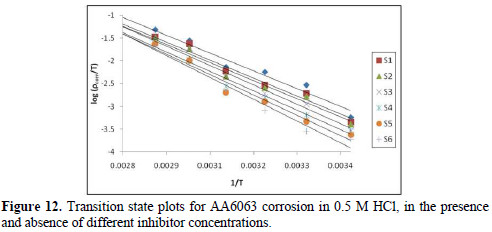
The kinetic parameters, the enthalpy of activation (ΔH) and the entropy of activation (ΔS) for AA6063 corrosion in an acidic medium were obtained by the transition state equation :
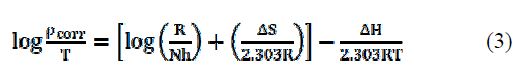
where h is the Plank's constant, N is the Avogrado's number, ΔH is the enthalpy of activation and ΔS is the entropy of activation. A plot of log ρcorr/T versus 1/T produces a straight line (Fig. 12), with a slope of ΔH/2303RT and an intercept of [log R/Nh + ΔS/2303R], from which ΔH and ΔS values were calculated and presented in Table 5.
The values show that EECdS addition led to an increase in the apparent activation energy to a value greater than that of the uninhibited solution, indicating a physical adsorption of the extract onto the metal surface. These results show a decrease in metal dissolution, which is due to a hindrance of the specimen surface by the formation of the metal complex layer [35-37].
The negative sign of enthalpy (ΔH) reveals that the inhibitor molecules adsorption is an exothermic process. The shift towards positive values of entropy (ΔS) implies that the activated complex in the rate determining step represents dissociation rather than association, meaning that disordering increases on going from the reactant to the activated complex.
From the known thermodynamic relation between Ea and ΔH (Fig. 13):
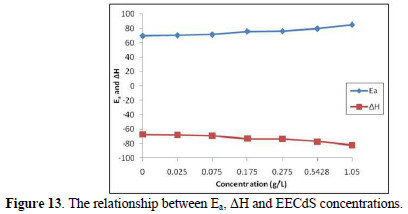
The average difference in Ea+-ΔH is 2.7 kJ/mol, approximately equal to RT (2.63 kJ/mol), indicating that the corrosion reaction is unimolecular, and that the inhibitor equally acted on Ea+ and ΔH.
Thermodynamic parameters
The most important thermodynamic adsorption parameters are the free energy of adsorption (ΔGads), the heat of adsorption (ΔHads) and the entropy of adsorption (ΔSads). The standard free energy of adsorption (ΔGads), which characterizes the adsorption molecules and metal surface interaction, along with other parameters, was evaluated using this equation :
where 55.5 is the water concentration of the solution in mL/L.
The thermodynamic parameters, ΔHads and ΔSads, for EECdS adsorption onto the AA6063 surface, were calculated from the following equation :

where ΔHads and ΔSads are the variations of enthalpy and entropy of adsorption process. The dependence of ΔGads on T indicates an appropriate relationship between thermodynamic parameters. The calculated values are given in Table 6.
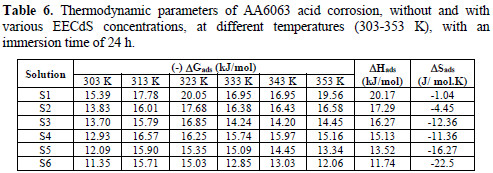
ΔGads negative values ensure the spontaneity of the adsorption process, and the stability of the adsorbed layer onto the specimen surface. Generally, ΔGads values around -20 kJ/mol, or lower, are consistent with physisorption, while those around -40 kJ/mol or higher involve chemisorption. In the present case of study, ΔGads values were lower than -20 kJ/mol, indicating physical adsorption of the molecule onto the AA6063 surface.
Adsorption isotherm
The degree of surface coverage (θ) for various inhibitor concentrations has been calculated by weight loss technique. The increase in surface coverage with higher inhibitor concentrations shows that more inhibitor molecules were adsorbed onto the AA6063 surface. If molecular adsorption at the metal /solution interface is the mechanism through which the corrosion inhibition occurs, several adsorption isotherms can be tested. The simplest of these, known as the Langmuir adsorption isotherm, was found to be suitable for the experimental findings, and has been used to describe the adsorption characteristics of this inhibitor. Langmuir isotherm was tested for its fitness to the experimental data. The plot of C/∅ versus C is a straight line graph (shown in Fig. 14), which proves that this adsorption isotherm was obeyed, for each immersion time, at the studied concentration range.
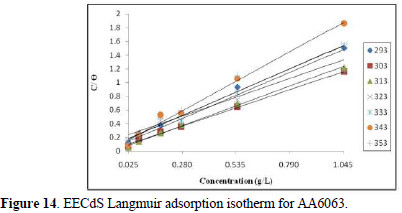
The correlation coefficient and slopes, obtained from Langmuir isotherm plots, are given in Table 6. The linearity degree of Langmuir adsorption isotherm, as measured by R2+ value in the range of 0.998 = r2 = 0.992, is nearly equal to one. There is a deviation of the slopes from unity, at higher temperatures, from ideal Langmuir isotherm, but at lower temperatures, the slope is almost unity. This indicates that the assumptions and the deductions were correct.
A monolayer of the inhibitor species must have been attached to the coupon surface, without lateral interaction between the adsorbed species. Kads values are shown in Table 7.
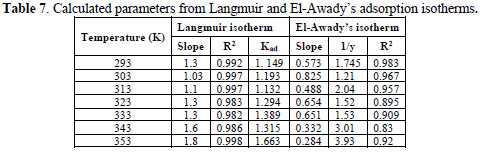
All the values are low, which suggests physisorption of EECdS and AA6063 active constituents.
The experimental data were fitted into the El-Awady's kinetic/thermodynamic model (Fig. 15), given by:
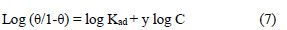
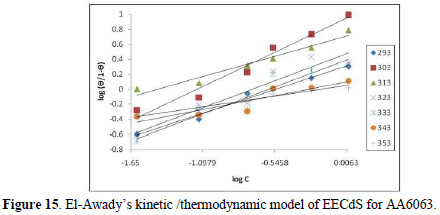
where C is EECdS concentration, θ is the degree of surface coverage, Kad is the equilibrium constant of the adsorption process, and Kad = K1/y. In this model, the number of y active sites has been included. 1/y values lower than one imply multilayer adsorption, while values greater than one suggest that the inhibitor molecules occupied more than one active site.
From Table 7, it is seen that values are greater than one, showing that EECdS molecules occupy more than one active site.
Electrochemical measurements
Potentiodynamic polarization studies
Electrochemical corrosion kinetic parameters, such as corrosion potential (Ecorr), anodic Tafel's slopes and inhibition efficiency were calculated from both Tafel's and linear polarization curves, which are presented in Table 8.
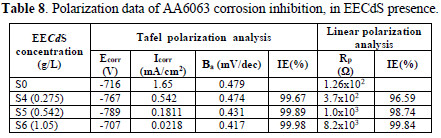
The experiments were carried out with three inhibitor concentrations, for which the maximum IE% was obtained.In Table 8, the lower corrosion current density (Icorr) values, in the inhibitor presence, and an appreciable increase in Rp values suggest that EECdS was adsorbed onto the AA6063 surface, thus blocking the corrosion reaction. There was no significant change in the corrosion potential, which suggests the mixed nature of the inhibitor [39]. The obtained data also suggest that the inhibitor acted as a mixed type inhibitor, because it enhanced both cathodic and anodic processes [40-42]. Ecorr values shifted to less negative values with the increase in the inhibitor concentration. IE% and . values are in excellent agreement with the weight loss measurements values.
Electrochemical impedance studies
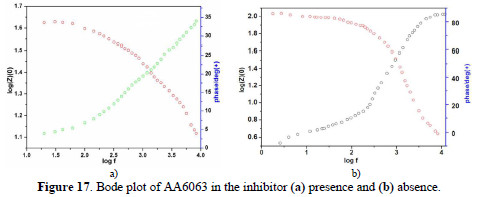
EIS results at room temperature and Nyquist plots at different concentrations are shown in Figs. 16 (a and b), along with corresponding Bode plots in Figs. 17 (a and b).
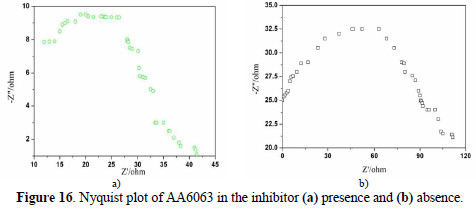
Various impedance parameters, such as charge transfer resistance (Rct), double layer capacitance (Ccdl) and the corresponding IE% were calculated from these plots, and are shown in Table 9.
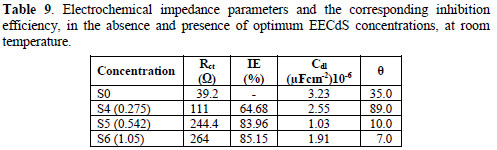
The charge transfer resistance (Rct) values have been calculated from the difference in the impedance at low and high frequencies. The double layer capacitance values were estimated from the frequency (f), at which the imaginary component of the impedance (-Z ") is maximum.
The IE (%) values from EIS measurements were calculated from Rct, using the relation :

where Rct inh and Rct0 are the charge transfer resistances, in the inhibitor absence and presence, respectively.
From the impedance parameters, it can be seen that AA6063 corrosion was decreased in the inhibitor presence, as the charge transfer resistance was significantly increased. The decrease in Cdl values indicates the EECdS molecule adsorption onto the metal surface. Decrease in Cdl can result from a decrease in the local dielectric constant, or from an increase in the electrical double layer thickness, suggesting that EECdS functions by adsorption at the metal-solution interface [43-44]. The changes in Rct and Cdl values are caused by the gradual replacement of water molecules by the organic molecules adsorption onto the metal surface, decreasing the extent of the dissolution reaction. The semicircle obtained from the present system indicates that the inhibitor molecules adsorption is charge transfer controlled [45-46]. The IE% was found to be 85.15 %, at the highest concentration from Rct.
Scanning electron microscopy (SEM) analysis
The AA6063 specimens that were used to investigate EECdS corrosion inhibition effect in the acidic environment were also studied with SEM. The SEM photographs for the corroded (without and with inhibitor) coupons are seen in Fig. 18.
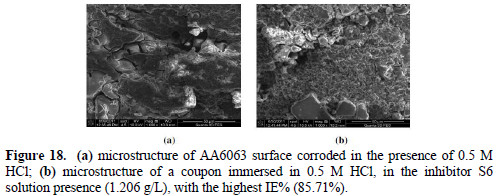
The surface morphologies reinforce the inference that the inhibitor prevents the metal surface decay. It is clearly seen that the metal surface dipped in 0.5 M HCl without inhibitor had a more pronounced depth of pitting, compared to the one with EECdS.
From the mass loss measurements, it was found that EECdS is a good AA6063 corrosion inhibitor in an acidic environment (0.5 M HCl). At lower temperatures, the inhibitor has obeyed Langmuir adsorption isotherm, but, at higher temperatures, deviation was observed. The experimental data followed the El- Awady's kinetic/thermodynamic model. A strong and spontaneous interaction between the extract and the AA6063 surface was indicated by the activation energy values and thermodynamic parameters. The presence of an adsorbed layer of extract onto the specimen's surface was justified by FTIR and SEM measurements. FTIR values showed that strong links between the metal and the extract surface were formed, due to CdS constituents (oxygen and nitrogen). EIS measurements reconfirm the other observations. SEM photographs showed the formation of a protective layer on the specimen surface, which inhibits AA606 corrosion.
Conclusions
From the study it has been concluded that:
1. EECdS acts as a good inhibitor for AA6063 alloy acid corrosion. EECdS inhibition efficiency increases with higher concentrations at all temperatures, while decrease in IE is detected with increasing temperatures, depending on the inhibitor concentration and temperature.
2. EECdS inhibits corrosion up to 90.13% in an acidic medium, with the highest concentration (1.05 g/L), at room temperature.
3. EECdS was found to obey Langmuir adsorption isotherm from the experimental data fit at room temperature, while at elevated temperatures, deviation from ideal Langmuir adsorption isotherm was observed. The experimental data were also fitted into the El-Awady's kinetic/thermodynamic model.
4. The free energy of adsorption value indicates strong, spontaneous and physical EECdS adsorption onto the AA6063 surface.
5. The EECdS extract presence increases the activation energy of the corrosion process, and adsorption heat gave a negative value.
6. The thermodynamic data for the inhibitor adsorption and AA6063 acid corrosion suggested the physical adsorption occurrence of the inhibitor species.
7. Entropy's (.S) shift towards positive values indicated the increase in disordering, on moving from the reactant to the activated complex.
8. FTIR spectra showed that the organic molecules present in the inhibitor were involved in the inhibition process.
9. The electrochemical measurements reconfirmed the results of other techniques.
10. SEM photographs further confirmed the formation of a protective film onto the Al alloy surface by the green inhibitor.
References
1. Sastri VS. Green Corrosion Inhibitors: Theory and Practice. United Kingdom: Wiley; 2012. [ Links ]
2. Nnanna LA, Onwuagba BN, Mejeha IM, et al. J Corros Sci Eng. 2010;13: 1466. [ Links ]
3. El-Etre AY, El-Tantawy Z. Port Electrochim Acta. 2006;24:347. [ Links ]
4. Oguzie EE. Pigm Res Tech. 2006;35:334; [ Links ]
5. Sharma YC, Sharma S. Port Electrochim Acta. 2016;34:365. [ Links ]
6. Vukasovich MS, Farr JPG. Mater Performance. 1986;25:9.
7. Sharma S. J Int Sci Tech. 2016;4:37.
8. Branzoi V, Gplgovici F. Mater Chem Phys. 2002;78:122. [ Links ]
9. Elewady GY, Isaid IAE, Founda AS. Int J Electrochem Sci 2008;3:177. [ Links ]
10. Eddy NO. Int J Phys Sci. 2009; 4:165. [ Links ]
11. Consolacion YR, Virgilio E, et al. J Appl Pharm Sci. 2015;5:16. [ Links ]
12. Jamkhande PG, Barde SR, Patwekar SL, et al. Asian Pac J Trop Biomed. 2013;3:1009. [ Links ]
13. Chandra SPS, Puneeth HR, Mahadimane PV,et al. Adv Sci Lett. 2017;23:1823. [ Links ]
14. Oza MJ, Kulkarni YA. J Pharm Pharmacol. 2017. doi:10.1111/jphp.12715. [ Links ]
15. Obot IB, Obi-EgbedI NO. Int J Electrochem Sci. 2009; 4: 1277. [ Links ]
16. Singh R, Lawania RD, Mishra A, et al. Int J Pharm Sci. 2006;2:21. [ Links ]
17. Khandelwal R, Sahu S, Arora SK, et al. J Corros Sci Eng. 2010;13:1466. [ Links ]
18. Sharma US, Sutar UK, Singh A, et al. Int J Pharm Ana. 2010;2:1. [ Links ]
19. Srivastava SK, Srivastava SD. Phytochemistry. 1979;18:205. [ Links ]
20. Eddy NO. Portug Electrochim Acta. 2009;27:579. [ Links ]
21. Khandelwal R, Arora SK, Mathur SP. E-J Chem. 2011;8:1200. [ Links ]
22. Cramer SD, Covino Jr BS. ASM Handbook Volume 13A: Corrosion: Fundamentals, Testing, and Protection. US: ASM International; 2003. [ Links ]
23. Fontana MG. Corrosion: A Compilation. Ohio: The Press of Hollenback; 1957. [ Links ]
24. Fontana MG, Greene ND. Corrosion Engineering. New York: McGraw- Hill; 1967. [ Links ]
25. Bard AJ, Faulkner LR. Electrochemical Methods, Fundamentals and Applications. 2nd ed. New York: John Wiley & Sons; 2000. [ Links ]
26. Smith BC. Fundamentals of Fourier transform infrared spectroscopy. London: CRC Press; 1996. [ Links ]
27. Bokris JO'M, Reddy AKN. Modern Electrochemistry- Electrodics in Chemistry, Engineering, Biology and Environment Science. 2nd ed. New York: Kluwer Academic/ Plenum Publ; 2000. [ Links ]
28. Kalsi PS. Spectroscopy of Organic Compounds. 6th ed. New Delhi: New Age Int Publ; 2004. [ Links ]
29. Mertz J. Introduction to optical microscopy. Greenwood Village, Colorado: Roberts; 2010. [ Links ]
30. Goodhew PJ, Humphreys J, Beanland R. Electron microscopy and analysis. 3rd ed. Oxford: Taylor & Francis; 2000. [ Links ]
31. Egerton RF. Physical principles of electron microscopy: an introduction to TEM, SEM, and AFM. Berlin: Springer; 2005. [ Links ]
32. Chauhan R, Garg U, Tak RK. E-J Chem. 2011;8:85. [ Links ]
33. Singh A, Singh VK, Quraishi MA. Int J Corr. 2010;275983:1. [ Links ]
34. Singh A, Ahamad I, Singh VK, et al. J Solid State Electrochem. 2011;15:1087. [ Links ]
35. Lebrini M, Robert F, Roos C. Int J Electrochem Sci. 2010;5:1698. [ Links ]
36. Atkins PW. Chemisorbed and Physisorbed Species. A Textbook of physical Chemistry. Oxford: Oxford University Press; 1980. [ Links ]
37. Atkins PW. Physical Chemistry. Oxford: Oxford University Press; 2002. [ Links ]
38. Raps D, Hack T, Wehr J, et al. Corros Sci. 2009;51:1012. [ Links ]
39. Subha R, Saratha R. J Corros Sci Eng. 2006;10:1466. [ Links ]
40. El-Meligi AA. Int J Hydro Ene. 2011;36:10600.
41. Ekanem UF, Umoren SA, Udousoro II, et al. J Mater Sci. 2010;45:5558. [ Links ]
42. Al-Turkustani AM, Arab ST, Al- Reheli AA. Int J Chem. 2010;2:54. [ Links ]
43. Garg U, Tak RK. E-J Chem. 2010;7:1220. [ Links ]
44. Giovanardi R, Fontanesi C, Dallabarba W. Electrochim Acta. 2011;56:3128. [ Links ]
45. Obot IB, Umoren SA, Obi-Egbedi NO. J Mater Environ Sci. 2011;2:60. [ Links ]
46. Umoren SA, Ekanem UF. Chem Eng Comm 2010; 197:1339. [ Links ]
*Corresponding author. E-mail address: hashe.sharma@gmail.com
Received May 19, 2017; accepted February 28, 2018

