


Services on Demand
Journal
Article
 English (pdf)
 Article in xml format
 Article references
 Send this article by e-mail
Indicators
-
 Cited by SciELO
 -
 Access statistics
Related links
-
 Similars in
SciELO
Similars in
SciELO
Share

 Permalink
Portugaliae Electrochimica Acta
Print version ISSN 0872-1904
Port. Electrochim. Acta vol.36 no.6 Coimbra Nov. 2018
https://doi.org/10.4152/pea.201806423
Evaluation of the Electrochemical Impedance Measurement of Mild Steel Corrosion in an Acidic Medium, in the Presence of Quaternary Ammonium Bromides
A. Popovaa,*,A. Vasilevb and T. Deligeorgievb
a Department of Physical Chemistry, University of Chemical Technology and Metallurgy, 8 K. Ohridski Blvd., 1756 Sofia, Bulgaria
b Faculty of Chemistry, University of Sofia, 1 J. Baucher Ave, 1126 Sofia, Bulgaria
Abstract
Three quaternary ammonium bromides were investigated as mild steel corrosion inhibitors in 1 M HCl. Two investigation methods were applied: electrochemical impedance spectroscopy (EIS) and polarization resistance (Rp method). The experimental impedance data showed capacitance frequency distribution, which imposed the introduction of a constant phase element, instead of a pure capacitance. Adequate structural models were advanced, to describe the interfacial processes. The models parameters values were determined. The resistance values found by impedance spectroscopy were compared to those of the polarization resistance provided by the Rp method. The inhibition efficiency of the investigated compounds was evaluated by both applied methods. The comparison of the investigated compounds protective properties outlined the best among them.
Keywords: Smart polymers, pristine polypyrrole, SILAR, tailor made polymers and supercapacitor.
Introduction
The industrial practice often uses acidic aqueous media, but the increased corrosion there observed requires the application of specific protection methods, in view of the particular conditions. Corrosion inhibiting protection is one of the methods applied to decrease corrosion losses. Organic compounds are often used as inhibitors [1-3] in acidic media, but their wide application requires designing additional substances with effective protective properties. This process is based on the correlation between the molecular structure of the organic compounds and their inhibiting properties [4-17]. The substances of the quaternary ammonium salts group [18-21] show good inhibitive properties in acidic media. This determined our interest towards these compounds [22-24].
The practice requires reliable data on the inhibiting effect of the studied compounds obtained by different investigation methods, which in turn provide a correct comparison of the inhibitors. The electrochemical impedance spectroscopy method has been finding increased application [25-49]. It provides information on the interfacial processes which model them as equivalent electric circuits.
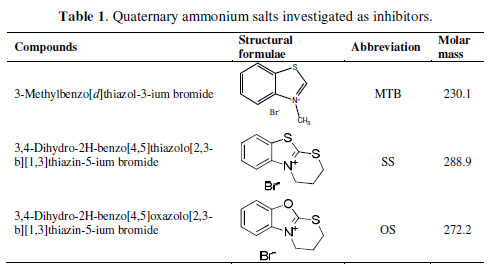
The present investigation is aimed at the study of the inhibiting properties of three quaternary ammonium bromides, in the case of mild steel corrosion in 1 M HCl (Table 1).
The compounds were synthesized to correspond to the above pointed aim, and have so far not been studied. Two electrochemical methods were applied – the alternating current electrochemical impedance spectroscopy method, and the direct current of polarization resistance method (Rp method).
Experimental
The mild steel used in the present investigation had the following chemical composition (wt %): 0.16 C, 0.35Mn , 0.01 P, 0.016 Si, 0.029 S, 0.06 Cr, 0.10 Cu, and Fe to reach a balance. All investigated compounds were synthesized accordingly to the study aim. They were purified by re-crystallization from ethanol to analytically purity grade [51]. A 1 M HCl solution was prepared using 37% HCl (pure for analysis) and distilled water. The experiments were carried out using a conventional three-electrode electrochemical cell.
The working steel electrodes (WE) had cylinders pressed into Teflon holders with an exposed area of 0.5 cm2. A saturated calomel electrode (SCE) connected through a salt bridge was used as reference electrode, while a large area platinum leaf served as counter electrode. Before each experiment, the WE was wet abraded with 600 grade emery paper, rinsed with distilled water and an ethanolether mixture, and afterwards immediately inserted into a glass cell containing 250 mL of the electrolyte solution.
The impedance measurements began 2 hours after immersing the WE into the static solution [36]. The temperature was maintained at 22±1 ºC. EG&G instruments electronic equipment was used. It included a PAR Model 273 Potentiostat and a 5208 two phase lock-in analyzer connected to an IBM personal computer via GPIB-II interface. Two programmes, M378 and PARCalc M342, were used to collect and evaluate the experimental data.
The response of the electrochemical system to an ac excitation, with a frequency ranging from 95 kHz to 0.1 Hz and peak to peak ac amplitude of 5 mV, was followed. The lock-in amplifier technique with 5 points per decade was used for frequencies varying from 5 Hz to 95 kHz. Measurements below 10 Hz were carried out using the fast Fourier transformation (FFT) technique with 8 data cycles. All EIS spectra were recorded at the open-circuit potential (OCP), i.e., at the corrosion potential (Ecorr). One spectrum was usually recorded within 8 min. Various equivalent circuit models were fitted to the impedance data, using a nonlinear least square fit procedure.
The polarization resistance (Rp) measurements were immediately performed after the impedance spectra recording, using the same electrode, without any additional surface treatment. The applied polarization referred to about ± 10 mV vs. Ecorr, at a scan rate of 0.1 mV s-1. Five independent experiments were carried out for each inhibitor concentration. The mean values and the standard deviations were obtained.
Results and discussion
The impedance spectra (IS) were recorded in the presence of the three investigated compounds (Table 1), varying their concentration. The upper limit of the concentration range was ruled by the compound solubility, as further increases in concentration (ci) did not result in any essential variation of the corresponding inhibiting effect.
A change in the IS shape was observed, depending on the type of the investigated compound and on its concentration. The impedance spectrum presented in the complex plane (or the so called Nyquist plot) contains a single semicircle (Fig. 1a) in the presence of low SS (10-6 M – 10-4 M) and SO (10-6 M – 10-5 M) concentrations.
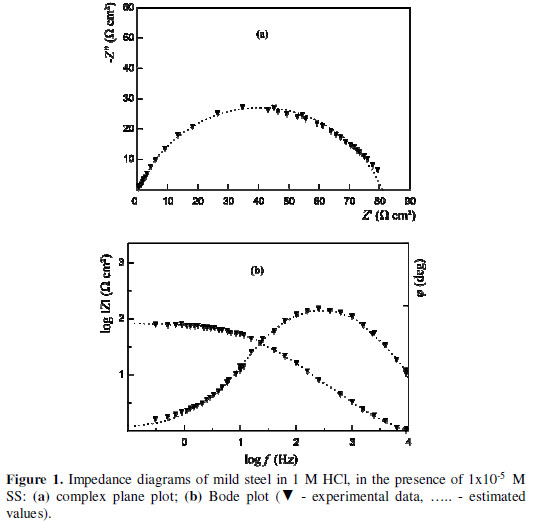
The same was valid for the whole studied MTB concentration interval. The Bode plot shows the corresponding symmetric change in the phase angle (f), as a function of the frequency (f) in Hz (Fig. 1b).
This type of impedance spectrum corresponds to a Z transfer function (.), which is presented by a resistance (R1) connected in parallel to a capacitor (C). An additional resistance (R2) was consequently connected to them, i.e:
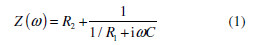
where i = -1 , while . is the angular frequency in rad. Such a transfer function is used to describe the impedance behavior of homogeneous systems characterized by a single time constant (t).
It is worth noting that the center of the capacitance semicircle lies under the abscissa (Fig. 1a). This depression is described by a frequency distributed parameter such as CPE (constant phase element), which substitutes the pure capacitance (C). The impedance of such an element is described [26, 27, 38, 50] by:

where A is a coefficient of proportionality, while n stands for a phase shift.
Different physical phenomena with a frequency dispersion behavior can be described by CPE. The observed capacitance semicircle depression is an expression of the surface inhomogeneity, which is due to surface roughness, contaminations, active centers distribution, formation of porous layers, inhibitors adsorption, etc. [26, 27, 39-40]. The phase shift (n) can be used as a measure of the surface inhomogeneity [25].
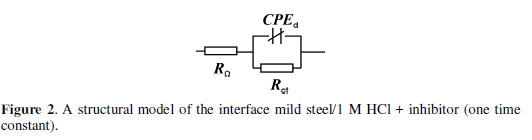
The quantitative analysis of the impedance data is based on a physical model of an electrochemical corrosion process with hydrogen depolarization and activation control. The proceeding of the electrochemical reaction is presented by the charge transfer resistance through the metal/electrolyte interface (Rct); it corresponds to R1 in Eq.1. The sum of the solution resistances and metal conductors is presented by the ohmic resistance (RO), which corresponds to R2. The double electric layer capacitance arising at the interface is represented by CPE, which is a distributed structural element. The following structural model with a single time constant (Fig. 2) is advanced for the processes at the metal/electrolyte interface, in the presence of small SS and SO concentrations, as well as for the whole MTB concentration range.
The calculated values of the model parameters are summarized in Tables 2 to 4.

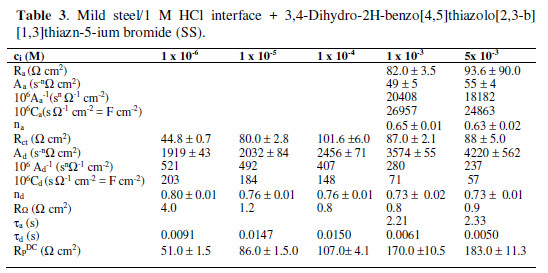
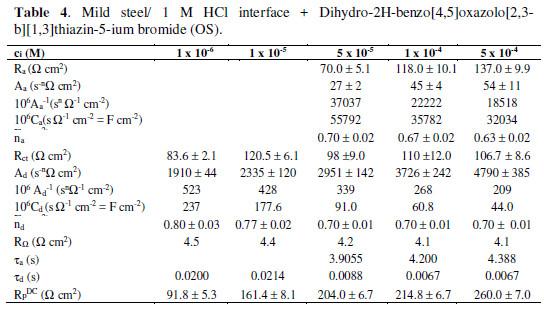
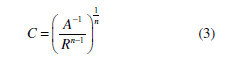
Fig. 1 illustrates the fit of the model parameters to the experimental data. The CPE data (A and n) values provide the capacitance (C) determination [41]:
The relaxation time (t) of the surface state, i.e. the time required for the charge distribution to return to its equilibrium state (in this case, to its stationary state), following an electric disturbance, is calculated by:

where C is the capacitance, while R is the resistance accompanying the capacitance. The above pointed tables also show the polarization resistance values, ( DC p R ), obtained by the applied direct current polarization (Rp) method.
The simple equivalent scheme with a single time constant (Fig. 2) describes the impedance spectra for the whole concentration range in MTB presence. The following changes in the obtained electrochemical parameters were observed with an increase in concentration: (i) Rct value increased, which indicates an improvement in protective properties; (ii) the double layer capacitance value, Cd, (Fcm-2) decreased, which is often observed, in the case of organic molecules adsorption onto the metal surface; (iii) nd value also showed a decrease tendency attributed to the increase in the surface inhomogeneity, which, in turn, results from the inhibitor adsorption; (iv) the time of the system relaxation (t) slightly increased, most probably due to the increase in the adsorbed species amount.
Analogous dependences are found with SS and OS low concentrations. This case is described by the structural model presented in Fig. 2. The same equivalent circuit is also valid for 1 M HCl, in the inhibitor absence [24, 27, 36].
The further increase in SS and SO concentrations leads to the identification of a second time constant in the impedance spectra (ta), connected to the adsorption process. The latter is present, even at lower concentration values in view of Rct value, but ta is a small term, and it is hard to discern from the double layer relaxation time constant (td). That is why a single time constant is observed in the impedance spectra. The ta value increases with higher concentrations, leading to its separation. This is expressed through the appearance of a second depressed capacitive semicircle at a lower frequency in the complex plane plot.
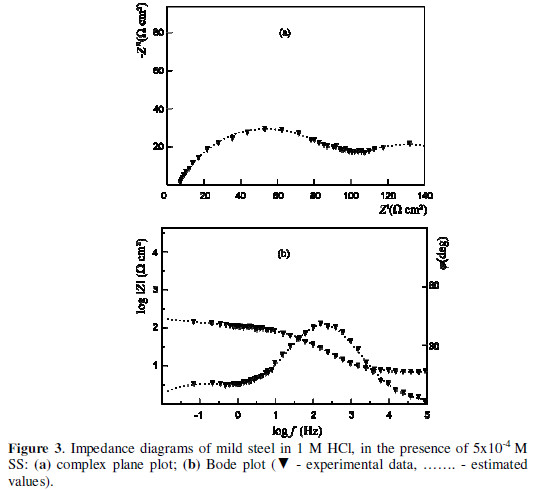
A characteristic change in the phase angle (j ), and the slope of the dependence of the impedance module log|Z|, as a function of the frequency, are outlined in the Bode plot (Figs. 3 and 4).
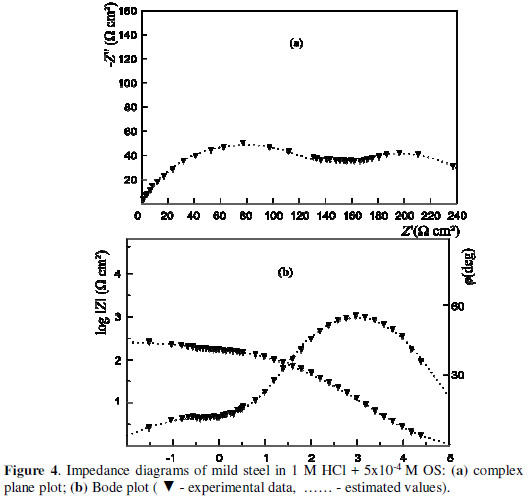
It is evident that the impedance spectra can not be described by the structural model of Fig. 2. A new structural model which includes the adsorption process is advanced (Fig. 5).
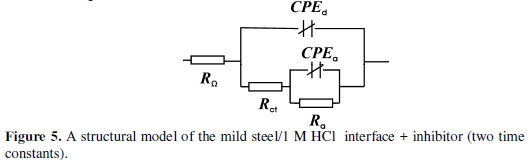
An additional element was included, while the combination of the adsorption resistance (Ra) and the capacitance was connected in parallel. The depression of the adsorption semicircle required its simulation by CPEa, as well.
The correlation between the parameters values, determined on the ground of the transfer function presented in Fig. 5, and the experimental data are illustrated in Figs. 3 and 4. Tables 3 and 4 list the values of the model structural elements.
The following dependences are observed with the increase in SS and OS concentrations, in the range of relatively high concentrations, where the second equivalent scheme of Fig. 5 is valid: (i) Ra and Rct increased, although the effect of the latter was smaller in SS case – this indicates an increased inhibiting effect; (ii) Ca and Cd decreased; (iii) nd value did not change, while that of na decreased, which can be attributed to the great energy dissipation in the adsorption layer; (iv) td had a low value, which insignificantly changed, while ta had an essentially greater value, showing an increase tendency. The relaxation time of the adsorption layer in OS presence was greater than ta in SS presence (OS was the best inhibitor among those investigated).
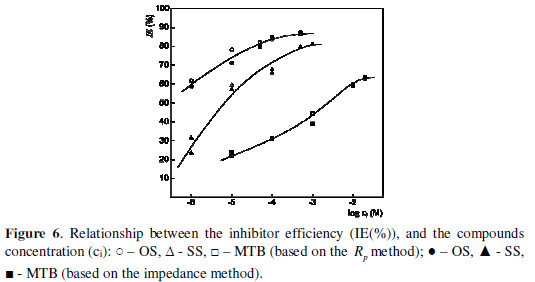
The total resistances are compared to Rp DC values determined by the Rp method. Rct value was close to that of Rp DC, when the metal/1 M HCl interface + inhibitor was described by the structural model with a single time constant (Fig. 2). Rct + Ra and DC p R values were compared when the equivalent scheme with two time constants was used. A very good agreement was found. RO value was very low, and this is why it was neglected. The inhibiting efficiency, IE (%), was estimated from DC p R value by:
where , DCp i R is the polarization resistance in the inhibitors presence, while ,0 DC p R is that in the inhibitors absence.
The IE (%) values were also determined using the impedance data (Rct or Rct + Ra). The values obtained by both methods are presented in Fig. 6, as a function of the inhibitors concentration. An increase in the inhibiting effect was observed with higher concentrations. This tendency is better expressed at lower concentrations. It is evident that OS has the best protective properties at all studied concentrations. It is followed by SS. MTB has significantly poorer protective properties, when compared to those of OS and SS. It is clear that this is due to the difference in the molecular structure of the investigated bromides.
The three compounds are quaternary ammonium bromides which dissociate in the investigated medium, to give ammonium cations and bromide anions (Br -). We assume an essential Br - contribution to the total protective effect, due to its specific adsorption onto the metal surface, which favors the attraction of cations from the solution (1-2), and facilitates the adsorption, caused by the attraction of the positive and negative charges present in the layer (2-2). The difference between the IE (%) of the different studied compounds refers to their cationic part.
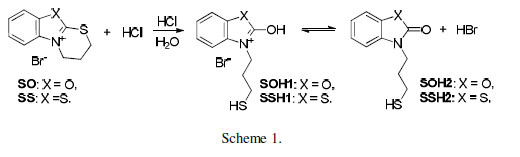
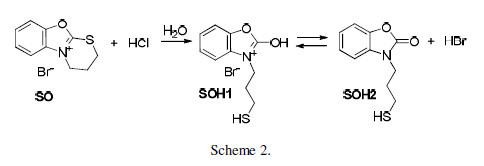
The significantly lower MTB protective properties can be explained by the smaller area of its cationic part. The latter is almost identical for both OS and SS, but there is a difference in their inhibiting properties. It is worth noting that this difference is not as great as that found when comparing it with MTB (Table 1). It can be suggested that the discussed difference is determined by the substances change undergone in an aqueous acidic medium. The dihydrothiazinium heterocycle was disrupted there, and a mercaptopropyl substituent was introduced into position 3 of the basic OS and SS heterocylcles.
Furthermore, two tautomeric forms exist in equilibrium - with oxazole (SOH1) and oxazolone (SOH2) structures, or with thiazole (SSH1) and thiazolone (SSH2) structures, respectively (Schemes 1 and 2).
It can be assumed that the considered disruption may not proceed to its completion. Hence, the solution will contain the basic form of SS and OS, together with the dihydrothiazine heterocycle. Most probably, the dynamic equilibrium with the participation of the three compounds forms in the solution, and the resulting variation in their concentrations, determined the difference in SS and OS inhibiting properties. It can further affect the observed solubility, which is lower for OS than for SS. The situation is rather complex, and it is hard to say which form determines a good inhibiting effect. We assume, at this stage of our investigations, that the researched compounds inhibiting properties are generally due to their cations physical adsorption, facilitated by the bromide anions on the metal surface.
Conclusions
The frequency dispersion of the interfacial impedance is affected by the concentration and molecular structure of the studied inhibitors.
The processes at the mild steel/1 M HCl interface + inhibitor were described by two adequate structural models. The first one provided good correspondence to the data obtained in MTB presence and at low SS and OS concentrations. It contained a charge transfer resistance (Rct), in parallel with the double layer capacitance, which was distributed and modeled by a constant phase element.
The processes at the interface with the presence of high SS and OS concentrations were described by a structural model containing two time constants: the first one was connected to the charge transfer and the double layer capacitance, while the second one was attributed to the adsorption process.
The time constants values were determined on the ground of the obtained parameters. The highest value of the adsorption time constant was found in OS (ta = 4.4 s) case.
DC p R values obtained by the independent direct current Rp method were juxtaposed to those of Rct or Rct + Ra, determined by the alternating current impedance method. The results were very close. The IE values were estimated. OS showed the best protective properties among the investigated compounds.
References
1. Rosenfeld I. Corrosion Inhibitors. Moscow: Khimiya; 1977. [ Links ]
2. Reshetnikov S. Acid Corrosion Inhibitors of the Metals. Leningrad: Khimia; 1986. [ Links ]
3. Avdeev Y, Kuznetsov Y. Russ Chem Rev. 2012;81:1133-1145. [ Links ]
4. Szauer T, Brandt A. Electrochim. Acta. 1981;26:1209-1217. [ Links ]
5. Foroulis Z. In Proceedings of the 6th European Symposium on Corrosion Inhibitors. Ann Univ Ferrara. NS Sez V Suppl N8;1985. [ Links ]
6. Ayers R, Hackerman N. J Electrochem Soc. 1963;110:507-513. [ Links ]
7. Donahue F, Nobe K. J Electrochem Soc. 1965;112:886-890. [ Links ]
8. Babic-Samardzija K, Hackerman N. J Solid State Electrochem. 2005;9:483- 497. [ Links ]
9. Rodriguez M, Requiz R, Ng H, et al. Anti-Corros Methods M. 2007;54:93- 98. [ Links ]
10. Ozcan M, Dehri I, Erbil M. Appl Surf Sci. 2004;236:155-164. [ Links ]
11. Wang H, Liu R, Xin J. Corrosion Sci. 46:2455-2466. [ Links ]
12. Popova A, Christov M, Raicheva S, et al. Corrosion Sci. 2004;46:1333- 1350.
13. Popova A, Sokolova E, Raicheva S, et al. Corrosion Sci. 2003;45:33-58. [ Links ]
14. Popova A, Christov M, Deligeorgiev T. Corrosion. 2003;59:756-764. [ Links ]
15. Saleh M, Atia A. J Appl Electrochem. 2006;36:899-905. [ Links ]
16. Schmitt G, Bedburg K. In Proceedings of 9th International Cong Metallic Corrosion. Toronto; 1984. p 112-119. [ Links ]
17. Stoyanova A, Slavcheva E. Mater Corros. 2011;62:872-876. [ Links ]
18. Li X, Tang L, Liu H, et al. Mater Lett. 2008;62:2321-2324. [ Links ]
19. Hegazy M, Nazeer A, Shalabi K. J Mol Liq. 2015;209:419-427. [ Links ]
20. Hegazy M, Abdallah M, Awad M, et al. Corrosion Sci. 2014;81:54-64. [ Links ]
21. Nahle A, Al-Khayat M, Abu-Abdoun I. Anti-Corros Methods M. 2013;60:20-27. [ Links ]
22. Popova A, Christov M, Vasilev A. Corrosion Sci. 2011;53:1770-1777. [ Links ]
23. Popova A, Christov M, Vasilev A, et al. Corrosion Sci. 2011;53:679-686. [ Links ]
24. Popova A, Christov M, Vasilev A. et al. Int J Corros Scale Inhib. 2015;4:382-393. [ Links ]
25. Lorenz W, Mansfeld F. Corrosion Sci. 1981;2:647-672. [ Links ]
26. Stoynov Z, Grafov B, Savova-Stoynova B, et al. Electrochemical Impedance. Moscow: Nauka; 1991. [ Links ]
27. Growcock F, Jasinski R. J Electrochem Soc. 1989;136:2310-2314. [ Links ]
28. Reinhard G, Rammelt U. In Proceedings of 7th European Symposium on Corrosion Inhibitors. Ann Univ Ferrara, NS Sez V, Suppl N9; 1990. [ Links ]
29. Li P, Lin J, Tan K, Lee J. Electrochim Acta 1997;42:605-615. [ Links ]
30. Lopez D, Simison N, de Sanchez S. Electrochim Acta 2003;48:845-854. [ Links ]
31. Garcia-Ochoa E, Genesca J. Surf Coat Technol. 2004;184:322-330. [ Links ]
32. Ma H, Cheng X, Chen S, et al. J Electroanal Chem. 1998;451:11-17. [ Links ]
33. Khaled K. Appl Surf Sci. 2004;230:307-318. [ Links ]
34. Li W, Zhao X, Liu F, et al. Corrosion Sci. 2008;50:3261-3266. [ Links ]
35. Avci G. Colloid Surf A: Physicochem Eng Aspects. 2008;317:730-736. [ Links ]
36. Popova A, Raicheva S, Sokolova E, et al. Langmuir. 1996;12:2083-2089. [ Links ]
37. Popova A, Christov M. Corrosion Sci. 2006;48:3208-3221. [ Links ]
38. Stoynov Z. Electrochim Acta. 1990;35:1493-1499. [ Links ]
39. Mulder W, Sluyters J. Electrochim Acta. 1988;33:303-310. [ Links ]
40. Rammelt U, Reinhard H. Corros. Sci. 1987;27:373-382. [ Links ]
41. Ma H, Cheng X, Li G, et al. Corrosion Sci. 2000;42:1669-1683. [ Links ]
42. Toshima S, Uchida T. Electrochim Acta 1970;15:1717-1732. [ Links ]
43. Yadav M, Kumar S. Anti-Corros Methods M. 2014;61:129-138. [ Links ]
44. Nahle A, Al-Tuniji R, Abu-Abdoun I, et al. Port Electrochim Acta. 2016;34:197-211. [ Links ]
45. Khadiri A, Ousslim A, Bekkouche K, et al. Port Electrochim Acta. 2014;32:35-50. [ Links ]
46. Forsal I, Ebn Touhami M, Mernari B, et al. Port Electrochim Acta. 2010;28:203-212. [ Links ]
47. Aloui S, Forsal I, Sfaira M, et al. Port Electrochim Acta. 2009;27:599-613. [ Links ]
48. Geethanjalia R, Subhashinib S. Port Electrochim Acta. 2015;33:35-48. [ Links ]
49. Elayyachy M, Hammouti B, El Idrissi A. Port Electrochim Acta. 2011;29:57-68. [ Links ]
50. Macdonald JR. J Electroanal Chem. 1987;223:25-50. [ Links ]
51. Deligeorgiev T, Gadjev N, Vasilev A, et al. Dyes Pygments. 2006;70:185- 191. [ Links ]
Acknowledgements
The authors acknowledge the financial support granted from the National Fund of Scientific Research of Bulgaria (DFNI-T 02/27 and DFNI E 02/11).
*Corresponding author. E-mail address: apopova@uctm.edu
Received April 19, 2017; accepted February 18, 2018

