


Serviços Personalizados
Journal
Artigo
 Inglês (pdf)
 Artigo em XML
 Referências do artigo
 Enviar este artigo por email
Indicadores
-
 Citado por SciELO
 -
 Acessos
Links relacionados
-
 Similares em
SciELO
Similares em
SciELO
Compartilhar

 Permalink
Portugaliae Electrochimica Acta
versão impressa ISSN 0872-1904
Port. Electrochim. Acta vol.36 no.6 Coimbra nov. 2018
https://doi.org/10.4152/pea.201806377
Morphological Modification for Optimum Electrochemical Performance of Highly Pristine Polypyrrole Flexible Electrodes, via SILAR Immersion Time and Fabrication of Solid State Symmetric Device
A. V. Thakur and B. J. Lokhande*
Lab of Electrochemical Studies, School of Physical Sciences, Solapur University, Solapur 413 255, M.S., India
Abstract
In the chemical synthesis of polypyrrole (PPy), pyrrole oxidative polymerization was done. The use of alkali salts viz. FeCl3, Fe(NO3)3, as an oxidative polymerizer, creates impurities, affecting the purity of formed PPy. In this work, highly pristine PPy flexible electrodes (FE) were chemically synthesized using a 0.1 M solution of pyrrole acidified with 0.05 M HClO4 and 30 wt % H2O2, by the successive ionic layer adsorption and reaction (SILAR) method. FEs XRD patterns indicate amorphous PPy formation. A characteristic peak at 1559 cm-1 in the FTIR spectra confirms PPy formation. A gradual change in the surface morphology with SILAR immersion time was observed. Nyquist plots describe different impedance parameters, which vary with SILAR immersion times. In cyclic voltammetric analysis (CV), the maximum specific capacitance observed for the FEs prepared with an immersion time of 10 s was 520.48 Fg-1. Specific capacitance calculated using the galvanostatic charge discharge (GCD) analyses was 529.70 Fg-1, which was nearly the same as that observed by CV. FEs exhibited great cycling stability, even after 5000 cycles, with 74.43% of capacitance retention. Solid state symmetric device (SSD) produced specific capacitance as high as 312.28 Fg-1, with 76 % of retention, even after 5000 cycles.
Keywords: Smart polymers, pristine polypyrrole, SILAR, tailor made polymers and supercapacitor.
Introduction
Supercapacitors are an indispensable part of today’s energy efficient world, as they deliver high power and high energy, as required [1-2]. Energy and power delivered by the supercapacitor depend on the electrode material used for the electrode preparation. Researchers have been synthesizing and testing various electrode materials in pure, as well as composite, forms [3-7]. Ease of synthesis, low oxidation potential, water soluble monomer, high charge storage ability, and good electrical conductivity are some of polypyrrole’s (PPy) distinguishing properties, making it suitable for supercapacitive electrodes [8-10]. PPy conductivity is due to conjugated double bonds, allowing electrons’ free movements, making it electrically conducting [9, 11-12]. Literature shows a wide variety of the pristine PPy aqueous route synthesis by pyrrole oxidative polymerization [11, 12, 14-16]. Shinde et al. have synthesized PPy by pyrrole oxidative polymerization, using three different oxidizers viz. FeCl3, (NH4)2S4O8 and K2Cr2O7 [9], with H2SO4, to acidify the solutions. However, the use of such oxidizers increases the chances of pristine PPy contamination with oxide and hydroxide metals species [17]. Thus, H2O2 as an oxidizer is favorable to avoid PPy contamination. Arunas Ramanavicius et al. have demonstrated a model for PPy nano-particles synthesis, using H2O2 [18]. Further, the chemical combination of H2O2 and H2SO4 forms a piranha solution [19-25], which is corrosive and detrimental to organic materials. Hence, it is not possible to synthesize PPy using H2O2 in H2SO4 presence. HClO4 provides an acidic pH nearly equal to 1, but does not combine with H2O2 to form any corrosive solution. Hence, it was decided to: (i) grow the pristine PPy films on stainless steel strips by the SILAR method, to produce flexible electrodes (FEs); (ii) study the effect of SILAR immersion time variations on FEs morphological and electrochemical performances, by electrochemically characterizing the prepared FEs using cyclic voltammetry (CV), galvanostatic charge-discharge (GCD) analyses and electrochemical impedance spectroscopy (EIS); and (iii) fabricate a solid state symmetric device (SSD) comprising of FEs with optimized performance, and analyze it by CV.
Experimental
Materials
In the synthesis work, extra pure pyrrole (sigma Aldrich, USA), HClO4 and 30 wt % of H2O2 (SD fine chemicals, India) were used as source materials, without any further purifications. NaNO3 (SD fine chemicals, India) was used to prepare the electrolyte. Double distilled water was used as a solvent in all experiments. Polyvinyl- alcohol (PVA) was used to prepare the gel.
Electrode preparation
All the synthesis and electrochemical characterization work has been carried out at the temperature of 300.15 K, humidity of 18 % and pressure of 1003.0 mb.
Substrate pretreatment
Stainless steel (SS) strips of 304 grade (size = 1 cm × 5 cm × 45 μm) were used as conducting substrate material. They were mirror polished using fine polish paper (grade 600), to get the rough finish. These strips were ultrasonicated in double distilled water for 20 min, to remove the dirt, oil, stains, etc., from their surfaces. Further, they were treated with 0.025 M HNO3 for 1 min, to allow the proper electrode material nucleation and growth by adsorption [11-12].
SILAR deposition
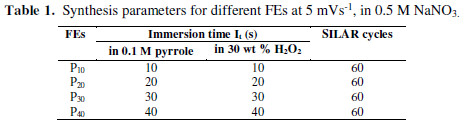
All pyrrole solutions were prepared in 0.05 M aqueous HClO4, to maintain the acidic pH. In the pilot study, precursors’ variations in molar concentrations were tried. A uniform thin film formation was found for 0.1 M pyrrole and 30 wt % of H2O2. Each SILAR cycle involved successive immersions of the SS strip in a 10 mL aqueous solution of 0.1 M pyrrole and 30 wt % of H2O2, for a given immersion time (It). These strips were pressure cleaned by the jets of double distilled water after each cycle, to remove loosely bound, un-oxidized and partially oxidized radicals. 60 of such SILAR cycles have been carried out. FEs prepared with different It (immersion time), viz. 10 s, 20 s, 30 s and 40 s, were coded as P10, P20, P30, and P40, respectively (Table 1).
Fabrication of the solid state symmetric device (SSD)
P10 FEs with optimum SC were used to fabricate the SSD. A 0.5 M NaNO3 aqueous solution has been prepared in double distilled water. 1 g of PVA was dispersed in 50 mL of double distilled water, and stirred at 348.15 K, to form a gel, until the solution volume was reduced to 20 mL. By slowly adding the NaNO3 solution to PVA gel at 350.15 K, the viscous gel electrolyte was produced. The gel was sandwiched amid FEs. Parchment paper was used as separator to avoid FEs direct contact.
The assembly (Fig. 1) was then sealed with the insulating tape, and pressed in a hydraulic press, to avoid air gaps and leakage.
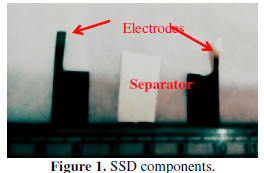
These assemblies are the ones defined as SSDs.
Characterization
Physical characterizations
All FEs structural characterizations have been carried out by using different techniques. X-ray diffraction (XRD) patterns obtained by an X-ray diffractometer (Ultima IV Rigaku D/max2550Vb +18 kW with CuKa, l = 1.54056 Å, Japan), in the diffraction angle (2q) range from 10° to 90°, were used to study the formed material nature. Fourier transform infra-red (FTIR) patterns, obtained by a FTIR spectrophotometer (Nicolet iS 10, Thermo scientific, USA), were used to verify PPy formation. Field Emission Scanning Electron Microscopy (FESEM) and Elemental Dispersive Spectroscopy (EDS) were carried out by using a scanning electron microscope ((FESEM JEOL JSM- 7600F HITACHI, Japan), to check the surface morphologies and elemental compositions of prepared FEs. Weight of the deposited material was measured by the weight difference method, using a high accuracy analytical microbalance (Tapson-100TS, USA), with the least count of 10–5 g. The surface wettability analyses have been carried out using a contact angle meter (HO-IAD- CAM-01, Holmark opto-mechatronics, India).
Electrochemical characterizations
FEs electrochemical characterizations have been carried out using an electrochemical analyzer (CHI 408C, USA) with a standard three electrodes cell comprising FE as working electrode, platinum wire as counter electrode, saturated Ag/AgCl as reference electrode and a 20 mL aqueous solution of 0.5 M NaNO3 as electrolyte. SSDs were electrochemically analyzed using a standard two electrode configuration. Cyclic voltammetric (CV) curves were used to calculate the specific capacitance (SC) by equations 1 and 2 given in the text. Galvanostatic charge-discharge analyses have been carried out to evaluate chronopotentiometric parameters, using formulae 3, 4, 5 and 6. Electrochemical impedance spectroscopic (EIS) analyses have also been carried out, to find different parameters, viz. electrochemical series resistance (ESR), double layer capacitance (Cdl), charge transfer resistance (Rct) and Warburg impedance (Rw).
Results and discussion
Film formation mechanism
Scheme 1 shows FEs formation.
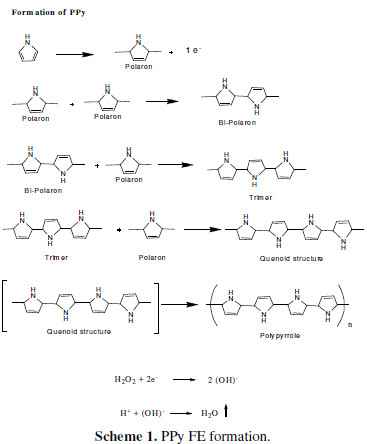
In the cationic bath, pyrrole has lost one electron, to form a polaron. Several polarons were adsorbed onto the SS strips, and successively united to form bipolaron, trimer, quinoid structure and finally, PPy. The electrons lost during polarons formation are taken by H2O2, to form (OH)- ions. These species recombine with H+ ions, to form water. As there are no other byproducts than water, the formed PPy is 100% pristine.
Structural elucidation
FEs XRD patterns are shown in Fig. 2A.
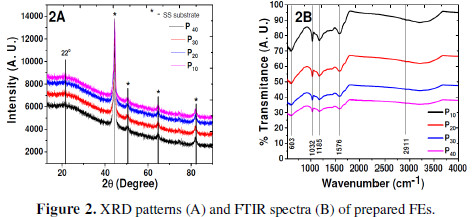
The characteristic broad peak observed at 2. (22.) confirms amorphous PPy formation [13-26], which is due to the Xrays scattering from PPy chains at the interplanar spacing. The average chain separation can be calculated from these maxima, using equation 1 [27-28].
where S is the polymer chain separation, . is the X-ray wavelength and . is the diffraction angle at the maximum intensity. The average chain separation (R) was found to be 4.38 Å for PPy [29-33]. This enables amorphous PPy formation. FTIR spectrophotograph of all the prepared FEs (Fig. 2B) demonstrates the peak at the wave number of 1576 cm-1, corresponding to C-C and C=C skeletal (ring) vibrations. The peak at 1032 cm-1 is due to the C-H deformation vibration; the peak at 1185 cm-1 is due to C-N stretching; and the peak at 603 cm-1 is due to the N-H wagging; while a broad peak at 2911 cm-1 is due to N-H stretching and vibrations. All these peaks confirm PPy formation.
FEs’ FESEM images (Fig. 2C) clearly exhibit the transition from globular morphology to the dense mud-like morphology, with an increased It.
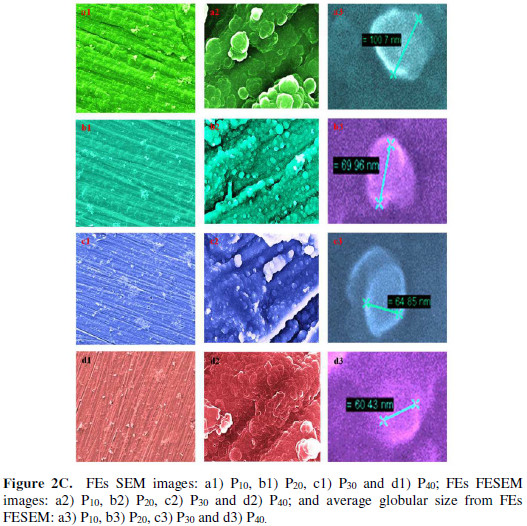
The average globular size for P10 was 100 nm, which went on reducing, as the dense PPy growth occurred with the increased It. Finally, for P40, it became 60 nm.
A decrease in the material’s film thickness, from 6 μm for P10, to 4.02 μm for P40, was observed. This confirms the globular size reduction, as the film became more compact with an increased It (Fig. 2D).
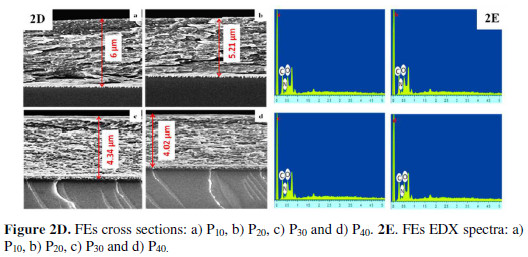
The peaks corresponding to C, N, and O in EDS pattern also substantiated PPy formation (Fig. 2E). Surface wettability studies showed that the material became less hydrophilic with the increased It (Fig. 2F).

Electrochemical characterization
CV analyses
All FEs were subjected to CV analyses within a potential window of -1.2 V to 0.6 V, at 5 mV s-1 (Fig. 3A).
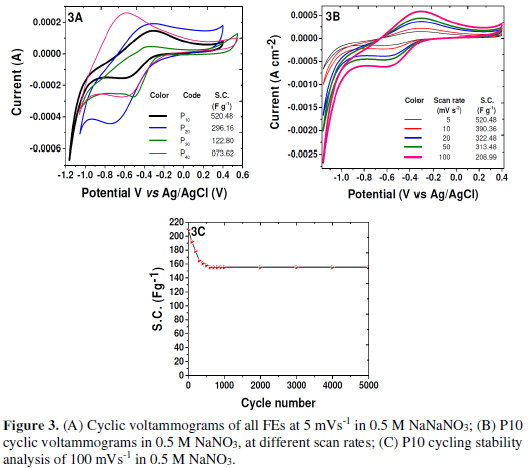
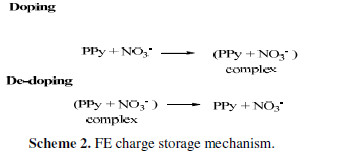
CV curves of all FEs showed broad peaks on the positive sweep of the potential, corresponding to PPy matrix doping with NO3- anions, while the peak on the negative sweep of the potential corresponded to the PPy matrix de-doping (Scheme 2).
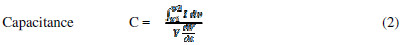
The potential limits observed for the potential window are different from those observed in the literature [9]. This increase in the potential window is attributed to the NaNO3 electrolyte. Specific FEs capacitances (SC) were calculated by using the following equations [9, 11-12].

where I is the average current in the Redox cycle, V is the potential window, dv/dt is the voltage scan rate, C is the capacitance, and m is the active material mass dipped in the electrolyte. Despite of the decrease in FEs thickness, it was found that SC gradually decreased with It, from P10 to P40 (inset of Fig. 3A). This may be due to the reduction in the material’s globular size, making it less interactive for the electrolyte. The same has been corroborated by the wettability test. The measured SC was found to be maximum for P10 FE.
Potential scan rate variations have been applied (5 mVs-1 to 100 mVs-1) to P10 FE, and the consequences were observed. The peaks corresponding to the material’s doping with anions tended to shift towards more positive potentials, while the peaks corresponding to the material’s de-doping have shifted towards more negative potentials, with an increase in the scan rate. It was observed that, even though the current integral went on increasing with an increase in the scan rate, SC went on decreasing with the scan rate (Fig. 3B). FE P10 SC was found to vary with the applied scan rate variations (inset of Fig. 3B)). This is because the current integral did not increase in the same proportion as that of the scan rate. This may be due to the fact that the PPy matrix doping and de-doping rate with the NO3- anions did not vary in the expected proportion [11-13].
PPy suffers from poor elasticity in shape during the electrochemical reactions, affecting its cycling stability. The matrix could not regain the shape during the anionic doping.de-doping. P10 FE cycling stability study has been carried out at 100 mV/s, to check its durability. There was SC loss by 9 %, at the end of the second cycle. This was due to the anions repulsion caused by the NO3 - anions entrapment in the PPy matrix, as well as on its surface, during the first cycle. Rapid decrease in SC has been observed in 300 cycles, by nearly 20.98% of its original value. Then, it slowly decreased until the 600th cycle, by 5.80 %. Afterwards, it decreased by 25.57% of its original value but, thereafter, it remained unaffected. Even after 5000 cycles, the P10 FE showed 74.43 % of capacitive retention, as the measured SC was 158.34 Fg-1 (Fig. 3C).
GCD analyses
FEs galvanostatic charge-discharge (GCD) analyses were carried out within the potential window of -1.4 V to 0.55 V, at a constant current density of 0.2 mAcm-2 (Fig. 3D). Unlike ideal capacitors, FEs exhibited a different GCD behavior. The charging curve showed an initial rapid charging, indicating the easy doping of NO3- anions in the PPy matrix, followed by exponential charging, demonstrating the opposition to the new NO3- anions, due to the pre-doped anions in the matrix.
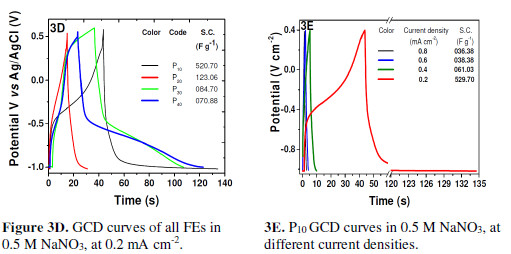
The discharging portion shows three parts, indicating an initial ohmic drop followed by a rapid discharging portion, which may be due to the rapid anions loss from the PPy matrix near to the surface and, finally, a time consuming exponential discharging portion, indicating a Faradaic charge storage [11-12].
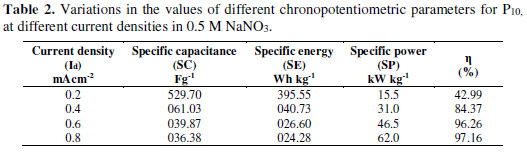
SC values evaluated from the GCD curves are mentioned in the inset of Fig. 3D. As P10 FE showed a maximum SC value (520.70 Fg-1), it was subjected to the GCD analysis at different current densities (Fig. 3E), and it showed a slow discharging at lower current densities. The charging and discharging times went on decreasing with an increase in the current density. This may be due to the fact that the anionic doping and de-doping process rapidly occurred at higher current densities; hence, the total active material was not completely utilized [13].
Several chronopotentiometric parameters were calculated using the following equations [9, 11-12]


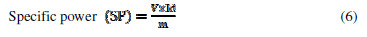

where V is the voltage, Id and td are the discharging current and time, m is the active electrode mass and tc is the charging time. SE, SP and . values, at various current densities for FE, are reported in Table 2.
EIS analyses
To study the electrode material’s AC impedance at multiple frequencies, EIS analyses of all FEs have been carried out in the same electrolyte, within the frequency range from 5 mHz to 100 kHz. Fig. 3F depicts the Nyquist plots along with the equivalent circuit nature, to evaluate different circuit parameters. The Nyquist plot consists of 2 regions, viz. low frequency region (Fig. 3F1) and high frequency region (Fig. 3F2).
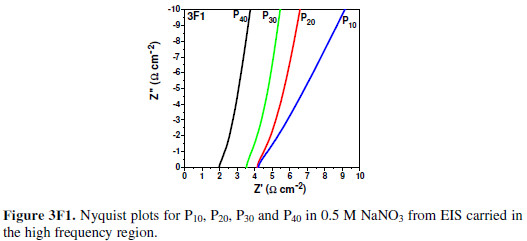
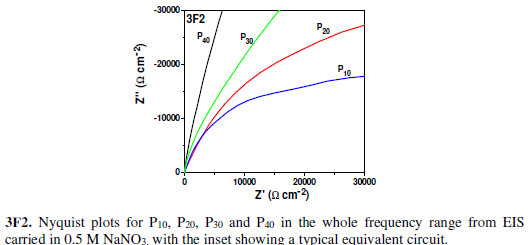
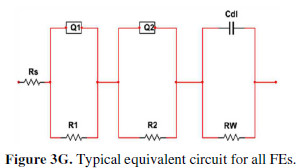
The plot intercept with the real axis in the high frequency region gives an equivalent series resistance (ESR or Rs), which is a combination of solution resistance, substrate-material interface resistance, ionic resistance and particle to particle contact resistance [34]. With the It increase, the material became denser and, hence, the inter particle resistance decreased. Thus, the ESR (Rs) value went on decreasing from P10 to P40. The lowest observed ESR value was ~ 2.01 O, indicating a very low inter particle resistance, since the solution and substrates were the same. As there were extremely minute semicircles observed in the Nyquist plot at the high frequency region, the formed films were extremely adherent to the substrates [34]. The Nyquist plot slope in the mid frequency region gave the Warburg impedance (Rw). [9, 12-13, 31]. With the increase in It, the material became less hydrophilic; thus, less accessible to the electrolyte. Hence, the Warburg impedance (Rw) value went on increasing, and the ionic current went on decreasing with the It increase. From P10 to P40, this causes an Rw increase. These results are in perfect agreement with the previous works done on impedance and electrochemical analyses [32-33]. As the material became more hydrophobic and more resistive, the double layer charge storage went on increasing and, hence, the Nyquist plot inclination tended more towards the imaginary axis ( axis). A typical equivalent circuit for every FE shows similar circuit elements, but their values vary with the It (Fig. 3G).
The evaluated parameters of circuit elements for different FEs are mentioned in Table 3.
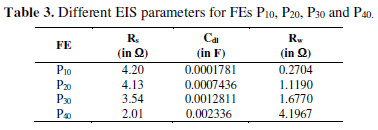
The equivalent circuit shows some additional components. Q1 is the constant phase element (CPE) used in place of the double layer capacitance (Cdl), since the semicircle is depressed. Q2 is CPE, because of the FE non-ideal capacitive behavior in the low frequency region, due to the electrode’s non homogeneous nature [33]. R1 may be the resistance of the barrier formed amid the conducting SS substrate and the conducting PPy, and R2 may be the resistance at the solid electrode-liquid electrolyte interface.
Cyclic voltammetric study of SSD
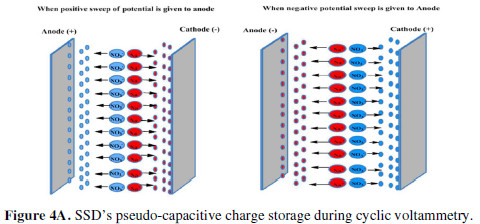
The charge storage mechanism in SSD is also pseudo-capacitive. When the positive potential sweep voltage is given to the anode, the anodic PPy matrix gets doped with NO3- anions, to form the complex. The charge is stored in the form of a complex, while Na+ cations are adsorbed by the cathodic PPy. On the polarity reversal, the complexes are broken, and the ions are released into the electrolyte [Fig. 4A].
SSD showed a near symmetric pattern of CV curves [Fig. 4B].
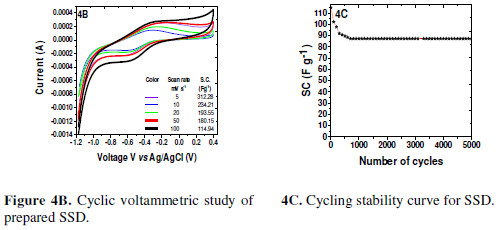
There was a very slight variation in the potential limits, as compared to the individual FE. The current integral went on increasing with the scan rate. Further, a very slight peaks shifting, corresponding to the doping and de-doping, has been observed, indicating the material stability towards the current variation. SC values calculated from the CV curves for different scan rates, using formulae 1 and 2, are mentioned in the inset of Fig. 3B. It was seen that SSD SC at 5 mV/s was 312.28 F g-1, which is nearly 60% of that of the individual FE P10 SC. The plausible reasons for the SC fall are: (i) increased ionic resistance, due to the gel electrolyte formation, (ii) similar electrodes, and (iii) reduced electrolyte volume, etc.
SSD cyclic stability
SSD was subjected to a cycling stability study at 100 mV s-1. It was seen that SC decreased with an increase in the number of cycles, rapidly up to the first 300 cycles. SC at the 300th cycle was 91.95 F/g, which was 80.04 % of the original value. Thus, there was a SC loss of 19.96 %. Then, it slowly decreased until reaching 600 cycles, as it was 88.5 F/g, which indicates the further loss of only 3.75 %; thereafter, it remained unaffected, even after 5000 cycles [Fig. 4C], with nearly 76 % of capacitance retention.
Conclusion
The herein presented method is highly suitable for the binderless chemical synthesis of 100 % pristine PPy in a simple way. FTIR spectra confirmed PPy formation. XRD confirmed PPy amorphous nature. With the increase in SILAR immersion time, FE surface morphology became denser, and less hydrophilic. Hence, FEs specific capacitance (SC) decreased. Slow discharging and large SC values of the prepared FE, with It = 10 s, prove its eligibility for high energy applications. The NaNO3 electrolyte has increased the potential window, as compared to the previously mentioned electrolytes. Though FE exhibited poor cycling stability, truly pristine FEs have been prepared. The fabricated SSD showed SC of 102.29 F/g at 100 mV/s, and 76 % of capacitance retention, even after 5000 cycles. From overall results, it is concluded that the electrodes with less immersion time are suitable for high energy supercapacitors.
References
1. Conway BE. Electrochemical supercapacitors: scientific fundamentals and technological applications. New York: Kluwer-Plenum; 1999. [ Links ]
2. Dubal DP, Lee SH, Kim JG, et al. J Mater Chem. 2012;22:3044. [ Links ]
3. Wang H, Hao Q, Yang X, et al. Appl Mater Interf. 2010;2:821. [ Links ]
4. Ambade RB, Ambade SB, Shrestha NK, et al. Chem Comm. 2013;49:2308. [ Links ]
5. Thakur AV, Lokhande BJ. J Mater Sci. 2018;29:1630. [ Links ]
6. Ambare RC, Bhardwaj SR, Lokhande BJ. Curr Appl Phys. 2014;14:1582. [ Links ]
7. Ambare RC, Bhardwaj SR, Lokhande BJ. Appl Surf Sci. 2015;349:887. [ Links ]
8. Davies A, Audette P, Farrow B, et al. J Phys Chem C. 2011;115:17612. [ Links ]
9. Shinde SS, Gund GS, Dubal DP, et al. Electrochim Acta. 2014;119:1. [ Links ]
10. Shi C, Zhitomirsky I. Nanoscale Research Lett. 2010;5:518. [ Links ]
11. Thakur AV, Lokhande BJ. J Solid State Electrochem. 2017;21:2577. [ Links ]
12. Thakur AV, Lokhande BJ. e-Polymer. 2016;17:167. [ Links ]
13. Thakur AV, Lokhande BJ. J Mater Sci: Mater Electronics. 2017;16:11755. [ Links ]
14. Liu Z, Liu Y, Poyraz S, et al. Chem Comm. 2011;47:4421. [ Links ]
15. Tan Y, Ghandi K. Synthetic Metals. 2013;175:183. [ Links ]
16. Chen S, Zhitomirsky I. Mater Lett. 2014;125:92. [ Links ]
17. Yin Z, Ding Y. Electrochem Comm. 2012;20:40. [ Links ]
18. Leonavicius K, Ramanavicius A. Langmuir. 2011;27:10970. [ Links ]
19. Piranha. University of Pennsylvania. Retrieved 4 May 2011. 20. Section 10: Chemical Specific Information Piranha Solutions. Laboratory Safety Manual. Princeton University. [ Links ]
21. web.mit.edu/cortiz/www/PiranhaSafety.doc Standard Operating Procedure for Piranha Solutions - MIT. Retrieved 12 May 2016.
22. Procedure on handling and using Acid Piranha solution (PDF). University of Cambridge. Retrieved 12 June 2015. [ Links ]
23. Laboratory Procedures. Sci.chem FAQ. Retrieved 2008-01-11. [ Links ]
24. Seu KJ, Pandey AP, Haque F, et al. Biophys J. 2007;92:2445. [ Links ]
25. Piranha Waste Fact Sheet, [ Links ] University of Illinois at Urbana-Champaign.
26. An T, Cho SJ, Choi WS, et al. Soft Matter. 2011;7:9867. [ Links ]
27. Paul S. Polypyrrole Formation and Use, DRDC Atlantic TM 2005-004, January 2005. [ Links ]
28. Torabi M, Soltani M, Sadrnezhaad SK. J New Mater Electrochem Syst. 2014;17:129. [ Links ]
29. Ouyang JY, Li YF. Polymer. 1997;38:3997. [ Links ]
30. Cheah K, Forsyth M, Truong V-T. Synthetic Metals. 1999;101:19. [ Links ]
31. Lemon P, Haigh J. Mater Research Bull. 1999;34:665. [ Links ]
32. Cheah K, Forsyth M, Truong V-T. Synthetic Metals. 1998;94:215. [ Links ]
33. Zheng LP, Wang Y, Wang XY, et al. J Mater Sci. 2010;45:6030. [ Links ]
34. Choudhari S, Bhattacharya D, Yu J-S. RSC Adv. 2013;3:25120. [ Links ]
Acknowledgements
Authors are grateful to Solapur University, Solapur, India, for providing the DRF facility.
*Corresponding author. E-mail address: bjlokhande@yahoo.com
Received August 14, 2017; accepted January 10, 2018

