


Serviços Personalizados
Journal
Artigo
 Inglês (pdf)
 Artigo em XML
 Referências do artigo
 Enviar este artigo por email
Indicadores
-
 Citado por SciELO
 -
 Acessos
Links relacionados
-
 Similares em
SciELO
Similares em
SciELO
Compartilhar

 Permalink
Portugaliae Electrochimica Acta
versão impressa ISSN 0872-1904
Port. Electrochim. Acta vol.36 no.2 Coimbra mar. 2018
https://doi.org/10.4152/pea.201802119
Environmental Cinnamon Extracts Effect on Electrodeposition of Copper in an Acidic Bath
K. Dahmania, M. Galaia , A. Elhasnaouic, B. Temmarb , A. El Hessnic, M. Cherkaouia and A. Zarrouka,*
a Laboratory of Materials, Electrochemistry and Environment, University Ibn Tofail, Faculty of Science, P.O. Box 133 Kenitra, Morocco
b Nemotek, Technopolis, Sale, Morocco
c Laboratory of Neuroendocrinology Biotechnology and Genetics,University Ibn Tofail, Faculty of Science, P. O. Box 133 Kenitra, Morocco
d LC2AME-URAC 18, Faculty of Science, First Mohammed University, P.O. Box 717, 60 000 Oujda, Morocco
Abstract
A new industrial electrodeposition of copper in an acidic medium using an environmental cinnamon extract has been developed. The obtained coatings were adherent and uniform, and their deposition rate has reached 23 μm/h. In addition, their quality has been improved by cinnamon extract addition. Cyclic voltammetry and electrochemical impedance spectroscopy have showed that the electrodeposition mechanism depends on the electrolyte constituents and the additive presence. The SEM observation indicated that the coatings morphology has been improved by cinnamon extract addition.
Keywords: Copper electrodeposition, additive, cyclic voltammetry, EIS, SEM observation.
Introduction
In an industrial case herein examined, the interconnections protection process is quite rigorous. One step is the gold deposit with a thickness of 0.35 micron. In the interests of economic efficiency, it would be appealing to substitute the gold deposit by a less expensive coating. Copper electroplating is a possible solution to produce coatings with remarkable properties, at a fairly low cost [1]. Copper electronic chips technology has been developed over two decades ago [1, 2], and it has significantly improved the conductance of integrated peripherals connections. In this field, copper interconnections suffer severe degradation by the surrounding environment. Various protection methods have been used, such as metal layers deposition. Copper electroplating has been often used in microelectronics industry [3-6]. Copper is an excellent choice as underlayment. It has a very high plating efficiency with excellent coverage, even on substrates that are difficult to be coated.
However, copper electroplating baths usually have a quite simple formulation: copper salt and sulfuric acid. To improve the quality of the obtained deposit, several organic and inorganic additives, such as 2,2 -dipyridyle [7, 8] and K4Fe(CN)6 [9-10], were added to chemical deposition electrolytes, while thiourea [11-12], gelatin [13,14] and animal glue [15] have been added to the electrochemical deposition electrolytes. They have allowed the development of uniform and resistant copper coatings. The presence of additives in electroplating baths also produces a better leveling effect on the deposits surface [16-22]. However, their releases could present a danger to the environment. So, the search for less toxic compounds would be an alternative. Thus, the aim of this study is to formulate a new bath, using a natural additive, for developing a copper coating on interconnections used in wafer level packaging technology. The electrodeposition kinetics and mechanism have been studied using potentiostatic and electrochemical impedance spectroscopy (EIS) methods. The coating morphology has been characterized by scanning electron microscopy (SEM).
Materials and methods
The electrolysis cell was a borrosilicate glass (Pyrex®) cylinder closed by a cap with five apertures. Three of them were used for the electrodes: copper interconnects, used in wafer level packaging technology (Fig. 1), as working electrode, Pt plate as counter electrode, while Ag/AgCl was used as reference electrode.
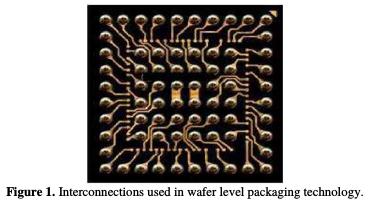
All potentials refer to this last electrode. All solutions used in these experiments were freshly prepared from analytical grade reagents and distilled water.
The composition and operating conditions of each plating's electrolyte are listed in Table 1.
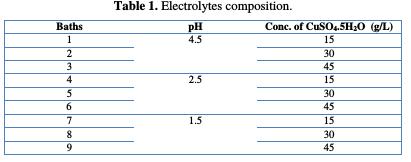
The temperature was held at 25 ± 2 °C. The study was held in an acidic medium to meet industrial demands.
Before each experiment, the substrates were degreased in ethanol, rinsed with distilled water, pickled in sulfuric acid, and then rinsed again with distilled water. The applied current densities were between -12 mA/cm2 and -17 mA/cm2. To improve the coating quality, a cinnamon extract was added to baths. The appreciation of coatings appearance has been visually performed. The deposit morphology was characterized by scanning electron microscopy (SEM) using a LEO 1530 FEG device, and the deposition rate, vd, was gravimetrically determined according to the relationship:
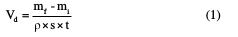
where mi and mf are the initial and final mass (g), respectively; s is the substrate surface (cm2); t is the deposition time (h) and ρ is copper density (g/cm3). The electrochemical measurements were carried out using a Potentiostat/Galvanostat/Voltalab PGZ 100, monitored by a personal computer.
The cyclic voltammetry curves were recorded by polarization, with a sweep rate equal to 10 mV/s. The impedance diagrams were carried out at the deposition potential.
Results and discussions
Effect of pH
The pH is an important copper electrodeposition parameter. Table 2 shows the deposition rate evolution at various pH values.
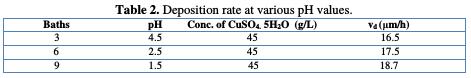
It is noted that the deposition rate increases with the pH decrease, where a more acid pH causes a substrate deterioration. In addition, Cu precipitation is observed in the bath. According to other studies, when the pH becomes too high, the deposit becomes matt. To avoid these disadvantages, the electrolyte solutions were maintained at a constant pH by the addition of buffer substances. This makes possible to avoid changes in the deposit quality, which would result from changes in acidity [23]. After determining our basic bath, we have tried to improve the stability and quality of the obtained deposit, by the addition of cinnamon extract.
Effect of copper concentration and current density
Fig. 2 shows the deposition rate evolution as a function of the copper sulfate concentration at different current densities.
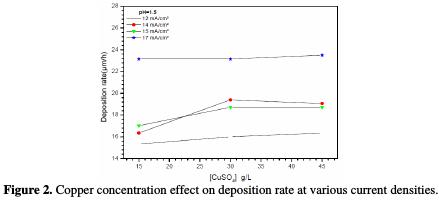
It is remarked that the deposition rate remains substantially constant with the copper concentration in the studied range, and increases with the current density, to reach a maximum of 23 μm/hat -17 mA/cm2. In addition, at 15 g/L and 45 g/L of CuSO4. 5H2O, the deposition rate increases with increasing current densities, while at 30 g/L of CuSO4. 5H2O, the deposition rate at 14 μA/cm2 is higher than that obtained at 15 μA/cm2.
Initially, the coatings aspect was visually appreciated. It is observed that the decrease in the CuSO4. 5H2O concentration and the increase in current deposition tend to improve the coating aspect. Thus, the optimal conditions are: CuSO4. 5H2O 15 g/L at pH=1.5 (bath 7), and a current density equal to -17 mA/cm2. To improve the coating quality, we have added an additive, cinnamon extract, to the electrolyte. This additive is natural and non-toxic to the environment.
Effect of cinnamon concentration on the deposition rate
GC-MS analysis of cinnamon extract
The essential oils have been analyzed by gas chromatography coupled to mass spectrometry (GC-MS), using the Thermo Fisher apparatus in UATRS - cnrst, Rabat, Morocco. The cinnamon essential oil constituents are presented in Table 3.
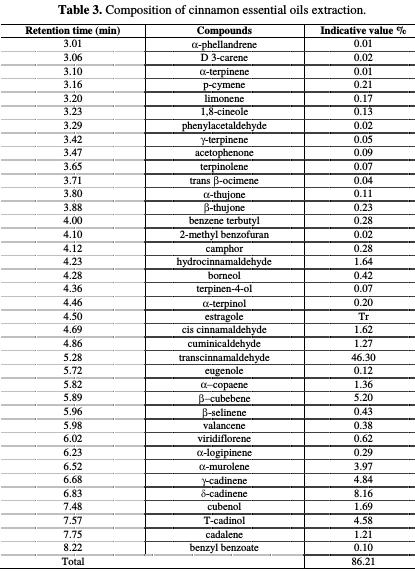
From the cinnamon essential oil chromatographic analysis by GC/MS, we have found that 38 compounds represent 86.21% of this oil, with trans- cinnamaldehyde (46.30%), δ-cadinene (8.16%) and β-cubebene (5.20%) being the major constituents.
Fig. 3 shows cinnamon's influence on the deposition rate at different concentrations.
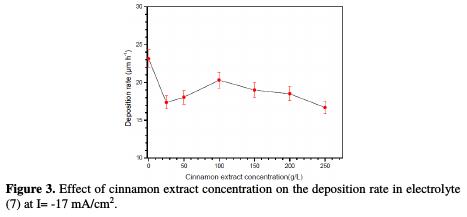
It is seen that cinnamon extract addition slightly decreases the deposition rate from 23 μm/h to 20 μm/h. Furthermore, it is observed a significant improvement in the quality of the obtained coating, with a higher cinnamon concentration, where the best appearance was obtained at 100 ppm.
Scanning electronic microscopy morphology
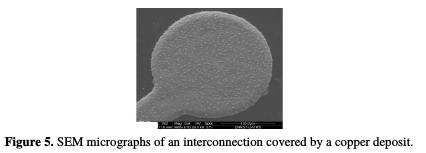
The morphology of electrodeposited copper interconnections obtained from electrolyte 7, with and without additive, was characterized by SEM. It is noted that the deposits obtained from electrolyte 7, without additive, present some pores and irregularities (Fig. 4a).
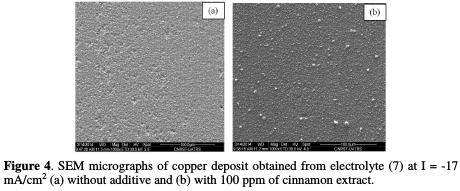
By contrast, the deposit obtained in the presence of 100 ppm of cinnamon was more regular, no porous and smooth (Fig. 4b).
A larger view of the interconnection shows that the coating formed from the electrolyte (7), in the additive presence, is truly uniform over the whole surface (Fig. 5).
Deposition mechanism
Chronopotentiometry
Fig. 6 shows the chronopotentiograms, with and without the addition of cinnamon extract.
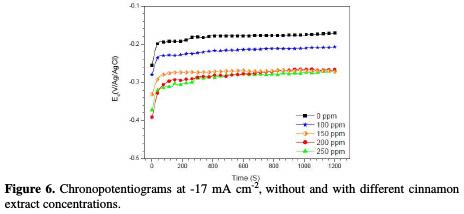
It is found that the copper electrodeposition potential, obtained from electrolyte (7), in the absence of additive, is equal to -0.20 V/Ag/AgCl, which has cathodically decreased with additive, to reach a minimum at 250 ppm (-0.3 V/Ag/AgCl) of cinnamon extract. This result can be explained by the change in the electrode surface, leading to the the variation in the deposition rate.
Cathodic curves study
Fig. 7 shows the cathodic curves obtained in baths containing H2SO4, with and without 100 ppm of cinnamon extract and/or copper sulfate.
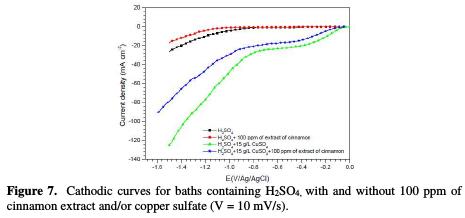
It is noted that the hydrogen reduction starts from -0.8 V/Ag/AgCl in the solution containing only H2SO4 (while after addition of cinnamon extract, this potential shifts to 1.1 V/Ag/AgCl), and that no plate was observed. This result indicates that the organic additive was not of an electroactive species. It can be seen a significant decrease in the cathodic current density, in the presence of the additive, which can be attributed to a drop in the H+ ions discharge. This could explain the decrease in pitting on coatings made from baths containing the additive.
So, in the presence of CuSO4 with H2SO4, it is seen a region with different current/potential functionalities, as expected of a change in the process kinetics at different potentials. Thus, the polarization curve showed that, from -0.040 V/Ag/AgCl up to -0.40 V/Ag/AgCl, the cathodic process is under activation control, whereas from -0.40 V/Ag/AgCl to -0.80 V/Ag/AgCl, it was mass transport-controlled; and from E = -0.8 V/Ag/AgCl, it became an hydrogen evolution [22, 24-26]. In addition, the pale diffusion was attributed to Cu2+ reduction, such as mentioned by Anik et al. [6]. However, in the cinnamon extract addition to the electrolyte (7), the hydrogen reduction potential was shifted to more negative values, with a remarkable decrease in the cathodic current density. It is noted that copper current diffusion was decreased by the additive, indicating a decrease in the deposition rate. This can be interpreted as a surface blockage, confirming chronopotentiometry results. The gravimetrically recorded increase in the deposition rate, between -12 mA/cm2 and -17 mA/cm2, was also confirmed. Indeed, in this current zone, the deposition process is activation-controlled. It is noted that the current density required to obtain a good quality deposit (-17 mA/cm2) is much lower than the diffusion current limit, which is around -30 mA/cm2.
Cyclic voltammetry study
Fig. 8 shows the voltammogramms obtained from electrolyte (7), without and with 100 ppm of cinnamon extract.
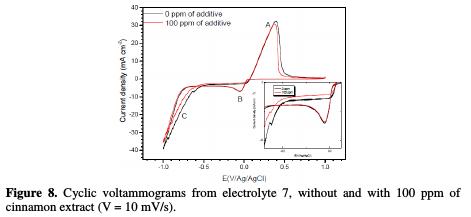
The shape of the voltammogramms remained similar with and without additive. The first cathodic peak at -0.037 V/Ag/AgCl (peak B) was attributed to the copper reduction, followed by hydrogen evolution at -0.8 V/Ag/AgCl (peak C) [6]. In the anodic range, it is observed a peak (A) at 0.39 V/Ag/AgCl, associated to copper dissolution formed during cathodic scan. In presence of the cinnamon extract, a displacement of the peak C to the cathodic direction, and a decrease in its current intensity, were observed. It was also noted a small decrease in the peak B, indicating a decrease in the deposition rate. This is in agreement with previous results, which showed that cinnamon extract acts on the cathodic process by hydrogen inhibition and copper reduction.
Electrochemical impedance study
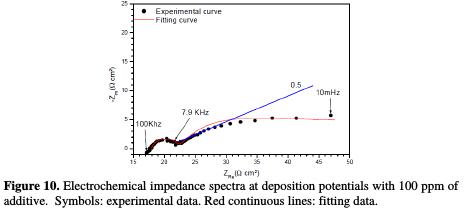
The Nyquist impedance spectra of copper electrodeposition, without and with 100 ppm of cinnamon extract, are presented in Figs. 9 and 10.
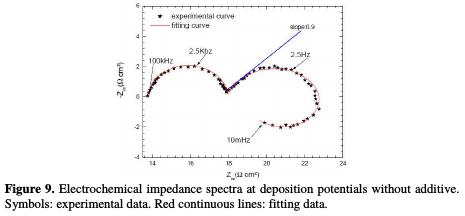
The impedance diagram plots done without cinnamon extract reveal (Fig. 9): - a first loop at high frequency, attributed to the relaxation of the double layer capacitance around 20 μFcm-2, in parallel with the charge transfer resistance, Rt, inversely proportional to the deposition rate;
- a capacitive loop at the intermediate frequency. This can be attributed to copper discharge, which is controlled by mass transport [27]. The linear portion slope is equal to 0.9; this value close to 1 is characteristic of a diffusion phenomenon that takes place in a solution [28]. The difference between the theoretical value and the obtained one may be justified by the low deconvolution between the first and the second loop, i.e. the end of the first loop influences the beginning of the second;
- and an inductive loop at low frequency, often attributed to electrocrystallization [29].
However, in the additive's presence, two loops were observed. The first loop at the high frequencies was attributed to the response of charge transfer resistance, of which capacitance value is equal to 3.3 μFcm-2, much lower than that obtained without the additive. The second loop at the intermediate frequencies was attributed to the copper ions discharge (Fig. 10). In addition, the linear portion is also noticed in the beginning of the last loop (the bath without additive); the slope is significantly lower, where its value is approximately equal to 0.5. These observations are not characteristic of a diffusion phenomenon in the solution, but may result from diffusion through a thin layer formed at surface by additive adsorption. The additive effect can be further demonstrated by the maximum frequency of the second loop. It is, indeed, very different without and with additive.
For modeling the impedance diagrams, it has been taken into account that the resulting loops are flattened semicircles. The deviations from a perfect circular form are often related to the frequency dispersion of interfacial impedance, arising from a lack of electrode homogeneity surface, due to roughness or interfacial phenomena [29]. The EIS results without additive were simulated using the equivalent circuit shown in Fig. 11a, while that in the presence of additive was shown in Fig. 11b, in relation to pure electric models.
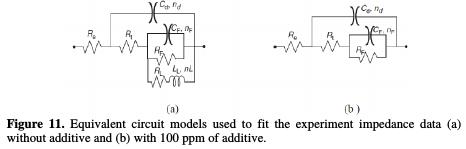
These can verify or rule out mechanistic models, and enable the calculation of numerical values corresponding to the physical and/or chemical properties of the electrochemical system under investigation. The employed circuit allowed for the identification of the solution resistance (Re), charge transfer resistance (Rt) and discharge resistance associated with the formed layer of products (Rf). It is worthy to note that the double layer capacitance (Cf) value was affected by surface imperfections, and this effect was simulated via a constant phase element CPE (Qf, n) [30]. The employment of Qf and n parameters is justified when their changes are related to the surface heterogeneity resulting from surface roughness, adsorption and porous layer formation. Indeed, Fig. 4 has showed that the coatings presented some roughness. So, the depressed feature was represented by the following expression, close to the frequency distribution of the dielectric behavior called Cole-Cole type dispersion of time constant [31]:
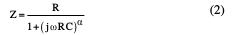
This expression differs from the constant phase element (CPE) impedance, frequently used nowadays, where CPE and R impedance of parallel connection will be expressed as [32]:
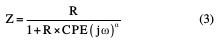
The simulated impedance parameters are shown in Table 4.
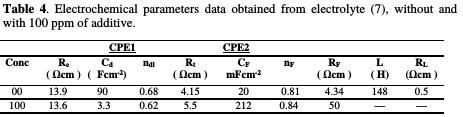
It is observed a good correlation between experimental and simulated data. According to these results, Rt, transfer resistance, was slightly increased from 4.15 Ω cm2 to 5.5 Ω cm2, with 100 ppm of additive, confirming a low impact on the deposition rate. It is also noted that Rf value, the resistance of the ionic transfer through the film, in the additive's presence, is higher than that in its absence.
Conclusion
In this study, we have developed a copper coating on interconnections used in wafer level packaging technology. We have found that copper electrodeposition rate and deposit quality depend on the sulfate copper concentration, pH and current densities. In order to improve the deposition quality, a cinnamon extract additive was used. It was found that the coating quality was improved; less porosity and greater regularity were observed by scanning electron microscopy, without decreasing the deposition rate.
In addition, investigations by stationary polarization, cyclic voltammetry and electrochemical impedance showed that the additive has influenced the electrodeposition mechanism. So, the hydrogen reduction potential was shifted to more cathodic values, and the impedance diagrams showed a change in the copper deposit mechanism. Thus, without additive, a diffusional process occurs in the solution, while in its presence, the diffusion would occur through a thin layer formed on the surface. However, SEM observations have indicated that the deposit quality has improved with additive, by its adsorption on the electrode surface.
References
1. Andricacos PC, Uzoh C, Dukovik JO, et al. IBM J Research Development. 1998;42:567. [ Links ]
2. Andricacos PC. Interface 1998;7:23. [ Links ]
3. Topper M, Stolle T, Reichl H. Proceedings of International Symposium on AD. IEEE Int Microelectr and Packaging Soc; 1999. pp 202-208. [ Links ]
4. Sullivan OEJ. Electrochemical technology. Electrochem Soc Japan; 2000. p. 159. [ Links ]
5. Plieth W. Electrochim Acta. 1992;37:2115. [ Links ]
6. Anik T, El Haloui A, Touhami ME, et al. Surf Coat Technol. 2014;245:22. [ Links ]
7. Li J, Hayden H, Kohl PA. Electrochim Acta. 2004;49:1789. [ Links ]
8. Kou SC, Hung A. Plat Surf Finish. 2003;90:44. [ Links ]
9. Gan X, Wu Y, Liu L, et al. J Appl Electrochem. 2007;37:899. [ Links ]
10. Gan X, Wu Y, Liu L, et al. Surf Coat Technol. 2007;201:7018. [ Links ]
11. Suarez DF, Olson FA. J Appl Electrochem. 1992;22:1002. [ Links ]
12. Alodan MA, Smyrl WH. J Electrochem Soc. 1998;145:957. [ Links ]
13. Cofre P, Bustos A. J Appl Electrochem. 1994;24:564. [ Links ]
14. Fabricius G, Kontturi K, Sundholm G. J Appl Electrochem. 1996;26:1179. [ Links ]
15. Muresan L, Varvara S, Maurin G, et al. Hydrometallurgy. 2000;54:161. [ Links ]
16. Varvara S, Muresan L, Popescu IC, et al. J Appl Electrochem. 2003;33:685. [ Links ]
17. Moffat TP, Bonevich JE, Huber W, et al. J Electrochem Soc. 2000;147:4524. [ Links ]
18. West AC, Mayer S, Reid J. Electrochem Solid-State Lett. 2001;4:C50. [ Links ]
19. Flott LW. Metal Finish. 1996;94:55. [ Links ]
20. Passal F. Plating. 1959;46:628. [ Links ]
21. Hosseini M, Ebahimi S. J Electroanaly Chem. 2010;645:109. [ Links ]
22. Pasquale MA, Gassa LM, Ariva AJ. Electrochim Acta. 2008;53:5891. [ Links ]
23. D. Landolt. Corrosion et chimie de surface des metaux traite de materiaux. Polytechnique et universitaire Romandes: Paris; 1993. p. 488-499.
24. Mattson E, Bockris JOM. Trans Faraday Soc. 1959;55:1586. [ Links ]
25. Losev VV, Skribnyi LE, Molodov AI. Elektrokhimiya. 1966;2:1431. [ Links ]
26. Stoychev D, Tsvetanov C. J Appl Electrochem. 1996;26:741. [ Links ]
27. Ohno I, Wakabayashi O, Haruyama S. J Electrochem Soc. 1985;132:2323. [ Links ]
28. Diard JP, Gorrec B, Montella C. Cinetique electrochimique. Edition Hermann; 1996. [ Links ]
29. Bouyanzer A, Hammouti B, Majidi L. Mater Lett. 2006;60:2840. [ Links ]
30. Benabdellah M, Souane R, Cheriaa N, Abidi R, Hammouti B, Vicens J. Pigment Resin Technol. 2007;36:373.
31. Cole KS, Cole RH. J Chem Phys. 1941;9:341. [ Links ]
32. Marusic K, curkovic HO, Takenouti H. Electrochim Acta 2011;56:7491. [ Links ]
Acknowledgements
The authors are thankful to Nemotek Technology, for the financial assistance.
*Corresponding author. E-mail address: azarrouk@gmail.com
Received April 9, 2017; accepted September 4, 2017

