


Serviços Personalizados
Journal
Artigo
 Inglês (pdf)
 Artigo em XML
 Referências do artigo
 Enviar este artigo por email
Indicadores
-
 Citado por SciELO
 -
 Acessos
Links relacionados
-
 Similares em
SciELO
Similares em
SciELO
Compartilhar

 Permalink
Portugaliae Electrochimica Acta
versão impressa ISSN 0872-1904
Port. Electrochim. Acta vol.35 no.5 Coimbra set. 2017
https://doi.org/10.4152/pea.201705279
Corrosion Inhibition of Aluminium in Acidic Media by Different Extracts of Trigonellafoenum-graecum L Seeds
A. Ennouri* , A. Lamiri and M. Essahli
University Hassan 1, Faculty of Science and Techniques, Laboratory of Applied Chemistry and Environment, P.O. Box 577, Settat, Morocco
Abstract
The corrosion inhibition of aluminum by the extract of Trigonellafoenum-graecum L was studied in a hydrochloric acid 1 M solution using electrochemical polarization measurements and electrochemical impedance spectroscopy (EIS). Three organic solvents, pentane, dichloromethane (DCM) and ethanol, of different polarities, were tested. An inhibition efficiency of 86.6 %, 84.41 %, and 75.77 % was obtained by the addition of 1400 ppm of the extract using three solvents: DCM, ethanol and pentane, respectively. The potentiodynamic curves show that the decrease of aluminum corrosion in the presence of the fenugreek extract in a HCl 1 M solution mainly acts by a mixed process with an anodic tendency for both extracts with ethanol and with pentane; on the other hand, the extract with DCM showed a cathodic tendency. The temperature effect on the corrosion of aluminum indicates that the inhibition efficiency of the natural substance decreases with an increase in temperature. The inhibition efficiency values obtained from the polarization curves are in good agreement with those of EIS.
Keywords: aluminum, inhibition, corrosion, fenugreek, extract, solvent, hydrochloric acid.
Introduction
Corrosion is a natural phenomenon, which can be considered either chemical or electrochemical in nature, and it degrades the properties of metal and its alloys making them unusable. Aluminum is a soft, durable, lightweight, malleable metal with appearance ranging from silvery to dull gray, depending on the surface roughness and is nonmagnetic and non-sparkling. Aluminum and its alloys are recommended for building purposes and for various internal outfits, at various industries and highly polluted places. Aluminum is remarkable for its low density and ability to resist to corrosion to some extent, due to the phenomenon of passivation, but its corrosion always takes place in aqueous acidic conditions.
The corrosion of aluminum and its alloys in acid solutions has been extensively studied [1-2]. Some chemicals are currently used in the industry as corrosion inhibitors to prevent or reduce the corrosion rate of metals in acidic mediums. Due to the toxic nature and high cost of these chemicals, it is necessary to environmentally develop acceptable and less expensive inhibitors. Some natural products have been evaluated as potential corrosion inhibitors for different metals [3-4]. Natural products such as plants contain different organic compounds (viz-alkaloids, steroids, aminoacids, tannins, flavanoids, etc.), and most of them are known to have an inhibitive action. Studies [5-6] have incited us to take advantage of the program of our laboratory to study natural extracts of essential oil as corrosion inhibitors. We have found that thyme [7-8], artemisia [8], castor-oil plant [9], spearmint [10] and verbena [11], etc., have got the power to be very effective corrosion inhibitors in acidic media.
The purpose of this work is to study the corrosion inhibition of aluminum in HCl 1 M using Trigonellafoenum-graecum L extract obtained via three solvents of different polarities by electrochemical polarization measurements and electrochemical impedance spectroscopy methods. The temperature effect is also studied.
Experimental part
The inhibitor
Extraction of Trigonellafoenum-graecum L oil
With the aim of estimating the capacity of extraction of three organic solvents on equipments, the extractions were realized in the same operating conditions: a mass of powder of 100 g seeds with a 600 mL volume of solvent, an occupancy rate of material to be extracted from 80 %. The results obtained for the three solvents in terms of overall efficiency are presented in Fig. 1:
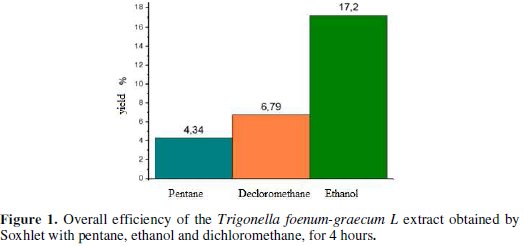
Fig. 1 shows that the extraction yield with ethanol is the highest.This is due to the fact that ethanol extract contains many more chemical substances.
After the extraction, the extract was saved and preserved in an opaque flask and stored at 4 °C before its use.
Chemical composition and identification of the compounds
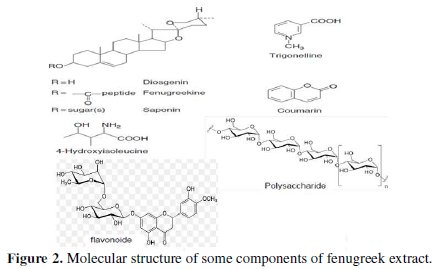
The work done on the chemical analysis of fenugreek (Fig. 2) shows that the grain contains the following substances:
• proteins, carbohydrates and mucilage [12-13-14];
• saponins [15];
• polysaccharide [16-17];
• steroidal sapogenins: diosgenin, gitogenin and tigogenin [18];
• fenugreekine [19];
• arginine, glycine and alanine [20-21];
• 4-hydroxyisoleucine [22];
• trigonelline [23];
• flavonoids, carotenoids, coumarins [24].
Corrosive solution
The solution of HCl 1 M was prepared by dilution of hydrochloric acid with analytical quality of 37% using distilled water. The test solutions were freshly prepared before every experience, by directly adding the extract to the corrosive solution.
Electrochemical measurements
Electrochemical measurements were carried out in a conventional three-electrode electrolysis cylindrical Pyrex glass cell. The working electrode (WE) had the form of a disc cut from aluminum with a geometric area of 1 cm2. A saturated calomel electrode (SCE) and a disc platinum electrode were respectively used as reference and auxiliary electrodes. The temperature was thermostatically controlled at 25 °C. The WE was abraded with different emery papers up to 1200 grade, degreased with acetone, and rinsed with distilled water before use.
Running was done on a compatible computer, Voltab Master 4 Software, which communicated with the potentiostat-galvanostat model PGZ100, at a scan rate of 10 mV/sec. Before recording the polarization curves, the working electrode was maintained for 30 min at Ecorr. The resulting current was plotted as a function of the potential.
Polarization resistance (Rp) values were obtained from the current-potential plot. The scan rate was 10 mV/sec. Electrochemical impedance spectroscopy (EIS) measurements were carried out with an electrochemical system which included a digital potentiostat model Volta lab PGZ 100 computer at Ecorr; after immersion in solution, the circular surface of 1 cm2 aluminum exposing to the solution was used as working electrode.
Frequencies between 100 kHz and 10 mHz were superimposed on the corrosion potential. The impedance diagrams are given in the Nyquist representation.
Results and discussion
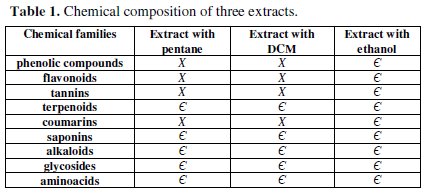
Chemical composition of three extracts of fenugreek obtained by three solvents
To determine the chemical composition of the three extracts, several procedures have been completed. Table 1 summarizes the presence (E) and absence (X) of a chemical family in the three extracts:
Potentiodynamic polarization measurements
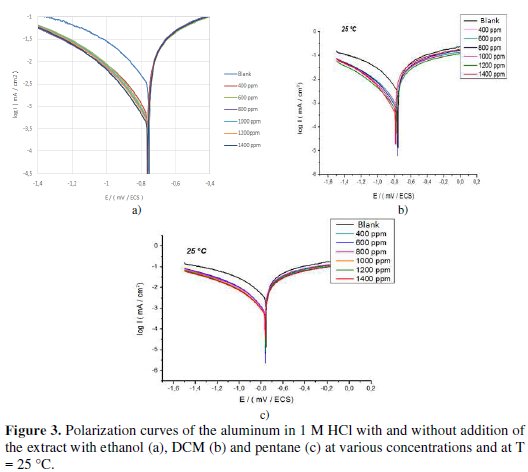
Fig. 3.1, 3.2 and 3.3 show the plots of cathodic and anodic polarization of the aluminum immersed in 1 M HCl at 25 °C, in absence and in presence of various inhibitor's concentrations.
The electrochemical data, the corrosion potential (Ecorr), the cathodic (βc) and anodic (βa) Tafel slopes, and the current density of corrosion (Icorr) are listed in Table 2.
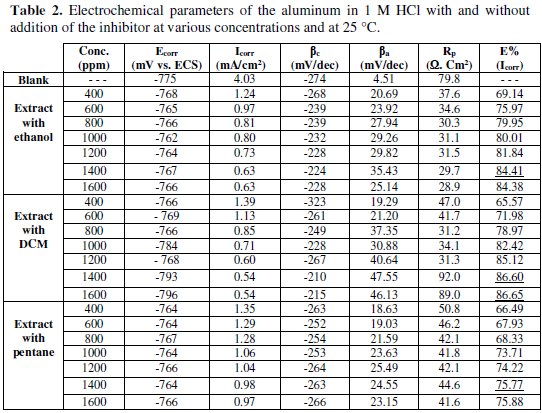
The inhibition efficiency (IE%) is calculated by:
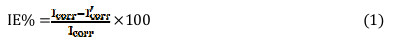
where Icorr and I'corr represent the current densities of corrosion determined by extrapolation of Tafel slopes to the corrosion potential, respectively, with and without addition of the inhibitor.
In the used experimental conditions, the cathodic branch represents the reaction of hydrogen formation, and the anodic branch represents the dissolution of aluminum. The inspection of these results reveals that the corrosion current density (Icorr) decreased in the presence of the inhibitor. This behavior translates its capacity to inhibit the aluminum corrosion in a solution of 1 M HCl.
According to Fig. 3 and Table 2, we note that, in the presence of the inhibitor:
- for the three extracts the corrosion current density Icorr decreases as the inhibitor's concentration increases;
- the addition of the three extracts modifies the values of Ecorr, and it is observed that the inhibitory efficiency (IE%) increases with an increase in the inhibitor's concentration;
- the inhibitor can be classified as cathodic or anodic, if the difference in corrosion potential is greater than 85 mV relative to the corrosion potential of the blank [25]; the values of the corrosion potential vary to the anodic potential in the presence of both extracts with ethanol and pentane. This observation clearly shows that these two extracts can be classified as mixed inhibitors with an anodic pattern. However, in the case of the extract with DCM, the values of Ecorr regularly vary to the cathodic potential relative to the aluminum corrosion potential in the presence of acid alone; so, the inhibitor can be classified as a mixed corrosion inhibitor with a cathodic pattern;
- cathodic Tafel slopes (βc) have significantly changed with the addition of the three extracts, indicating that the adsorbed inhibitory molecules affect the evolution of hydrogen; that is to say, hydrogen evolution is not solely reduced by the locking surface effect;
- the results also show that the anodic Tafel slopes (βa) vary with the addition of the inhibitor, indicating the change in the metal dissolution process;
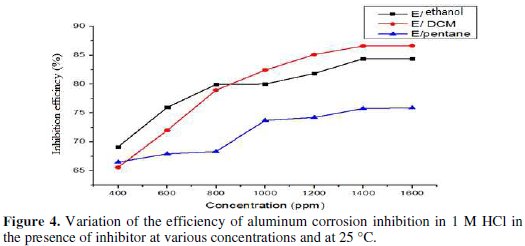
- the inhibition efficiency values calculated on the values of Icorr obtained in the absence and presence of the extract with the three solvents reached 84.41% for the extract with ethanol, 86.6% for the extract with DCM and 75.77% for the extract with pentane at 1400 ppm (Fig. 4).
Electrochemical impedance spectroscopy (EIS)
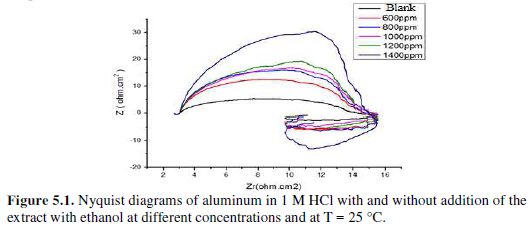
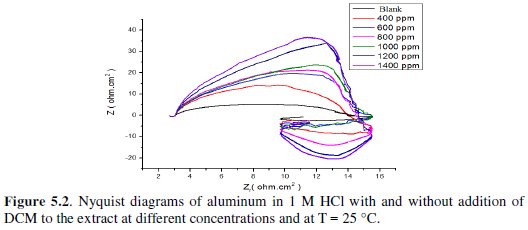
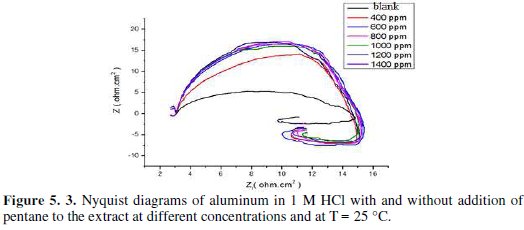
Fig. 5 represents Nyquist diagrams for aluminium in 1 M HCl at 25 °C without and with various concentrations of fenugreek.
Electrochemical impedance spectroscopy (EIS)
The impedance spectra consist of a large capacitive loop at high frequency (HF), followed by a large inductive one at low frequency values.
Generally, the small inductive loop at low frequency (LF) is always observed for aluminium in hydrochloric acid [26-27-28-29], and the diameter of the inductive loop is drastically smaller than that of the capacitive loop at higher frequencies. After adding fenugreek, the shape is not changed throughout a series of inhibitor's concentrations, indicating that there is almost no change in the corrosion mechanism due to the inhibitor addition.
According to Mansfeld et al. [30], Bessone et al. [31], Wit and Lenderink [32], and Brett [33], the capacitive loop at HF could be assigned to the formation of an oxide layer on Al. In the experiments, it is reasonable to assume that the electrode surface has been covered with an oxide layer, because of the ex situ pretreatment of the electrode. In fact, it is very difficult to produce an oxide free Al surface. Even if producing such a surface, it is very fastly repassivated by O2 [34]. The capacitive loop at HF corresponds to the interfacial reactions, particularly, the reaction of aluminum oxidation at the metal/oxide/electrolyte interface [33]. In the present system, the oxide layer is dissolved in 1 M HCl. The dissolution process mainly includes the formation of Al+ ions at the metal/oxide interface, and their migration through the oxide/solution interface, where they are further oxidized to Al3+. In the presence of the inhibitor, the complex of [metaloxide- hydroxide-inhibitor]ads could also be formed [35]. The fact that all these processes are represented by only one loop could be attributed either to the overlapping of the loops of processes, or to the assumption that one process dominates and, therefore, excludes the other processes [32].
On the other hand, the cause of the inductive loop at low frequency is still uncertain. The relaxation of adsorbed charged intermediates may result in the inductive loop [36]. This is more pronounced when the intermediates are strongly adsorbed. The relaxations of adsorbed species include Hads+ [37], Cl- [38], O2- ion [39] or inhibitor species [40] on the electrode surface. It might be also attributed to the re-dissolution of the oxide layer surface [41] or Al-dissolution [38] at low frequencies. Inductive behavior is also observed for the pitted active state and attributed to the surface area modulation or salt film property modulation [42]. Nevertheless, the sizes of both capacitive and inductive loops significantly increase with an increase in the inhibitor's concentration. This suggests that the impedance of the inhibited substrate increases with fenugreek concentration, which in turn leads to a lower corrosion of Al. Noticeably, these high frequency loops are not perfect semicircles, which can be attributed to the frequency dispersion as a result of the roughness and inhomogeneity of the electrode surface [43].
The dielectric parameters are given in Table 3.
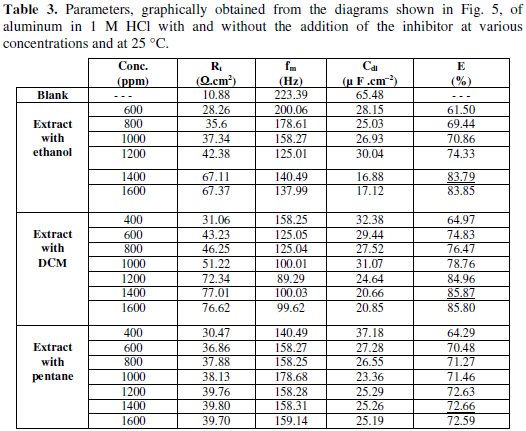
The values of R'T increase with the growth of the inhibitor's concentration, while Cdl values decrease. Increasing may suggest the formation of a protective layer on the surface of the electrode [44]. The inhibitory effectiveness was determined by:
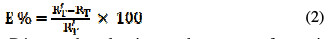
where RT and R'T are the aluminum charge transfer resistance in 1 M HCl medium in, respectively, the absence and presence of the inhibitor at Ecorr = -777 mV / ECS.
The charge transfer resistance values (RT) were calculated based on the difference between impedance values at lower and higher frequencies. The ability of the double layer (Cdl) and the frequency (fmax) at which the imaginary component of the impedance is maximum (-Zmax) are represented by:
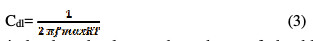
The values of Cdl are judged to be lower than those of the blank values, confirming the adsorption of the inhibitor onto the metal surface, forming an electronic double layer [45].
These results are in good agreement with those obtained by polarization, where fenugreek extract proves to be a good inhibitor for aluminum in 1 M HCl with an efficiency of 83.79% in the extract with ethanol, 85.87% for the extract with DCM and 72.66% for the extract with pentane at 1400 ppm.
In such a corrosion process, an intermediate stage of adsorption of the species can take place in the electrode. This one shows itself on the diagram of impedance, represented in the Nyquist plots, by an inductive loop (Fig. 6) [46].
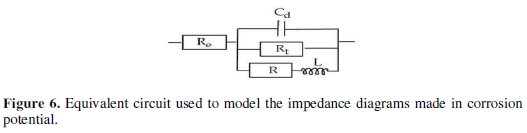
It is modelled by a resistance, R, and an inductance, L, in parallel with the circuit of Randles [47,48].
The total impedance of the circuit is given by the following relation:

The faradic impedance is calculated in the following way:

we know that:

and the load transfer resistor, Rtc
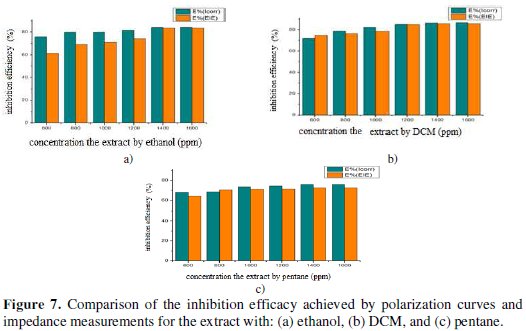
The comparison of both techniques shows that the IE (%) obtained by using the impedance technique is comparable and is parallel to those obtained by polarization curves (Fig. 7).
Effect of temperature
Temperature is an important factor in the studies on metal dissolution. The corrosion rate in acidic solutions, for example, exponentially increases with an increasing temperature, due to the decrease on the evolution of the hydrogen overvoltage [49].
The Icorr value was obtained by extrapolation of Tafel straight experiments conducted at 10, 20, 30, and 40 °C. The polarization curves for aluminum in a 1 M HCl solution in the temperature range (10-40 °C) are shown in Figs. 8, with and without 1400 ppm of extract with the three solvents.
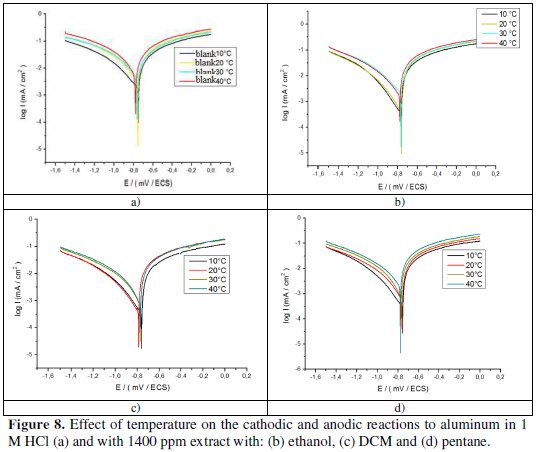
The different numerical values of the variation of corrosion current density (Icorr), corrosion potential (Ecorr), cathodic Tafel slope (βc), and slope anodic Tafel (βa) to 1400 ppm of inhibitor in all studied temperatures studied are given in Table 4.
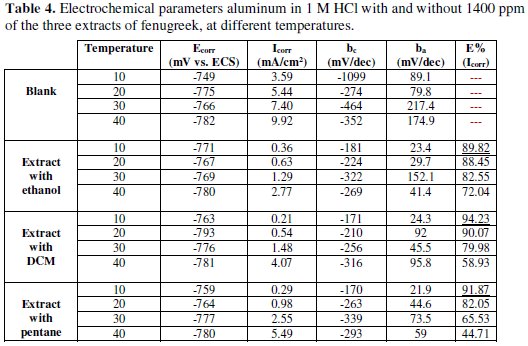
From the obtained results, we can make the following remarks:
- the current densities increase with an increase on the temperature from 10 to 40 °C; the areas in the cathodic part are parallel, indicating that the reduction of H+ ions to the aluminum surface takes place according to the same mechanism of pure activation throughout the temperature range;
- the corrosion potential of aluminum (Ecorr) is slightly modified by increasing the temperature from 10 to 40 °C in 1 M HCl, with and without the inhibitor;
- in general, the increase of the temperature causes an increase in Icorr values throughout the studied temperature range. The evolution of corrosion currents in only a corrosive solution (1 M HCl) shows a sharp growth, confirming an increasing metal dissolution with an increasing temperature. The increase in the corrosion current with temperature in presence of the inhibitor extract for three solvents is low compared to the control;
- these results confirm that the three extracts inhibit corrosion in the temperature range with high efficiency in the case of the extract with DCM.
- For the acid corrosion, many authors [50] have used the Arrhenius equation to account for the effect of temperature (T) on the rate of corrosion and, therefore, consider that the logarithm of the speed corrosion W is a linear function of 1/T.
We can calculate the activation energies from the following relationships:
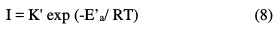
where K and K' are constants (pre-exponential Arrhenius parameter), and Ea and E'a are activation energies, respectively, in the absence and presence of the inhibitor.
Some conclusions on the mechanism of action of the inhibitors may be obtained by comparing measured Ea at both the presence and absence of the corrosion inhibitor. Fig. 9 shows the Arrhenius plot coordinates of the aluminum corrosion rate in 1 M HCl, in the absence and presence of 1400 ppm of the three extracts of fenugreek.
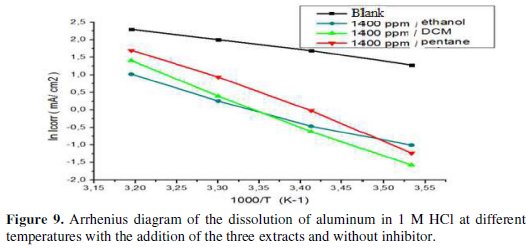
The variation of the logarithm of the corrosion current as a function of 1/T gives lines indicating that the Arrhenius law is respected. The values of the activation energy obtained from these lines are given in Table 5.
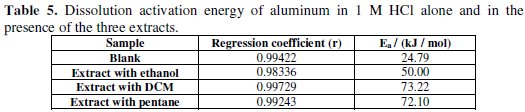
From the obtained results, we may conclude that the studied inhibitors adsorb onto the surface by the electrostatic nature of links (physisorbed to the electrode surface). Indeed, the Ea values for the three extracts are greater than the Ea value obtained for the inhibitor-free solution. The extract with DCM has a higher activation energy.
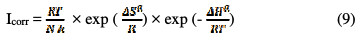
The kinetic parameters, the enthalpy and entropy of the corrosion process are also evaluated from the study on the effect of temperature. An alternative formulation is the Arrhenius equation [51]:
where h is Planck's constant, N is the number of Avogadro, ΔSa is the entropy of activation, and ΔHa is the activation enthalpy. Fig. 10 shows plots of ln (Icorr / T) versus 1/T.
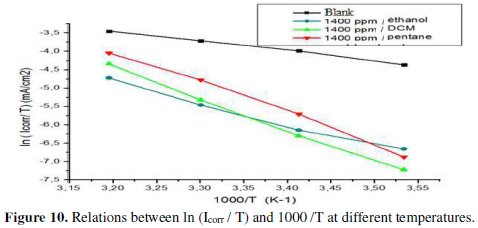
Straight lines are obtained with a slope -ΔHa / R and an intercept (Ln R / Nh + ΔSa / R), from which values of ΔSa and ΔHa can be calculated, and these values are given in Table 6.
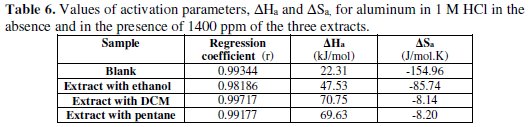
The enthalpy positive signs (ΔHa) reflect the endothermic nature of the aluminum dissolution process. Indeed, the increase in enthalpy ΔHa activation corresponds to a decrease on the metal dissolution.
And high negative values of the entropy, ΔSa, mean that there is a decrease on the disorder when processing complex reagents active in the solution [52].
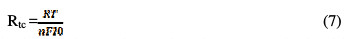
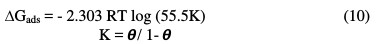
The thermodynamic data confirm the physisorption of the three extracts of fenugreek on the surface of pure aluminum in a 1 M HCl medium. For the values of the free energy of adsorption, ΔGads, three extracts on the Al surface were calculated using equation (7) [53]; these values are given in Table 7.
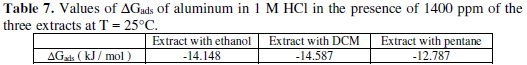
The values of ΔGads were negative at 25 °C for these three extracts, indicating spontaneous adsorption of the inhibitor on the surface of aluminum, through the mechanism of physisorption (ΔGads < 40 kJ / mol) [53].
Explanation for inhibition
The inhibitive action of fenugreek towards the acid corrosion of aluminium can be attributed to the adsorption of the components of fenugreek on the aluminium surface. Some important constituents of fenugreek are saponins, polysaccharide, steroidal sapogenins, fenugreekine, arginine, glycine and alanine, 4-hydroxyisoleucine, and trigonelline. These chemical structures are shown in Fig. 2.
Obviously, each compound contains many oxygen atoms in functional groups of O-H, C=O, C-O and O-heterocyclic ring, which meets the general measuring conditions for typical corrosion inhibitors.
As discussed above on activation parameters, adsorption is mainly physical adsorption. Consequently, the adsorption mechanism is presented. According to Fig. 2, these compounds could be protonated in the acid solution, due to the interaction between O atom and H+. The mechanism for anodic dissolution of aluminium in a HCl solution was proposed as the following steps [54]:


As mentioned above, the protonated compounds in fenugreek can interact with AlClads- species, which are formed in steps (11) through electrostatical force, and then prevent oxidation reaction of AlClads- to AlCl2+, as shown by reaction (12).
Also, owing to the lone-pair electrons of O atoms of these main constituents shown in Fig. 2, these compounds may combine with Al3+ ions to form the metal inhibitor complexes. These complexes might get adsorbed onto aluminium surface by van der Waals forces, to form a protective film which keeps aluminium from corrosion.
Conclusions
From the results of our study we can conclude the following:
- all extracts effectively inhibit the corrosion of Al, but the extract with DCM appears to be better than the others;
- the addition of these extracts reduced the anodic dissolution and retarded the hydrogen evolution reaction;
- the molecules characterizing these extracts act as mixed corrosion inhibitors with an anodic trend for both extracts with ethanol and pentane, and a cathodic trend for the extract with DCM;
- the efficiency increases with the increase on the concentration of the inhibitor, to reach 84.41% for the extract with ethanol, 86.6% for the extract with DCM, and 75.77% for the extract with pentane to 1400 ppm;
- the adsorption constants values of the three extracts are characterized by physical adsorption of the inhibitor on the surface of aluminum;
- the ΔGads values are negative and less than 40 kJ/mol; this proves that it is a physical adsorption, and that the adsorption process is spontaneous;
- the pattern of inhibition efficacy of the different extracts was in this order: extract with DCM > extract with ethanol > extract with pentane.
References
1. El-Etre A. Corros Sci. 2003;45:2485. [ Links ]
2. Muller B, Corros Sci. 2002;44:1583. [ Links ]
3. Jain T, Chowdhary R, Mathur SP. Mater Corros. 2006;57:422. [ Links ]
4. Chaieb E, Bouyanzer A, Hammouti B, et al. Appl Surf Sci. 2005;246:199. [ Links ]
5. El-Etre AY, Abdallah M, El-Tantany ZE. Corros Sci. 2005;47:385. [ Links ]
6. Chowdhary R, Jain T, Rathoria MK, et al. Bull Electrochem. 2004;20:67. [ Links ]
7. Houbairi S, Essahli M, Lamiri A. Port Electrochim Acta. 2013;31:221. [ Links ]
8. Houbairi S, Essahli M, Lamiri A. Int J Eng Res Technol. 2014;3:2. [ Links ]
9. Houbairi S, Lamiri A, Essahli M, Int J Eng Res Technol. 2014;3:1. [ Links ]
10. Bensabah F, Houbairi S, Essahli M, et al. Port Electrochim Acta. 2013;31:195. [ Links ]
11. Bensabah F, Houbairi S, Essahli M, et al. J Adv Chem. 2014. [ Links ]
12. Baccou JC, Sauvaire Y, Ollie V, et al. Rev Fr Corbs Gras. 1978;25:353. [ Links ]
13. El-Mahdy AR, El-Sebaiy LA. Food Chem. 1985;18:19. [ Links ]
14. Rao P, Sharma RD. Food Chem. 1987;24:1. [ Links ]
15. Sharma RD. Nutr Rep Int. 1986;33:669. [ Links ]
16. Chatterjee BP, Sakar N, Rao AS. Carbohyd Res. 1982;104:348. [ Links ]
17. Valette G, Sauvaire Y, Baccou JC, et al. Atherosclerosis. 1984;50:105. [ Links ]
18. Anis M, Aminuddin E. Fitoterapia. 1985;56:51. [ Links ]
19. Ghosal S, Srivastava RS, Chatter DC, et al. 1974;13:2247.
20. Gopalan C, Shastri BVR, Balasubramanyan SC. Nutritive value of Indian foods. Hyderabad, India: National Institute of Nutrition (ICMR); 1978. [ Links ]
21. Sharma RD. Nutr Rep Int. 1984;30:221. [ Links ]
22. Sauvaire Y, Girardon P, Baccou JC, et al. Phytochem. 1984;23:479. [ Links ]
23. Mishkinsky J, Joseph B, Sulman F. Lancet. 1967;1311. [ Links ]
24. Varshney IP, Sharma SC. J Indian Chem Soc. 1996;43:564. [ Links ]
25. Satapathy AK, Gunasekaran G, Sahoo SC, et al. Corros Sci. 2009;51:2848. [ Links ]
26. Yurt A, Ulutas S, Dal H. Appl Surf Sci. 2006;253:919. [ Links ]
27. Zhang QB, Hua YX. Mater Chem Phys. 2010;119:57. [ Links ]
28. Oguzie EE, Okolue BN, Ebenso EE, et al. Mater Chem Phys. 2004;87:394. [ Links ]
29. Khaled KF, Al-Qahtani MM. Mater Chem Phys. 2009;113:150. [ Links ]
30. Mansfeld F, Lin S, Kim K, et al. Corros Sci. 1987;27:997. [ Links ]
31. Bessone J, Mayer C, Jutter K, et al. Electrochim Acta. 1983;28:171. [ Links ]
32. de Wit JHW, Lenderink HJW. Electrochim Acta. 1996;41:1111. [ Links ]
33. Brett CMA. Corros Sci. 1992;33:203. [ Links ]
34. Burstein GT, Cinderey RJ. Corros Sci. 1992;32:1195. [ Links ]
35. Metlkos-Hukovic M, Babic R, Grubac Z. J Appl Electrochem. 1998;28:433. [ Links ]
36. Amin MA, Mohsen Q, Hazzai OA. Mater Chem Phys. 2009;114:908. [ Links ]
37. Lenderink HJW, Linden MVD, de Wit JHW. Electrochim Acta. 1993;38:1989. [ Links ]
38. Noor EA. Mater Chem Phys. 2009;114:533. [ Links ]
39. Valand T, Heusler KE. J Electroanal Chem. 1983;149:71. [ Links ]
40. Singh AK, Quraishi MA. Corros Sci. 2010;52:152. [ Links ]
41. Abd El Rehim SS, Hassan HH, Amin MA. Mater Chem Phys. 2001;70:6472. [ Links ]
42. Bessone JB, Salinas DR, Mayer C, et al. Electrochim Acta. 1992;37:2283. [ Links ]
43. Lebrini M, Lagrenee M, Vezin H, et al. Corros Sci. 2007;49:2254. [ Links ]
44. Behpour M, Ghoreishi SM, Mohammadi N, et al. Corros Sci. 2010;52:4046. [ Links ]
45. Kumar KPV, Pillai MSN, Thusnavis GR. Port Electrochim Acta. 2010;28:373. [ Links ]
46. Amin MA, Mohsen Q, Hazzai OA. Mater Chem Phys. 2009;114:908. [ Links ]
47. Noor EA. Mater Chem Phys. 2009;114:533. [ Links ]
48. Zhao M, Wu S, An P, et al. Appl Surf Sci. 2006;253:468. [ Links ]
49. Popova A, Sokolova E, Raicheva S, et al. Corros Sci. 2003;45:33. [ Links ]
50. Fiala A. Universite Mentouri-Constantine: These d'etat.; 2007. [ Links ]
51. Abd El Rehim SS, Sayyah SM, Azooz RE. Port Electrochim Acta. 2012;30:67. [ Links ]
52. Faustin M. Etude de l'effet des alcaloides sur la corrosion de l'acier C38 en milieu acide chlorhydrique 1M. Cayenne: PhD thesis; 2013. [ Links ]
53. Alinnor IJ, Ejikeme PM. Corrosion inhibition of aluminium in acidic medium by different extracts of ocimumgratissimum. Nigeria: PhD Thesis; 2012. [ Links ]
54. Bereket G, Pinarbsi A. Corros Eng Sci Tech. 2004;39:308-312. [ Links ]
*Corresponding author. E-mail address: amal.ennouri@gmail.com
Received October 16, 2016; accepted March 17, 2017

