


Serviços Personalizados
Journal
Artigo
 Inglês (pdf)
 Artigo em XML
 Referências do artigo
 Enviar este artigo por email
Indicadores
-
 Citado por SciELO
 -
 Acessos
Links relacionados
-
 Similares em
SciELO
Similares em
SciELO
Compartilhar

 Permalink
Portugaliae Electrochimica Acta
versão impressa ISSN 0872-1904
Port. Electrochim. Acta vol.35 no.3 Coimbra maio 2017
https://doi.org/10.4152/pea.201703159
Theoretical and Experimental Studies on the Corrosion Inhibition Potentials of Two Tetrakis Pyrazole Derivatives for Mild Steel in 1.0 M HCl
Y.E. Louadia , F. Abrigacha , A. Bouyanzera , R. Touzania,b , A. El Assyryc , A. Zarrouka and B. Hammoutia,*
a LCAE-URAC18, Faculty of Science, Mohammed First University, P.O. Box 717, 60000 Oujda, Morocco
b Faculte Pluridisciplinaire de Nador, Universite Mohammed Premier, BP: 300, Selouane 62700, Nador, Morocco
c Laboratoire d'Optoelectronique et de Physico-chimie des Materiaux, (Unite associee au CNRST), Universite Ibn Tofail, Faculte des Sciences, B.P. 133, Kenitra, Morocco
Abstract
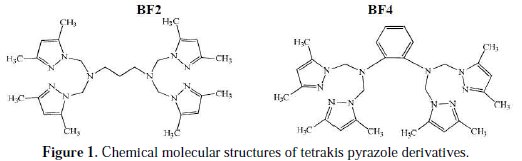
The inhibition performance and mechanism of N1,N1,N3,N3-tetrakis((3,5-dimethyL-1Hpyrazol- 1-yl)methyl)propane-1,3-diamine (BF2) and N1,N1,N2,N2-tetrakis((3,5-dimethyl- 1H-pyrazoL-1-yl)methyl) benzene-1,2-diamine (BF4) for the corrosion of mild steel in 1.0 M HCl were investigated using weight loss method and electrochemical measurements. The results show that both tetrakis pyrazole derivatives act as good inhibitors, and inhibition efficiency follows the order: BF4 > BF2. Two tetrakis pyrazole derivatives are mixed type inhibitors exhibiting predominantly cathodic behavior. The Nyquist plots showed that, after increasing inhibitors' concentrations, charge-transfer resistance increased and double-layer capacitance decreased, involving increased inhibition efficiency. The adsorption of both inhibitors on a steel surface obeyed Langmuir model, thus, the thermodynamic and kinetic parameters were calculated and discussed. Quantum chemical parameters are calculated using the Density Functional Theory method (DFT). Correlation between theoretical and experimental results is discussed.
Keywords: Mild steel; corrosion inhibition; weight loss; electrochemical techniques; DFT.
Introduction
Acid solutions are widely used in industry, such as acid pickling, industrial acid cleaning, acid descaling and oil-well cleaning [1]. As the most effective and economic method [2,3], inhibitors are applied in these processes to control the metal dissolution. Most of the well known acid inhibitors are organic compounds containing nitrogen, sulphur and oxygen atoms [4-10]. The efficiency of these compounds mainly depends on their abilities to be adsorbed on the metal surface with the polar groups acting as reactive centers.
The corrosion inhibition is a surface process, which involves adsorption of the organic compounds on a metal surface. The adsorption mainly depends on the electronic structure of the molecule [11]. The inhibition efficiency of organic compounds depends on the mode of interaction with the metal surface and molecular structure.
Among numerous inhibitors, N-heterocyclic compounds are considered to be the most effective corrosion inhibitors [12]. Up to now, various N-heterocyclic compounds are reported as good corrosion inhibitors for steel in acidic media, such as triazole derivatives [13-15], pyrazole derivatives [16-19], and bipyrazole derivatives [20-23].
In continuation of our research for developing efficient corrosion inhibitors, [2429] this work represents a systematic study of the corrosion inhibition effect of synthesized pyrazole derivatives, namely N1,N1,N3,N3-tetrakis((3,5-dimethyl1H- pyrazoL-1-yl)methyl)propane-1,3-diamine (BF2) and N1,N1,N2,N2-tetrakis ((3,5-dimethyL-1H-pyrazoL-1-yl)methyl)benzene-1,2-diamine (BF4), on MS in a 1.0 M HCl solution using weight loss measurement, potentiodynamic polarization, electrochemical impedance, and quantum chemical calculations.
Fig. 1 shows all molecular structures used.
Experimental
Materials
The steel used in this study is a mild steel with a chemical composition (in wt%) of 0.09% P, 0.01% Al, 0.38% Si, 0.05% Mn, 0.21% C, 0.05% S and the remainder iron (Fe). The steel samples were pre-treated prior to the experiments by grinding with emery paper (SiC) (220, 400, 800, 1000 and 1200), rinsed with distilled water, degreased in acetone, washed again with bidistilled water and then dried at room temperature before use.
Solutions
The aggressive solutions of 1.0 M HCl were prepared by dilution of analytical grade 37% HCl with distilled water. The concentration range of N1,N1,N3,N3tetrakis(( 3,5-dimethyL-1H-pyrazoL-1-yl)methyl)propane-1,3-diamine (BF2) and N1,N1,N2,N2-tetrakis((3,5-dimethyL-1H-pyrazoL-1-yl)methyl) benzene-1,2 diamine (BF4) used was 10-5 M to 10-3 M.
Gravimetric study
Gravimetric experiments were performed according to the standard methods [30]; the mild steel sheets of 1 × 1 × 0.1 cm were abraded with a series of emery papers, (SiC) (120, 600 and 1200), and then washed with distilled water and acetone. After accurate weighing, the specimens were immersed in a 100 mL beaker containing 250 mL of a 1.0 M HCl solution with and without addition of different concentrations of inhibitor. All the aggressive acid solutions were open to air. After 6 h of acid immersion, the specimens were taken out, washed, dried, and accurately weighed. In order to get good reproducibility, all measurements were performed a few times, and average values were reported to obtain good reproducibility. The inhibition efficiency (ηWL%) and surface coverage (θ) were calculated as follows:
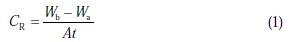
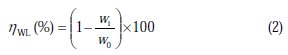
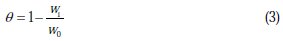
where Wb and Wa are the specimen weight before and after immersion in the tested solution; w0 and wi are the values of corrosion weight losses of mild steel in uninhibited and inhibited solutions, respectively; A is the total area of the mild steel specimen (cm2); and t is the exposure time (h).
Electrochemical measurements
The electrochemical measurements were carried out using a Volta lab (Tacussel- Radiometer PGZ 100) potentiostat, and controlled by Tacussel corrosion analysis software model (Voltamaster 4) under static condition. The corrosion cell used had three electrodes. The reference electrode was a saturated calomel electrode (SCE). A platinum electrode was used as auxiliary electrode with a surface area of 1 cm2. The working electrode was mild steel with a surface of 1.0 cm2. All potentials given in this study were referred to this electrode. The working electrode was immersed in a test solution for 30 min to establish a steady state open circuit potential (E0cp). After measuring the Eocp, the electrochemical measurements were performed. All electrochemical tests were performed in aerated solutions at 308 K. The EIS experiments were conducted in the frequency range with a high limit of 100 kHz and a different low limit of 0.1 Hz at open circuit potential, with 10 points per decade, at the rest potential, after 30 min of acid immersion, by applying 10 mV ac at voltage peak-to-peak. Nyquist plots were made from these experiments. The best semicircle can be fit through the data points in the Nyquist plot using a non-linear least square fit, so as to give the intersections with the x-axis.
The inhibition efficiency of the inhibitor was calculated from the charge transfer resistance values using the following equation:
where, R0ct and Rict are the charge transfer resistance in absence and in presence of the inhibitor, respectively.
After ac impedance test, the potentiodynamic polarization measurements of mild steel substrate in inhibited and uninhibited solution were scanned from cathodic to anodic direction, with a scan rate of 0.5 mV s-1. The potentiodynamic data were analysed using the polarization VoltaMaster 4 software. The linear Tafel segments of anodic and cathodic curves were extrapolated to corrosion potential, to obtain corrosion current densities (Icorr). From the obtained polarization curves, the corrosion current (Icorr) was calculated by curve fitting using the equation:
The inhibition efficiency was evaluated from the measured Icorr values using the following relationship:
where Icorr and Icorr(i) are the corrosion current densities for steel electrode in the uninhibited and inhibited solutions, respectively.
Quantum chemical calculations
Complete geometry optimization of the inhibitor molecules was performed using density functional theory (DFT) with Beck's three-parameter exchange functional along with LeeeYangeParr non-local correlation functional (B3LYP) with 6-1G* basis set using the Gaussian 03 programme package [31]. Frontier molecular orbitals (HOMO and LUMO) were used to interpret the adsorption of inhibitor molecules on the metal surface. According to DFT-Koopman's theorem [32,33], the ionization potential (I) is approximated as the negative of the highest occupied molecular orbital energy (EHOMO) and the negative of the lowest unoccupied molecular orbital energy (ELUMO) are related to the electron affinity (A).


Natural bond orbital (NBO) analysis [34] was performed to evaluate the electron density distributions. The electron density plays an important role in calculating the chemical reactivity parameters. The global reactivities include electronegativity (Ï), global hardness (η) and global softness (σ). They can be calculated from the following equations:
The local reactivity has been analyzed by means of Fukui indices [35], an indication of the reactive centers within the molecules. These are measurements of the chemical reactivity, as well as an indicative of the reactive regions, nucleophilic and electrophilic behavior of the molecule [36]. The condensed Fukui functions were found by taking the finite difference approximations from Mulliken population analysis of atoms in inhibitor molecules, depending on the direction of the electron transfer.

where q (N), q (N + 1), and q (N -1) are the electronic population of the atom k in neutral, cationic and anionic systems, respectively [37].
Results and discussion
Potentiodynamic polarization curves
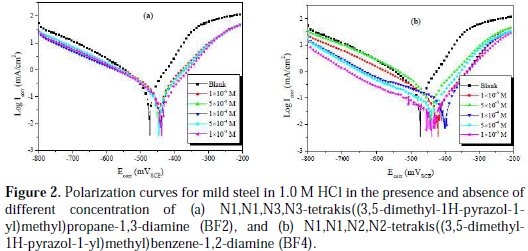
The potentiodynamic measurement results of mild steel in a 1.0 M HCl solution, without and with different range of inhibitors concentrations, were shown in Fig. 2a and b.
The polarization parameters, namely corrosion current density (Icorr), corrosion potential (Ecorr), anodic Tafel slope (βa), cathodic Tafel slope (βc) and percentage inhibition efficiency (ηTafel %) were calculated from the Tafel curves and are given in Table 1.
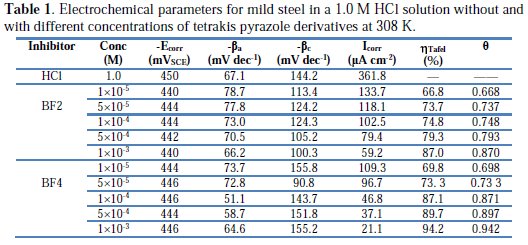
From Fig. 2 it can be observed that both the cathodic and anodic reactions were suppressed with the addition of inhibitor, which suggested that the tetrakis pyrazole derivatives reduced anodic dissolution and also retarded the hydrogen evolution reaction [38].
It is observed that the corrosion potentials (Ecorr) for mild steel in the presence of BF2 (Fig. 2a) and BF4 (Fig. 2b) are slightly shifted towards the positive potentials compared with the mild steel in 1.0 M HCl. Both anodic and cathodic current densities were reduced in the presence of BF2 and BF4, which suggests a mixed-type inhibitor behavior [39].
It is clear from Table 1 that, after increasing the concentration of inhibitor, the inhibition efficiency increased, while the corrosion current density decreased due to adsorption of BF2 and BF4 on the mild steel surface. The minor shift in Ecorr value (10 mV) towards positive direction in the presence of inhibitors, as compared to the Ecorr value in the absence of inhibitor, indicates that BF2 and BF4 act as a mixed type inhibitor with predominant control of the anodic reaction [40]. From Table 1, it is observed that inhibition efficiency increased with an increased concentration of the two tetrakis pyrazole derivatives. Also, the order of corrosion inhibition efficiency for the highest concentration (10-3 M) of the two studied inhibitors is BF4 (94.2%) > BF2 (87.0%).
Electrochemical impedance spectroscopy studies
The Nyquist plots obtained from the EIS measurements for mild steel in 1.0 M HCl solutions at 308 K are shown in Fig. 3.
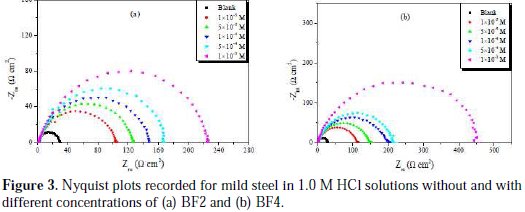
The plots are characterized by a semicircle, which means the process was mainly controlled by capacitance and depressed semicircle, reflecting the surface in-homogeneity of structural or interfacial origin, such as that found in adsorption processes [41]. The capacitive semicircle refers to the double layer capacitance and transfer resistance (Rct). Different size semicircles are shown in Fig. 3. The diameter of the semicircle represents the value of transfer resistance (Rct), which indicates a decreasing trend in corrosion rate. The charge transfer resistance values (Rct) were calculated from the difference between impedance values at lower and higher frequencies, as suggested by Haruyama et al. [42]. The double layer capacitance (Cdl) was obtained from the following equation [43]:
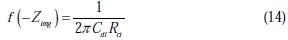
where Zimg is the frequency of maximum imaginary components of the impedance and Rct is the charge transfer resistances.
The calculated electrochemical parameters of EIS measurements are listed in Table 2.
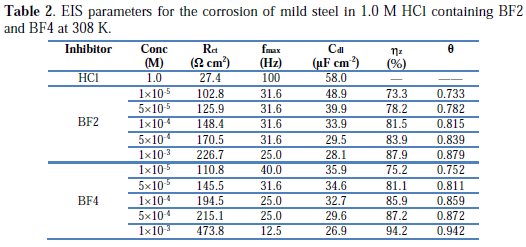
From the electrochemical impedance parameters and the inhibition efficiency (ηz%), which are listed in Table 2, it is clear that the impedance spectra exhibit one single capacitive loop, indicating that: (i) the charge transfer takes place at the electrode/solution interface, (ii) the transfer process controls corrosion reaction, and (iii) the presence of the inhibitor does not change the mechanism of steel dissolution [44].
As the inhibitor concentration increased, the Rct values increased and the Cdl values tended to decrease due to a decrease in local dielectric constant and/or an increase in the thickness of the electrical double layer, suggesting that the inhibitor molecules acted by adsorption at the metal/solution interface. Addition of synthesized inhibitors provided lower Cdl values, probably due to the replacement of water molecules by the inhibitor molecule at the electrode surface. In addition, the inhibitor molecules may reduce the capacitance by increasing the double layer thickness, according to the Helmholtz model [45]:
where ε is the dielectric constant of the medium, ε0 is the vacuum permittivity, A is the electrode surface area and δorg is the thickness of the protective layer. The order of tetrakis pyrazole derivatives remains unchanged; it is as follows: BF4 > BF2. This is also in agreement with the observed order of corrosion inhibition obtained from potentiodynamic measurements.
Weight loss measurements
Effect of tetrakis pyrazole compounds on corrosion rate
Fig. 4 illustrates the corrosion rate (CR) of mild steel in 1.0 M HCl at 308 K in the presence of different concentrations (C) of tetrakis pyrazole compounds (immersion time is 6 h).
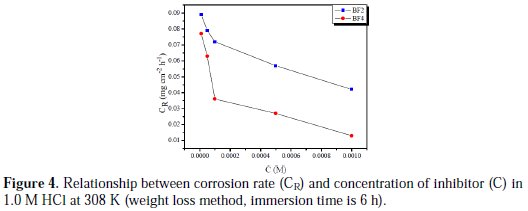
The corrosion rate reduces after addition of the selected two tetrakis pyrazole compounds, and decreases with the inhibitor concentration. This behaviour is due to the fact that the adsorption coverage increases with the increase of inhibitor's concentration, which shields the mild steel surface efficiently from the medium. In the absence of inhibitor, the corrosion rate is as high as 0.32 mg cm-2 h-1, while in the presence of 10-3 M inhibitor, the corrosion rate values are reduced to 0.042 and 0.013 mg for BF2 and BF4, respectively. At any given inhibitor concentration, the corrosion rate follows the order: CR (BF4) < CR (BF2), which indicates that BF4 exhibits the best inhibitive performance among two tetrakis pyrazole compounds.
Effect of tetrakis pyrazole compounds on inhibition efficiency
Fig. 5 represents inhibition efficiency (ηWL) values obtained from the weight loss in 1.0 M HCl solutions in the presence of various concentrations of BF2 and BF4 at 308 K (immersion time is 6 h).
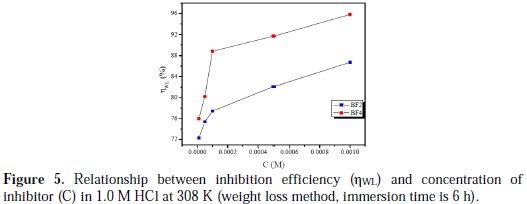
Clearly, ηWL increases with an increase in the inhibitor's concentration. At 10-3 M, the maximum ηWL is 86.7% for BF2, and 95.8% for BF4, which indicates that two tetrakis pyrazole compounds act as good corrosion inhibitors for mild steel in 1.0 M HCl. Inhibition efficiency of the examined tetrakis pyrazole compounds follows the order: BF4 > BF2.
Effect of temperature and thermodynamic activation parameters
Being given that the temperature is one of the factors that may affect the behavior of a material in a corrosive environment, and can also modify the metal- inhibitor interaction, it is essential to study the effect of this factor on the protection rates, as well as to determine the mechanism of inhibition, to calculate the activation energies of the corrosion process.
The study of the influence of temperature on the rate of corrosion inhibition of mild steel by our inhibitors was performed at temperatures 313, 323, 333 and 343 K, in the absence and in the presence of inhibitor at 10-3 M. This study determines the activation energies, enthalpies and entropies of activation of the corrosion process, and thus provides information on the mechanism of inhibition. The corresponding data are shown in Table 3.
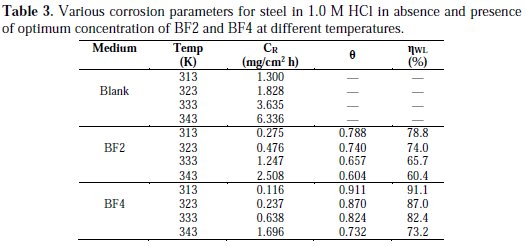
The comparative study of Table 3 showed that the corrosion rate increases with an increase in temperature in both the stabilized and inhibited solutions, while the inhibition efficiency of BF2 and BF4 products decreases. A decrease in the efficiency of inhibition with increasing temperature in the presence of our compounds may be due to the weakening of physical adsorption.
To determine the activation energy, we have used the Arrhenius equation (16) to account for the effect of temperature (T) on the corrosion rate (CR). The change in the log corrosion rate, as a function of the reciprocal of the absolute temperature, is a linear function of T-1, and the corresponding relation (17) provides access to the activation energies:
To access the activation thermodynamic characteristics, enthalpy (ΔHa) and entropy of activation (ΔSa), we have used the Arrhenius equation transition [46]:
where CR is the corrosion rate, R the gas constant, T the absolute temperature, A the pre-exponential factor, h the Plank's constant, N is Avogrado's number, Ea the activation energy for corrosion process, DH a the enthalpy of activation and ΔSa the entropy of activation.
The curves of variation of the logarithm of the corrosion rate as a function of the reciprocal of the absolute temperature (T-1) are recorded in Fig. 6.
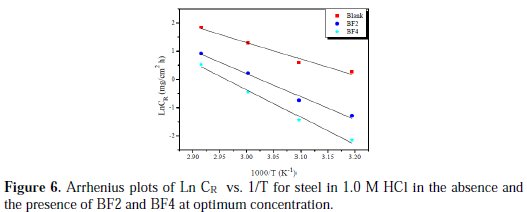
The curves obtained in the form of lines obey the Arrhenius law, which satisfies the relation (17).
Fig. 7 shows the variation of Ln (CR/T) vs. (1/T) as a straight line with a slope of (-ΔHa/ R), and the intersection with the y-axis is [Ln(R/Nh) + (ΔSa / R)].
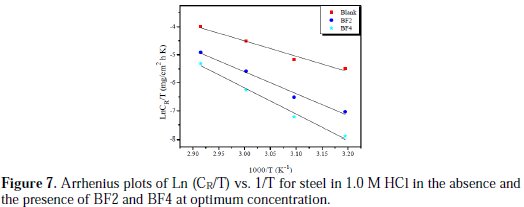
From these relationships, values of ΔSa and ΔHa can be calculated. The activation parameters (Ea, ΔHa and ΔSa) calculated from the slopes of Arrhenius lines in the absence and presence of our inhibitors (Fig. 6 and Fig. 7) are summarized in Table 4.
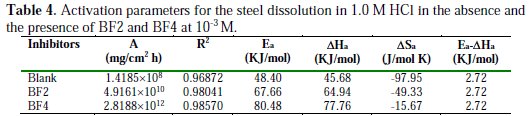
It is evident from Table 4 that the values of the apparent activation energy for the inhibited solutions were higher than those for the uninhibited solution, indicating that the dissolution of mild steel was decreased due to the formation of a barrier by the adsorption of the inhibitors on the metal surface [47].
The values of Ea and ΔHa were increased in the presence of inhibitors, suggesting that the energy barrier of the corrosion reaction increases, which means that the steel dissolution is difficult [48]. According to Gomma et al. [49], the activation energy is much higher when the inhibitor is more effective. However, the positive sign of the endothermic enthalpy reflects the nature of steel dissolution. We note that the variation of the activation energy Ea and the enthalpy of ΔHa vary in the same way with the inhibitor's concentration, which satisfies the relationship between Ea and thermodynamics as ΔHa [50]: Ea - ΔHa = RT. The values of ΔSa were lower for the solution without inhibitor than those for the solution with inhibitor. This may be because the rate-determining step for the activated complex was the association rather than the dissociation step [51]. As seen from Table 4, there is a shift of ΔSa to more positive values in the presence of the inhibitor, thus the increase in disorder is a driving force that can overcome the barriers for the inhibitor's adsorption onto the metal surface.
Adsorption isotherm and thermodynamic parameters
The adsorption isotherms are vital in elucidating the corrosion inhibition mechanism, since they express the interaction of the inhibitor molecule with the active sites on the mild steel surface. Therefore, in this study, several adsorption isotherms were evaluated, namely, Langmuir, Frumkin and Temkin. As can be seen from Fig. 8, straight lines were obtained (R2 is almost equal to unity) by plotting C/θ vs. C at all concentrations studied.
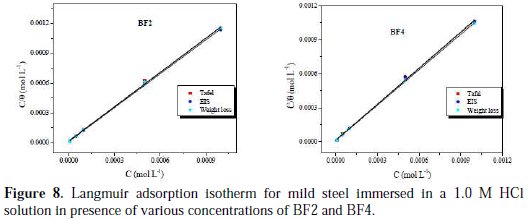
This indicates that the inhibitor is adsorbed on the mild steel surface, according to the Langmuir adsorption isotherm. From the intercepts of the straight lines on the C/θ axis, Kads values were calculated for the adsorption process (Table 5).
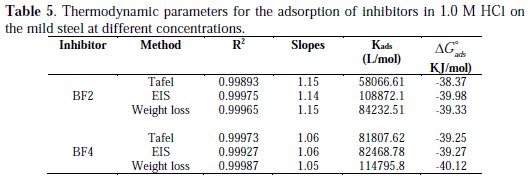
The slope values are mostly equal to unity, indicating the physicochemical adsorption of inhibitor molecules on an active site on the mild steel surface. Free energy of adsorption (ΔGads) was calculated by using the following equation Eq. (19):

where R is the gas constant, T is the absolute temperature of the experiment and the constant value of 55.5 is the concentration of water in a solution in mol L-1.
Table 5 shows the negative values of ΔGads, indicating the spontaneity of adsorption of the inhibitor molecules on the mild steel surface [52]. In general, ΔGads values below -20 kJ mol-1 are due to the physisorption of the inhibitor, whereas ΔGads values above -40 kJ mol-1 are attributed to the chemisorption of the inhibitor molecules on metal surface. In the present study, ΔGads values are between -38.27 and -40.12 kJ mol-1 , which provides evidence for both electrostatic interactions (physisorption) and charge sharing or transferring from the inhibitor to the charged mild steel surface (chemisorption) [53]. Moreover, higher values for the equilibrium constant (Kads) and standard free energy of adsorption (ΔGads) support a better inhibitive activity of the substance [54]. Fig. 8 shows a skeletal representation of adsorption on the charged mild steel surface.
Quantum chemical calculation
Frontier orbital energies
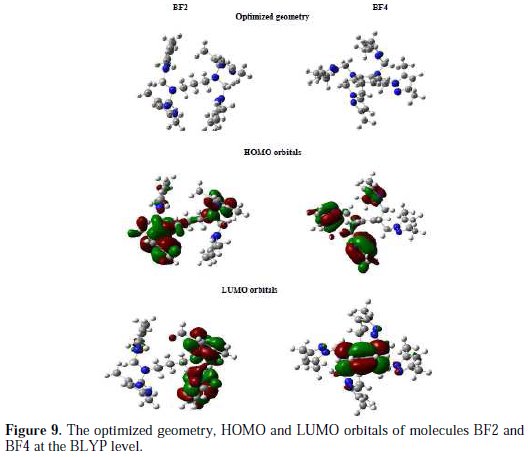
It is well known that the molecular reactivity is mainly analyzed via frontier orbital theory; therefore, it is necessary to investigate the highest occupied orbital (HOMO) and the lowest unoccupied orbital (LUMO) for exploring the adsorption behavior of corrosion inhibitor on the metal surface. The HOMO and LUMO of BF2 and BF4 molecules were calculated and are presented in Fig. 9.
The quantum-chemical parameters related to the BF2 and BF4 molecules are listed in Table 6.
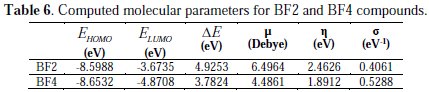
They include: EHOMO, ELUMO, the energy gap (ΔE), dipole moment (μ), the chemical potential, global hardness (σ) and global softness (S).
The highest occupied molecular orbital (EHOMO) and the lowest unoccupied molecular orbital (ELUMO) are very useful to elucidate the chemical reactivity of a molecule. According to the frontier molecular orbital theory of chemical reactivity, the transition of electrons is mainly related to the highest occupied molecular orbital (HOMO) and lowest unoccupied molecular orbital (LUMO) of the reacting species [55]. The HOMO is associated with the electron donation capability of the molecule. The higher the EHOMO value, the stronger the electron donating capability of the inhibitor will be and, therefore, the better the observed inhibition efficiency will be [56]. The LUMO implies the capability of the molecules to accept electrons from the metallic surface. The lower the value of ELUMO, the more it will be prone towards accepting electrons [57].
From Table 6, it can be concluded that the capability of donating electrons follows the order: BF4 > BF2. ELUMO signifies the propensity of molecules to accept electrons. The lower value of the ELUMO is, the stronger is the ability of molecules to accept electrons. It can be observed (via Table 6) that the capability of accepting electrons obeys the order: BF2 > BF4. This is not in accordance with the result (inhibition efficiencies) obtained from the experiments.
The energy gap (ΔE) is a very important stability parameter of the molecules related to the reactivity tendency of the molecules towards the metal surface. The lower ΔE is, the higher is the reactivity tendency of molecules in adsorption [58].
As for a molecule with lower energy gap, it means that the molecule is more polarizable and the molecule electrons are transported more smoothly. Thus, ΔE has been used to measure the binding ability of molecules as an important index. It can be seen (via Table 6) that the property of molecules obeys the order: BF4 > BF2. These results are in good agreement with the experiments. Global softness (σ) is also a predominant parameter to characterize the adsorption ability of molecules, and the higher the value is, the higher is the possibility of adsorption. In the research of corrosion inhibition chemistry, the inhibitors and the metals are considered as soft base and soft acid, respectively. It could be concluded (via Table 6) that the property of molecules obeys the order: BF4 > BF2. These results are in accordance to the former ones. The dipole moment (μ) of a molecule is also an important parameter to elucidate the chemical reactivity of a molecule. A literature survey reveals that the adsorption process is further facilitated with increased values of dipole moment as the latter influences the transport process through the adsorbed layer [59,60]. In this work it can be observed from Table 6 that the dipole moment values increase in the order of BF4 < BF2, which is not in accordance with the experimental results.
Active sites
Inhibitor molecules are in general adsorbed on the metallic surface by the donor acceptor (D-A) type interaction between the inhibitor molecule and the concerned metallic surface. Therefore, it is essential to examine which corresponding active sites are responsible for this. Generally the more negative is the charge on the heteroatoms, more it can participate on the D-A type interactions [61]. However, it is also important to consider the situation from where the inhibitor molecules are going to receive certain amount of charges at some centres and reverting back for donating considerable amount of charges through consecutive centres [62]. This can be easily achieved by evaluating Fukui indices for each individual atom. This shows local reactivity as well as nucleophilic and electrophilic nature of the molecule [63]. Nucleophilic and electrophilic attacks are mainly controlled by the maximum threshold values of fk+ and fk-. fk+ measures changes in electron density when the molecule accepts extra electrons, whereas fk- measures electron density changes when molecule loses electrons.
The calculated values of the Fukui functions for the non hydrogen atoms are reported in Table 7).
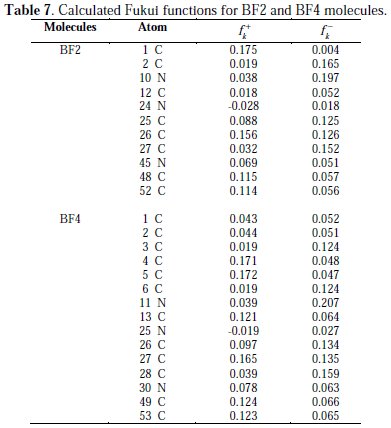
From the results obtained, it can be stated that the site for nucleophilic attack is where the value of fk+ is maximum. On the other hand, the site for electrophilic attack is controlled by the value of fk-.
It can be seen from Table 7 that in the BF2 molecule, the C(1), C(25), C(48) and C(53) atoms are the more susceptible sites for a nucleophilic attack (electron acceptance), as those atoms possess higher charge densities. On the other hand, the C(2), N(10), C(25), C(26) and C(27) atoms mainly participate in the electrophilic attack (the donation of electrons). Therefore, it can be concluded from these results that all the individual atoms will participate in the D-A type interactions on the iron surface. On the other hand, C(4), C(5), C(13), C(27), C(49) and C(53) atoms are the favorable sites for electron acceptance, while the C(3), C(6), C(26), C(27), C(28) and N(11) atoms will be responsible for electron donation for BF4. Based on the above discussion, it can be concluded that BF2 and BF4 have many active sites for adsorption on the mild steel surface. These results are also in good accordance with experimentally obtained inhibition efficiency.
Conclusion
From the overall experimental results and theoretical calculations the following conclusions can be deduced:
- The synthesized tetrakis pyrazole derivatives showed good inhibition efficiencies for the corrosion of mild steel in 1.0 M HCl solution, and the inhibition efficiency increased on increasing the concentration of inhibitor. The inhibiting performance of BF4 is better than that of BF2.
- Inhibition efficiency (ηWL) decreases with the temperature. The value of apparent activation energy (Ea) in the presence of inhibitors is higher than that in the absence of inhibitor.
- The adsorption of each tetrakis pyrazole inhibitor obeys Langmuir adsorption isotherm.
- Polarization studies showed that both tested inhibitors are mixed type in nature.
- Electrochemical impedance spectroscopy (EIS) measurements show that charge transfer resistance (Rct) increases and double-layer capacitance (Cdl) decreases in presence of inhibitors, suggesting the adsorption of the inhibitor molecules on the surface of mild steel.
- Quantum chemical calculations reveal that the electron donation and electron acceptance capabilities of the studied inhibitors follow the order BF4 > BF2, which is in good accordance with the results obtained from previously performed experiments.
- The active sites of the studied inhibitor molecules are also thoroughly investigated using Fukui indices. Fukui indices describe in detail which particular atoms mainly participate for the electron donation and acceptance processes between the inhibitors and the Fe surface.
References
1. Sastri VS. Corrosion Inhibitors - Principles and Applications. Chichester, England: Wiley; 1998. [ Links ]
2. Lagrenee M, Mernari B, Bouanis M, et al. Corros Sci. 2002;44:573. [ Links ]
3. Abdallah M. Corros Sci. 2003;45:2705. [ Links ]
4. Naik UJ, Panchal VA, Patel AS, et al. J Mater Environ Sci. 2012;3:935. [ Links ]
5. Al Hamzi AH, Zarrok H, Zarrouk A, et al. Int J Electrochem Sci. 2013;8:2586. [ Links ]
6. Zarrouk A, Hammouti B, Zarrok H, et al. Der Pharm Chem. 2011;3:263. [ Links ]
7. Ghazoui A, Bencaht N, Al-Deyab SS, et al. Int J Electrochem Sci. 2013;8:2272. [ Links ]
8. Zarrouk A, Zarrok H, Salghi R, et al. Int J Electrochem Sci. 2012;7:10215. [ Links ]
9. Zarrouk A, Hammouti B, Zarrok H, et al. Int J Electrochem Sci. 2012;6:89. [ Links ]
10. Ghazoui A, Saddik R, Benchat N, et al. Int J Electrochem Sci. 2012;7:7080. [ Links ]
11. Quraishi MA, Sardar R, Jamal D. Mater Chem Phys. 2001;71:309. [ Links ]
12. El Ouali I, Chetouani A, Hammouti B, et al. Port Electrochim Acta. 2013;31:53. [ Links ]
13. Eddy NO, Ameh PO, Gwarzo MY, et al. Port Electrochim Acta. 2013;31:79. [ Links ]
14. Joseph B, Prajila M, Joseph A. J Dispersion Sci Technol. 2012;33:739. [ Links ]
15. Kabanda MM, Murulana LC, Ozcan M, et al. Int J Electrochem Sci. 2012;7:5035. [ Links ]
16. Zertoubi M, Zerouali D, Hammouti B, et al. E-J Chem. 2010;7:S35. [ Links ]
17. Khaled KF, Abdel-Rehim SS, Sakr GB. Arab J Chem. 2012;5:213. [ Links ]
18. Ogukwe CE, Akalezi CO, Chidiebere MA, et al. Port Electrochim Acta. 2012;30:189. [ Links ]
19. Khaled KF, Abdel-Rehim SS. Arab J Chem. 2011;4:397. [ Links ]
20. Tebbji K, Aouniti A, Attayibat A, et al. Indian J Chem Technol. 2011;18:244. [ Links ]
21. Hammouti B, Dafali A, Touzani R, et al. J Saudi Chem Soc. 2012;16:413. [ Links ]
22. Zarrok H, Oudda H, El Midaoui A, et al.Res Chem Intermed. 2012;38:2051. [ Links ]
23. Tebbji K, Oudda H, Hammouti B, et al. Res Chem Intermed. 2011;37:985. [ Links ]
24. Bendaha H, Zarrouk A, Aouniti A, et al. Phys Chem News. 2012;64:95. [ Links ]
25. Zarrok H, Al Mamari K, Zarrouk A, et al. Int J Electrochem Sci. 2012;7:10338. [ Links ]
26. Zarrok H, Zarrouk A, Salghi R, et al. J Chem Pharm Res. 2012;4:5048. [ Links ]
27. Belayachi M, Serrar H, Zarrok H, et al. Int J Electrochem Sci. 2015;10:3010. [ Links ]
28. Tayebi H, Bourazmi H, Himmi B, et al. Der Pharm Lett. 2014;6:20. [ Links ]
29. Tayebi H, Bourazmi H, Himmi B, et al. Der Pharm Chem. 2014;6:220. [ Links ]
30. Zarrok H, Zarrouk A, Salghi R, et al. Der Pharm Lett. 2013;5:43. [ Links ]
31. ASTM Designation G1-03 ''Standard Practice for Preparing, Cleaning, and Evaluating Corrosion Test Specimens''; 2011. [ Links ]
32. Gaussian 03, Revision B.01, M. J. Frisch, et al., Gaussian, Inc., Pittsburgh, PA, 2003. [ Links ]
33. Hehre WJ, Radom L, Schleyer PVR, et al. AB INITIO Molecular Orbital Theory. New York: Wiley-Interscience; 1986. [ Links ]
34. Janak JF. Phys Rev B. 1978;18:7165. [ Links ]
35. Stowasser R, Hoffmann R. J Am Chem Soc. 1999;121:3414. [ Links ]
36. Pearson RG. Inorg Chem. 1988;27:734. [ Links ]
37. Parr RG, Yang W. J Am Chem Soc. 1984;106:4049. [ Links ]
38. Khaled KF. Electrochim Acta. 2010;55:6523. [ Links ]
39. Fouda AS, Elewady YA, Abd El-Aziz HK. J Chem Sci Technol. 2012;1:45. [ Links ]
40. Li X, Deng S, Fu H, et al. Corros Sci. 2009;51:620. [ Links ]
41. Amar H, Tounsi A, Makayssi A, et al. Corros Sci. 2007;49:2936. [ Links ]
42. Deyab MA, Abd El-Rehim SS, Keera ST. Colloids Surf A. 2009;348:170. [ Links ]
43. Haruyama S, Tsuru T, Gijutsu B. J Jpn Soc Corros Eng. 1978;27:573. [ Links ]
44. Elkadi L, Mernari B, Traisnel M, et al. Corros Sci. 2000;42:703. [ Links ]
45. Saliyan VR, Adhikari AV. Corros Sci. 2008;50:55. [ Links ]
46. Atta AM, El-Azabawy OE, Ismail HS, et al. Corros Sci. 2011;53:1680. [ Links ]
47. Bockris JO'M, Reddy AKN. Modern Electrochemistry. New York: Plenum Press; 1977. P.1267. [ Links ]
48. Bentiss F, Lebrini M, Lagrenee M. Corros Sci. 2005;47:2915. [ Links ]
49. Dehri I, Ozcan M. Mater Chem Phys. 2006;98:316. [ Links ]
50. Gomma GK, Wahdan MH. Mater Chem Phys. 1995;39:209. [ Links ]
51. Guan NM, Xueming L, Fei L. Mater Chem Phys. 2004;86:59. [ Links ]
52. Li X, Deng S, Fu H, et al. Corros. Sci. 2008;50:2635. [ Links ]
53. Abdallach M. Corros Sci. 2002;44:717. [ Links ]
54. Noor EA. Int J Electrochem Sci. 2007;2:996. [ Links ]
55. Ozkır D, Kayakırılmaz K, Bayol E, et al. Corros Sci. 2012;56:143.
56. Obi-Egbedi NO, Obot IB. Corros Sci. 2011;53:263. [ Links ]
57. Khaled KF. Appl Surf Sci. 2008;255:1811. [ Links ]
58. El Adnani Z, McHarfi M, Sfaira M, et al. Corros Sci. 2013;68:223. [ Links ]
59. Sahin M, Gece G, Karci F, et al. J Appl Electrochem. 2008;38:809. [ Links ]
60. Quraishi MA, Sardar R. J Appl Electrochem. 2003;33:1163. [ Links ]
61. Gece G, Bilgic S, Ind Eng Chem Res. 2012;51:14115. [ Links ]
62. Breket G, Hur E, Ogretir C. J Mol Struct (Theochem). 2002;578:79. [ Links ]
63. Shokry H. J Mol Struc. 2014;1060:80. [ Links ]
64. Hegazy MA, Badawi AM, Abd El Rehim SS, et al. Corros Sci. 2013;69:110. [ Links ]
*Corresponding author. E-mail address: azarrouk@gmail.com
Received June 30, 2016; accepted December 27, 2016

