


Serviços Personalizados
Journal
Artigo
 Inglês (pdf)
 Artigo em XML
 Referências do artigo
 Enviar este artigo por email
Indicadores
-
 Citado por SciELO
 -
 Acessos
Links relacionados
-
 Similares em
SciELO
Similares em
SciELO
Compartilhar

 Permalink
Portugaliae Electrochimica Acta
versão impressa ISSN 0872-1904
Port. Electrochim. Acta vol.34 no.5 Coimbra set. 2016
https://doi.org/10.4152/pea.201605343
Cathodic Stripping Voltammetric Determination of Febuxostat in Pharmaceutical Dosage Form and Plasma Samples
I. H. I. Habiba,* , M. S. Rizkb , M. M. Abou El-Alaminb and G. S. Imamc
a Applied Organic Chemistry Department, National Research Center, Dokki, Cairo, Egypt
b Analytical Chemistry Department, Faculty of Pharmacy, Helwan University, Ein Helwan, 11795, Cairo, Egypt
c National Nutrition Institute, 16 Kasr Al Aini st., Cairo, Egypt
Abstract
Febuxostat FEB was determined by differential pulse ''DP'' adsorptive stripping voltammetry and hanging mercury drop electrode. In 0.04 mol L-1 Britton-Robinson buffer solution, pH 10, an irreversible electrochemical reaction took place at about -350 mV, and the peak current was linearly varied over the concentration range of 12.5-200 ng mL-1 FEB, with correlation coefficients of 0.9995, after 60 s accumulation time, stirring at a speed of 600 rpm, rest for 10 s, then cathodic stripping sweep from -100 to 600 mV, with a scan rate of 60 mV/s. The limits of detection and quantization were 6.93, 23.09 ng mL-1. The method was applicable for determining FEB in pharmaceutical tablets and in spiked plasma. The results of the proposed method were compared with that obtained by the UV-spectrophotometric technique.
Keywords: Febuxostat, differential pulse voltammetry, HMDE, pharmaceutical and plasma samples.
Introduction
Febuxostat (FEB), [2-[3-cyano4-(2-methylpropoxy) phenyl]-4-methylthiazole-5carboxylic acid] with the structural formula given in Fig. 1, is a xanthine oxidase inhibitor used as anti-gout drug [1].
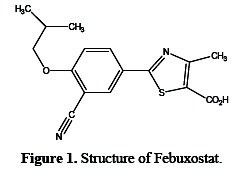
FEB is a non-hygroscopic, white crystalline powder that is soluble in dimethylformamide and dimethylsulfoxide; slightly soluble in acetonitrile and methanol; sparingly soluble in ethanol; and practically insoluble in water. Several FEB determination methods have been reported. These included UV spectrophotometric methods [2-8], RP-HPLC-UV[9-15], RP-HPLC-MS/MS [1618] and UPLC-tandem mass [19-21].
In our knowledge, no work was found in the literature for the voltammetric determination of FEB, which was characterized in a highly sensitive way, down to ng mL-1, as described below.
Experimental
Apparatus
A Metrohm voltammeter model 693 VA processor and 694 VA stand (Swiss), equipped with a Ag/AgCl reference electrode stored in a 3.0 M KCl solution, and a platinum counter electrode, as auxiliary electrode, were employed. The hanging mercury drop electrode HMDE with a drop size of 0.30 mm2 was used as working electrode.
A spectrophotometer JASCO V-570 model was used. A Metrohm pH-meter model 691 with a combined electrode (glass-Ag/AgCl electrode) was used for pH measurements (Swiss).
Materials and reagents
All chemicals used were of analytical grade. Febuxostat, B.N EL-03/L017/15004 (98.3 %) was dedicated by Eva Pharma, Egypt. Donifoxate tablets (Eva Pharma, Egypt) were purchased from the local market in two dosage strengths, 40 and 80 mg per tablet.
Universal Britton-Robinson buffer solutions of 0.04 mol L-1 boric acid; 0.04 mol L-1 orthophosphoric acid, and 0.04 mol L-1 acetic acid with pH values 7.0-12.0 were prepared by adjusting with suitable aliquots of 0.05 M sodium hydroxide. Double distilled water was used throughout all experiments.
Standard solutions
A stock solution of standard FEB was first prepared by dissolving 25 mg FEB in 5 mL of 0.05 mol L-1 sodium hydroxide solution, then completed to 100 mL with distilled water and stored in a dark and cold place. Further dilution was achieved by transferring 1 mL of the stock solution to a 50 mL measuring flask, and completing to the mark with a 2.5 mol L-1 NaOH solution.
Procedure
Aliquots of a FEB solution corresponding to a concentration range of 125 -2000 ng were sequentially added to a 10 mL BR buffer solution, pH 10, and de-aerated by purging nitrogen gas for 3 min, then pre-concentrated for 60 s at -100 mV, with stirring at 600 rpm. After resting for 10s, differential pulse DP or square wave pulse SQW was scanned from -100 to -600 mV with a scan rate of 60 mV s-1, pulse amplitude of 50 mV, pulse duration of 40 ms, measurement time of 20 ms, and frequency of 30 Hz. The experiment was triplicate, and the average of corresponding peak current was taken. The concentration and current were plotted to calculate slope, intercept and correlation coefficient.
Validation of the analytical procedure
For the validation of studied methods, the regression parameters, precision, and accuracy were checked by essaying samples with different concentrations of FEB on the same day and different days (between days), over a period of three days, using slope and intercept, as mentioned before.
Tablet essay procedure
Contents of five coated-tablets were weighted, and then thoroughly grounded to a fine powder. A sufficient amount of the powder equivalent to one tablet was accurately weighted, dissolved in 5 mL of a 0.05 mol L-1 NaOH solution, with a magnetic stirrer for 15 minutes, and then diluted with a sufficient amount of double distilled water, to obtain a final concentration of 400 μg mL-1 FEB. Further dilution was achieved by transferring 1 mL of the previous solution to a 50 mL measuring flask, and completing to the mark with a 2.5 mol L-1 NaOH solution. The aliquot of 50 μL of the final solution was transferred to a voltammetric vessel containing a 10 mL BR buffer solution, pH 10, to give a final concentration of 40 ng mL-1. The experiment was repeated as described in the above voltammetric procedure.
Analysis of human plasma samples
A procedure to extract FEB from spiked human plasma was achieved as described by Monita et al. [14], which can be detailed as it follows: Drug-free plasma samples were obtained from healthy people, and stored frozen in the dark until the essay. 1 mL of the plasma sample spiked with 2.5 μg mL-1 methanolic solution of FEB was placed in a glass tube of 15 mL capacity, and 5 mL diethylether was added. The contents of the tube were mixed by a vortex mixer for 2 min, shaken by a shaker at 100 strokes per min for 45 min, and then centrifuged for 15 min at 3000 rpm at 4 °C, to precipitate plasma protein residues. The organic layer was pipetted out into a 25 mL beaker, evaporated to dryness in air at room temperature, and re-dissolved in 5 mL 2.5 mol L-1 NaOH. The solution was then filtered through a PTFE 0.45 μm filter. 1 mL of the filtrate was transferred into a 10 mL measuring flask, and completed to the mark with a BR buffer solution, pH 10. The voltammetric measurement was repeated as described above.
Results and discussion
Different chemical and electrochemical parameters were thoroughly investigated to study the voltammetric behavior of FEB.
Effect of pH
The effect of pH on peak potential and current was studied in Britton-Robinson ''BR'' buffer solutions in the range of pH 8-11. In the cathodic direction from 100 to -600 mV, the peak was shifted towards more-negative potential values by increasing the pH up to 11, and the corresponding peak current was also increased, but reached a maximum value on using a BR solution of pH 10, as shown in Fig. 2.
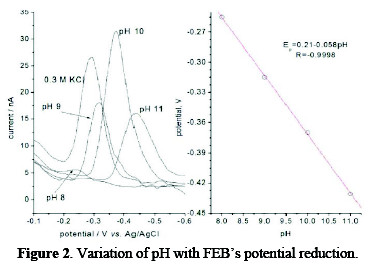
The cathodic peak was also shown on using 0.3 mol L-1 KCl, but it gave less peak symmetry with a lower peak height, and so, a BR buffer solution of pH 10 was selected in the next studies. No peaks were observed in the anodic direction in the same electrolyte media, suggesting that the electrochemical process is irreversible. To evaluate the number of protons relative to the number of electrons, the following equation is applied:
where, E° is the standard peak potential in Volts, is the number of protons, n is the number of electrons transferred in the mechanism, R is the ideal gas constant (8.314 J K-1 mol-1), T is the absolute temperature (298 K), F is Faraday's constant (96485 coulomb mol-1), [Ox] and [Red] are the equilibrium concentrations of reduced and oxidized species, respectively. The plot of the peak potential Ep versus pH showed one straight line between 8.0 and 11.0, with slope equal to 0.058, which is close to the Nernst theoretical value of 0.059 V pH [22]; the ratio of protons to electrons that participated in the mechanism was calculated as 0.986, indicating a participation of an equal number of protons and electrons in the FEB reduction [23].
Effect of scan rate
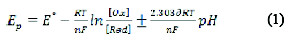
The irreversibility of FEB's electrochemical reaction was also confirmed by variations of scan rate with potential, as given in Fig. 3, where the peak potential was shifted to a more negative potential, after increasing the scan rate.
For this kind of irreversible mechanism, electron transfer coefficient α, and heterogeneous catalytic reaction rate constant Ks were determined using Laviron's equation [24, 25] as it follows:
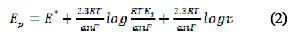
where Ep is the peak potential in volts and v is the scan rate (Vs-1). Ks and αn values can be concluded from the slope and intercept of the linear plot of Ep with respect to log v (Fig. 3, right).
The E° value can be deduced from the intercept of Ep versus v on the ordinate by extrapolating the line to v=0 (Fig. 3, left). Knowing E°, which equals to -348 mV, and from the graphical representations of Ep versus log v for FEB, the values of αn = 1.446 and ks = 2.05×10⁻¹⁸ s-1 were obtained from the slope and intercept, respectively.
Since for a totally irreversible electron transfer, α is the range from 0.30 to 0.70, the number of electrons transfer n for the reduction step is most probably 4, which indicated that four electrons were involved in FEB's reduction on HMDE. Thus, at the electrode interface, 4 protons and 4 electrons were probably consumed to convert nitrile -Câ¡N into amino group -CH2-NH2, resembling to that proposed by [26].
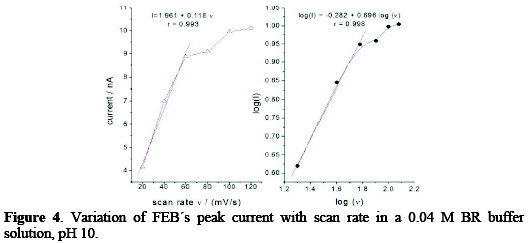
The variation of the logarithm of the peak current versus the logarithm of the scan rate in the range of 20-120 mV s-1 showed that the process has effected adsorption for HMDE electrode, the relation was linear over the range 20-60 mV s-1, and its slope was equal to 0.7, which is close to the theoretical value of 1.0 for some adsorption controlled effects [27] (Fig. 4).
Effect of accumulation time
The effect of accumulation time on the adsorptive cathodic stripping peak currents was studied on the concentrations of 25.5, 153, 204 ng mL-1. As shown in Fig. 5, the current was linearly increased by increasing the accumulation time (ta), and began to deviate beyond 60 s, due to the formation of a multilayer of the cited drug on the surface of the mercury electrode.
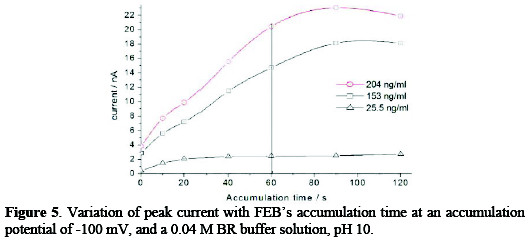
The accumulation time of 60 s was selected.
Stirring effect
The stirring effect on the adsorptive cathodic stripping peak currents was studied on concentration of 153 ng mL-1; it was found that the current was increased by increasing the stirring speed till 600 rpm, and then dropped down gradually with further speed up to 3000 rpm, as observed in Fig. 6.
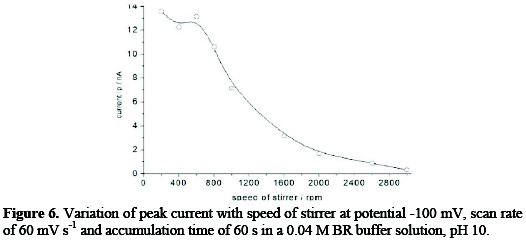
The stirring speed of 600 rpm was selected.
Effect of pulsation mode
Based on the above selected parameters of a 0.04 M BR buffer solution, pH 10, scan rate of 60 mV s-1, accumulation time of 60 s, stirring speed of 600 rpm, Figs. 7 and 8 demonstrated the effect of two types of pulsation to sweep, viz. square wave SQW and differential pulse DP.
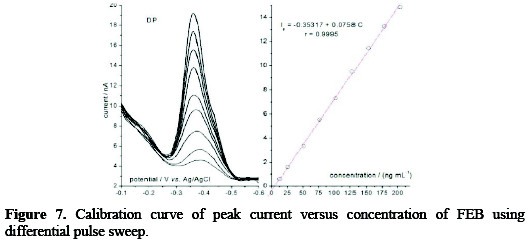
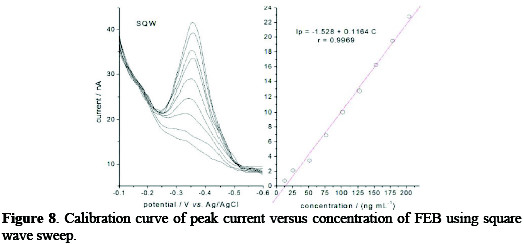
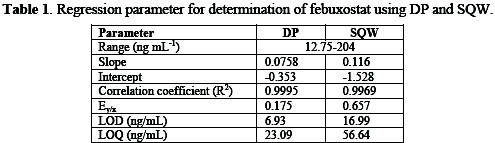
It is clear that the peak heights of DP current are lower than those of SQW, however, DP mode was selected because the cathodic peaks were practically more symmetric and reproducible than by SQW mode. The results showed good linearity over the concentration range from 12.5 to 204 ng mL-1, with more favorable regression parameters given by DP than those by SQW, as it is showed in Table 1.
Validation of the analytical procedure
For the validation of the studied method, the regression parameters, precision, and accuracy were checked, as given in Table 2, by essaying triplicate samples on the same day and different days (between days) over a period of three days, for different concentrations of FEB, and using DP mode.
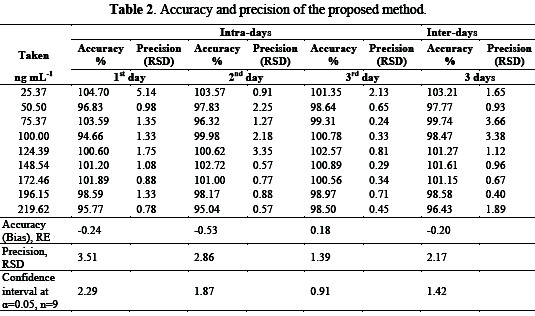
It is clear that there is no significance difference between intra and inter days in terms of accuracy and precision, and the 95% confidence interval revealed that the source of error is likely random on determining FEB.
Application to dosage form
The proposed method was applied for the determination of FEB in tablets of 40 and 80 mg FEB per tablet, and the results show 101.27-100.13% recovery, respectively (Table 3), which indicates that the method is selective for the essay of FEB without interference from the excipients used in these tablets.
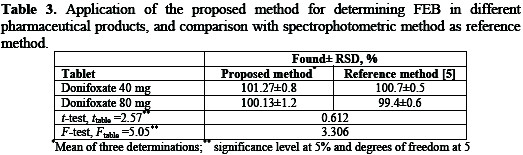
This is in agreement with that obtained by UV-spectrophotometric method [5] within the accuracy and precision limits.
Application to plasma form
The plasma protein binding of FEB is known to be approximately 99.2%, (primarily to albumin) [21], and in order to evaluate the applicability of the proposed method to extract and determine the bound FEB, the recovery was found to be in the range 70-73%, which is in accordance with that obtained by Monita et al. [14]. It is worth mentioning that FEB was not detectable on spiking the plasma with an aqueous solution of FEB in NaOH. This may be attributed to the formation of an ionic compound which was not extractable by diethylether. This could be solved by spiking with a methanolic solution of FEB.
Conclusions
The reduction of FEB is pH dependent, and it is an irreversible process in a 0.04 M Britton-Robinson buffer solution, involving 4 electrons transfer at HMDE interface, to convert nitrile into amine group. The differential pulse voltammetric method was applied to direct quantification of FEB in tablets and human plasma.
References
1. Sean CS. Martindale. 2nd edition. UK: Pharmaceutical Press; 2009. p 558. [ Links ]
2. Bagga P. IJPSR. 2011;2:2655. [ Links ]
3. Heth M, Joshi S, Patel M. IJPSR 2012;3:1621. [ Links ]
4. Lakade SH, Bhalekar MR. J Pharm Res. 2011;4:122. [ Links ]
5. Muvvala SS, Pavuluri MM, Ratnakaram VN. Oriental J Chem. 2013;235. [ Links ]
6. Rajyalakshmi C, Benjamin T, Babu CR. Res J Pharm Technol. 2013;6:208. [ Links ]
7. Raviteja N, Siva NS, Gayathri S, et al. IJCPS. 2013;1:337. [ Links ]
8. Sowjanya G, Srinivas L, Rajasri A. CIBTech J Pharma Sci. 2014;3:7. [ Links ]
9. Rao S, Reddy B, Nallagatla VB. J Sci Technol. 2013;228. [ Links ]
10. Mathrusri AM, Sai P, Kumar B, et al. J Chromatogr Sci. 2012;1. [ Links ]
11. Mukthinuthalapati MA, Bandaru SP, Bukkapatnam V, et al. J Chromatogr Sci. 2013;51:931. [ Links ]
12. Nageswara RK, Ganapathy S, Lakshmana RA. IJPSR. 2010;2:2231. [ Links ]
13. Sameer HL, Bhalekar M, Minal TH. IJCPS. 2012;4:1475. [ Links ]
14. Monita G, Pankaj S, Ravindra S, et al. Chromatogr Res Int. 2014;1. [ Links ]
15. Cong Z, Shao-Jie W, Rong-Li M, et al. J Shenyang Pharmac Univ. 2010;27:648. [ Links ]
16. Xie H, Wang Z, Deng K, et al. J Chromatogr B Analyt Technol Biomed Life Sci. 2014;970:24. [ Links ]
17. Shi Z, Liu J, Hu XJ, et al. Pharmazie. 2013;68:396. [ Links ]
18. Babu Rao C, Kanchanamala K, Nagiat TH, et al. Springer Plus. 2013;2:194. [ Links ]
19. Wu Y, Mao Z, Liu Y, et al. J Pharm Biomed Anal. 2015;114:216. [ Links ]
20. Zhang T, Sun Y, Zhang P, et al. Biomed Chromatogr. 2013;27:137. [ Links ]
21. Lukram O, Parmar S, Hande A. Drug Test Anal. 2013;5:492. [ Links ]
22. Bard AJ, Faulkner LR. Electrochemical methods, fundamentals and applications. New York: Wiley; 2001. [ Links ]
23. Tas-demir H, Cakirer O, Erk N. Collect Czech Chem Comm. 2011;76:159. [ Links ]
24. Laviron E. J Electroanal Chem. 1974;52:355. [ Links ]
25. Laviron E. J Electroanal Chem. 1979;101:19. [ Links ]
26. Lai-Hao W, Hsien-Ju T. J Chin Chem Soc. 2003;50:23. [ Links ]
27. Laviron E, Roullier L, Degrand C. J Electroanal Chem. 1980;112:11. [ Links ]
Acknowledgements
Thanks are due to Volkswagen Stiftung, Kastanienallee 35, 30519 Hannover, Germany, for the financial support of purchasing the Metrohm model 693 VA processor and 694 VA stand.
*Corresponding author. E-mail address: ihihabib@yahoo.com
Received August 03, 2016; accepted September 09, 2016

