


Serviços Personalizados
Journal
Artigo
 Inglês (pdf)
 Artigo em XML
 Referências do artigo
 Enviar este artigo por email
Indicadores
-
 Citado por SciELO
 -
 Acessos
Links relacionados
-
 Similares em
SciELO
Similares em
SciELO
Compartilhar

 Permalink
Portugaliae Electrochimica Acta
versão impressa ISSN 0872-1904
Port. Electrochim. Acta vol.34 no.5 Coimbra set. 2016
https://doi.org/10.4152/pea.201605309
Construction and Metrological Characterization of a Minimal Instrumentation Micropolarograph
J. E. Vilasoa,* , M. A. Aradaa , J. A. Baezb and A. Cespedesb
a Department of Chemistry. Faculty of Natural and Exact Sciences. University of Orient. 90600 Santiago de Cuba. Cuba
b Faculty of Chemical Sciences. National Autonomous University of Mexico. 04510 Mexico City. Mexico
Abstract
A minimal instrumentation micropolarograph was built, and its metrological characterization was performed. The oxidation of K4[Fe(CN)6] was studied by linear voltammetry. A microdisc and a bar of carbon were used as working and auxiliary electrodes, respectively. A bar divided into compartments of copper-internal solution- cotton was used as reference. The linear coefficient of determination between the limiting current and the concentration was 0.9926, in the range of 10-2 - 10-1 mol L-1 . The coefficient of variation of ten voltammograms at 0.08 mol L-1 was 1.8 %, being inferior to the maximum value reported for these methods. Mood and Kruskal-Wallis tests did not show significant differences between voltammograms. In the range of linear correlation coefficients of potential sweep 0.9488 to 0.9989, no sweep influence on voltammograms was observed. The expanded uncertainty associated with the determination of the limiting current was 1.9 μA. The linear voltammograms for oxidation of ascorbic acid and KI were obtained, showing correspondence with the reported results.
Keywords: Minimal Instrumentation Micropolarograph, linear voltammetry, metrology.
Introduction
Voltammetry is an electrochemical method of analysis, in which the current flowing through an electrolytic cell is measured when the analyte is oxidized or reduced at the working electrode, in polarization conditions, to a variable potential over time. The method at present is developed with a three-electrode system (working, reference and auxiliary). In practice, the current is predominantly measured by analyte diffusion, because of the change in concentration near the electrode, due to the electrochemical reaction. The mass transport by convection has cancelled working on solutions not mechanically shaken. The migration is controlled by the presence of a concentrated inner salt (electrolyte support or background) whose ions, due to their mobility, essentially assume the mass transport by migration. The charging current of the electrodes (capacitive current) and the faradaic current affect the detection limits, because of electroactive impurities. The sum of both currents is the residual current [1, 2]. The pattern of response in voltammetry is the voltammogram or current-potential curve. There are several voltammetric techniques, depending on how the potential varies in time. Voltammetry is linear when the potential is linearly imposed in time. The methods of triangular wave, differential pulse and square wave are other techniques; all of these are more modern than linear voltammetry [1]. The form of the voltammogram depends on the type of voltammetry. In linear voltammetry the curve has a sigmoid form, showing as diffusion current increases to a constant and independent value of the potential; this is the limiting current (ilim). Then, the transport speed of the analyte is only limited by its maximum diffusion to the electrode surface, where the analyte concentration approaches zero [1]. Cottrell equation (equation 1) shows the quantitative dependence of the limiting current with several magnitudes, including the analyte concentration, providing the method of quantitative analytical applications.
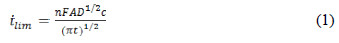
where n is the number of moles of electrons per mol of analyte, F is the constant of Faraday, A is the electrode surface area, D is the diffusion coefficient, c is the concentration, and t is the sampling time or time of measurement of the current. Although the already mentioned latest techniques have displaced the linear sweep voltammetry, still they show several potentialities. A large number of inorganic and organic substances can be quantified using this technique, if the experimental conditions are guaranteed, being possible to lower detection limits by preconcentration [1, 3]. The simultaneous quantification and the possibility of further speciation are some of the potentialities of the linear sweep voltammetric method. The determination of the number of electrons involved in an electrochemical reaction, the diffusion coefficient, the stability constants of coordination compounds, and the calculation of thermodynamic magnitudes are also possible [1, 3, 4]. It also allows, from the analysis of the voltammograms, establishing working conditions for the development of other electrochemical analysis methods, such as potentiometry, amperometry, and others. The voltammetric sensors still make useful the technique of linear sweep, most of all with quantitative purposes [1, 3, 5].
The equipment used for the development of the voltammetry is the potentiostat. It allows imposing a program of potential over time, and monitoring the current, throwing the voltammogram. Although its price is lower than other equipment for instrumental analysis, such as spectrophotometers, even the potentiostats are inaccessible to many laboratories. Other authors have reported research results using non-commercial equipment for the development of voltammetry methods [4, 6, 7].
Total Microscale Chemistry is based on the use of equipment and measuring instruments made of materials of easy local procurement, including plastics, metal bars, wires, inexpensive electronic components, etc. Microscale methods allow to spend less solvent and water, generating smaller amounts of waste, having lower operating costs, requiring less storage space, their equipment reparation is inexpensive, and allowing fieldwork [8-11]. In this paper, a minimal instrumentation micropolarograph was built, and its metrological characterization was performed from the oxidation of potassium hexacyanoferrate (II). Voltammograms for oxidation of potassium iodide and ascorbic acid were additionally obtained.
Experimental
Construction of the Minimal Instrumentation Micropolarograph
The minimal instrumentation micropolarograph (MIMP) was built according to a simple circuit showed in Fig. 1.
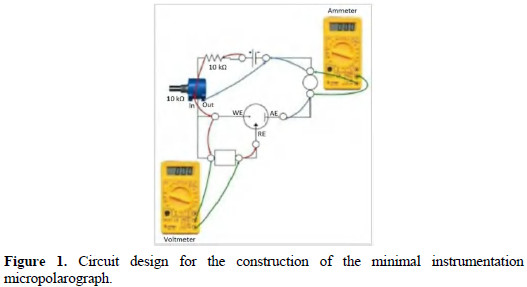
It causes a potential fall through the working electrode and the auxiliary electrode, permitting to measure the electrolysis current. The circuit was assembled in a plastic box as support. Multimeters Steren were used for measurements of the potential and of the current. In order to check the electric circuit according to Ohm's law, a fictitious cell was built employing two resistances, simulating a system of three electrodes.
A plastic bucket of 12 mL was used as electrolytic cell. Working and auxiliary carbon electrodes were used. A copper wire immersed in an aqueous solution of Cu (II), and separated from the solution using a permeable cotton (Cu|Cu2+||) [12], was used as reference electrode.
Redox systems studied
Cathodic potential sweep from 0 to -1500 mV, and anodic sweep from 0 to 1800 mV were performed to obtain the electroactivity window. The oxidation of K4[Fe(CN)6] was studied using the same anodic sweep. The analyte solutions were prepared in the supporting 1 mol L-1 KNO3 electrolyte. Voltammograms for oxidation of analyte solutions at 0.02, 0.04, 0.06, 0.08 and 0.1 mol L-1 were obtained to study the linear relationship between the limiting current and the concentration. Linear correlation and determination coefficients were determined.
The voltammograms for oxidation of potassium iodide and ascorbic acid were obtained. In the first case, 1 mol L-1 KNO3 was used as supporting electrolyte; in the second case, the supporting electrolyte was a buffer pH 4 of 1 mol L-1 sodium acetate/acetic acid. The same anodic sweep was used. The sampling time (τ) in all the experiments was 20 s.
The limiting current was determined as the average of the diffusion plateau. The half-wave potential (E1/2) was mathematically determined, fitting a straight line to the linear region of the sigmoid curve, substituting the value of the half of the limiting current in the equation obtained from the simple linear regression and computing the half-wave potential with a path ordered to the origin.
Statistical processing of results and metrological analysis Ten voltammograms for oxidation of 0.08 mol L-1 K4[Fe(CN)6] were obtained. The coefficient of variation was calculated. A comparison of the curves was made using Kruskal-Wallis and Mood tests [13, 14].
The uncertainty of measurement of the limiting current to 0.08 mol L-1 was estimated following the methodology established in accordance with the Guide to the Expression of Uncertainty in Measurement (GUM) [15]. Table 1 shows the calculations associated with each source of uncertainty.
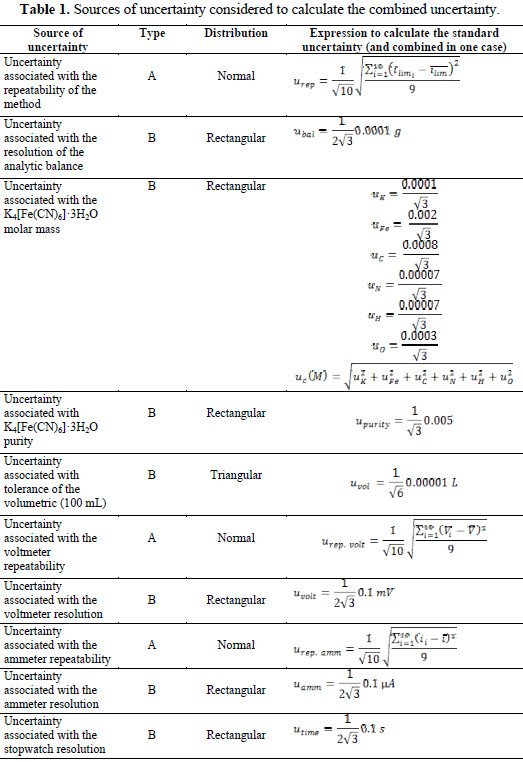
The uncertainties associated with the atomic weights of the elements were taken from the biannual publications of the IUPAC [16]. The repeatability of the multimeters was determined using a DCV Power Supply stabilized employing a voltage regulator 7812.
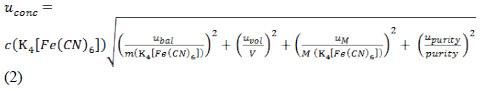
Equation 2 shows the expression used to calculate the standard combined uncertainty associated with the concentration of the K4[Fe(CN)6] solution.
The standard combined uncertainty associated with the limiting current was determined by equation 3.

The expanded uncertainty was calculated for a 95 % of confidence by equation 4.

Finally, the limiting current is reported as [ilim ± U].
Statgraphics Centurion, Origin 8.0 and Microsoft Office Excel 2010 were used for the statistical processing of the results.
Results and discussion
Construction of the MIMP
Fig. 2a shows the minimal instrumentation micropolarograph built.
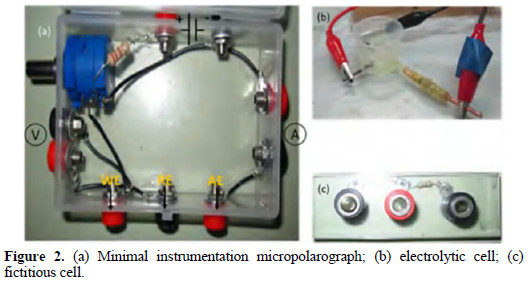
The variable resistance of the rheostat causes a potential fall; the potential relative to the reference electrode is measured through the parallel circuit. The current is measured between the working and the auxiliary electrodes. Fig. 2b shows the electrolytic cell with the working microelectrode and the auxiliary and reference electrodes. Fig. 2c shows the fictitious cell.
Fig. 3 shows the checking of the electric circuit according to the compliance of Ohm's law.
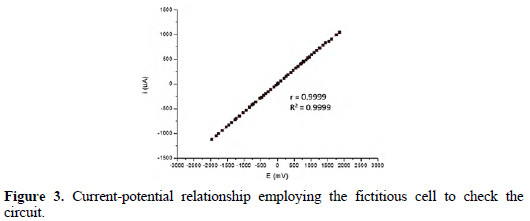
It is possible to see that the correlation and determination coefficients were 0.9999. This shows a linear relationship between the current and potential in simulated conditions of a three electrode system, showing the correct operation.
Study of the system [Fe(CN)6]4-/[Fe(CN)6]3-
Fig. 4 shows the voltammetric curves obtained for the oxidation of the analyte to each concentration of the study.
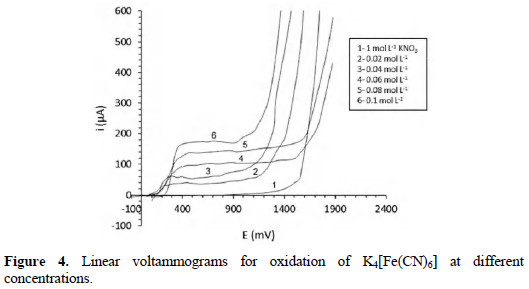
The reaction associated with curve 1 is the oxidation of the solvent, according to the following equation:

The other curves (2-6) have a sigmoid form, showing how the current increases with the potential to reach the limiting current; in that moment, the speed of the electrochemical process is limited by the maximum diffusion of the analyte to the electrode surface [1, 2]. The increase of the limiting current with the analyte concentration is observed in accordance with Cottrell equation. The first branch of oxidation in the curves corresponds to the following electrochemical process:

The next branch observed with the increase of potential is associated with the oxidation of water (equation 5).
Fig. 5 shows the quantitative linear relationship between the limiting current and concentration.
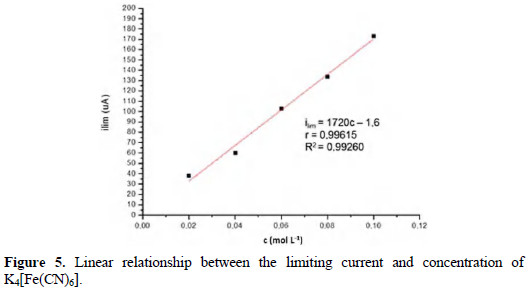
The linear regression coefficients and determination are shown. The first shows that there is a high correlation between the two variables, and the coefficient of determination shows that the mathematical model satisfactorily describes the linear relationship between the limiting current and concentration.
This linear relationship yields a quantitative value for the voltammetric results obtained using the MIMP.
Repeatability and uncertainty of measurement of the limiting current
Fig. 6 shows ten voltammograms under the same conditions for oxidation of 0.08 mol L-1 potassium hexacyanoferrate (II).
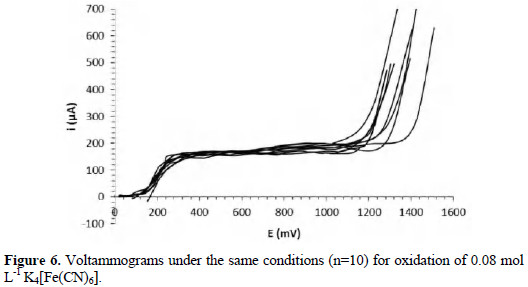
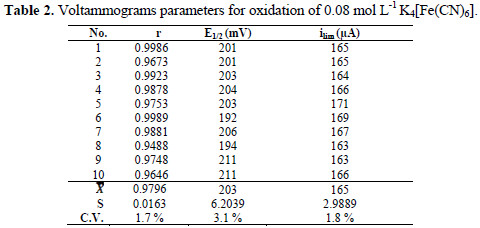
It is possible to observe two branches in all voltammograms, as it was described; the first corresponds to the oxidation of K4[Fe(CN)6], and the second corresponds to the oxidation of water. Correspondence in the diffusion plateaus is observed in a range of 60 μA. The half-wave potentials have a range of 20 mV. The variation between the curves can be associated with the non-commercial instrumentation employed and the working electrode. The homogeneity of the surface of a solid working electrode is important in the repeatability of the method [17]. In this work, non-commercial carbon electrodes were used. Table 2 shows the parameters obtained from the curves, and the coefficients of linear correlation for the relationship between the potential and time during the sweep.
The most important coefficient of variation refers to the limiting current, because this is the parameter utilized in the quantitative determinations. The differences between the voltammograms do not have a great influence in the values of the limiting currents, because these are calculated as the average of the points in the diffusion plateau.
The coefficient of variation associated with the half-wave potential is acceptable, while the coefficient associated with the limiting current shows a good repeatability of this parameter on the curves. The results are satisfactory, considering that the coefficients of variation associated with voltammetric methods have been reported up to 4% [1, 18]. The expanded uncertainty associated with the limiting current to 0.08 mol L-1 was 1.9 μA. The repeatability of the method is the most significant source of uncertainty, contributing with 99.7 % to the combined uncertainty. The limiting current is reported as [165.0 ± 1.9] μA, for a relative uncertainty of 1.1%.
Levene's test to verify the homogeneity of variance demonstrated that there are significant differences between the variances associated with the limiting current of the curves (p-value = 2.07×10⁻⁷; α = 0.05). This is because in some curves the plateau current remains substantially constant, while in others, it tends to increase.
Another fact that contributes to differences between variances is that the number of current samples (points on the plateau) in all curves is not the same. Kruskal- Wallis and Mood tests comparing the averages did not show statistically significant differences between the ten plateaus (p-value = 0.767772 and p-value = 0.765193, respectively; α = 0.05). These tests confirm that the limiting currents of the ten curves do not statistically differ, checking the repeatability of the voltammograms.
The linear correlation coefficient between potential and time is an important parameter, considering that the potential sweep was manually done using a rheostat, so it may present deviations from linearity. However, there is no influence of sweep linearity in limiting current in the range of correlation coefficients of 0.9488 to 0.9989, considering that there are not differences between the limiting currents.
Other electroactive systems
Fig. 7 shows the voltammogram for oxidation of 0.01 mol L-1 potassium iodide in 1 mol L-1 KNO3.
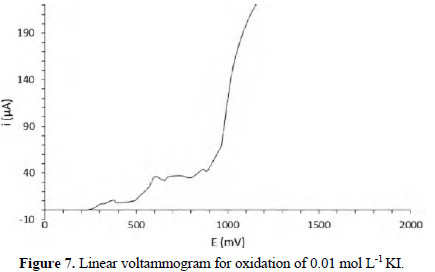
In this case, the half-wave potential was 557 mV, being in correspondence with Baeza and Garcia [19], reporting a value of 567 mV under similar experimental conditions. The associated electrochemical reaction is:

Fig. 8 shows the voltammogram for oxidation of ascorbic acid at pH 4 acetate buffer.
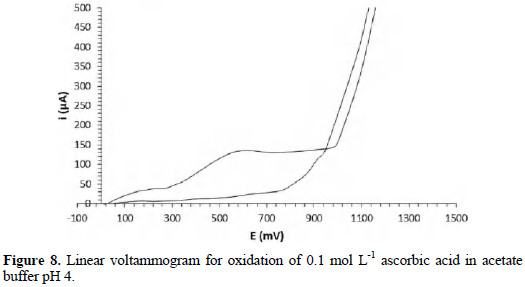
The curves for the electrochemical reaction of the analyte and the buffer are shown.
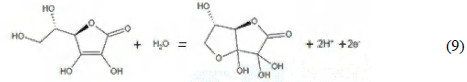
The branch observed in the voltammogram corresponds to the oxidation of ascorbic acid to dehydroascorbic acid, according to the following reaction [19]:
The half-wave potential was 460 mV, being in correspondence with the results shown by Baeza and Garcia [19], who reported a half-wave potential of 450 mV under similar conditions. There is also correspondence with the region where the limiting current appears; according to these authors, the diffusion plateau is observed between 500 and 1000 mV, similar to the range in the voltammogram of Fig. 7.
Conclusions
A minimal instrumentation micropolarograph was built, and a metrological characterization of the instrument was performed. Linear voltammograms for oxidation of potassium hexacyanoferrate (II) were obtained. The linear coefficient of determination between the limiting current and the concentration demonstrated the utility in quantification. The metrological characterization of the instrument showed a low uncertainty associated with the determination of the limiting current. The coefficient of variation of the limiting current was significantly lower than the maximum value reported for voltammetric methods. Repeatability of the voltammograms was observed. No influence of the sweep linearity over the voltammograms was observed in the range of correlation coefficients from 0.9488 to 0.9989. Voltammograms for oxidation of potassium iodide and ascorbic acid were in correspondence with the reported results under similar experimental conditions.
References
1. Skoog DA, Holler FJ, Nieman TA. Principles of instrumental analysis. 5th ed. Philadelphia: Sanders College Publishing; 1992. [ Links ]
2. Wang J. Analytical electrochemistry. New York: Wiley-VCH; 2000. [ Links ]
3. Lopez JM. In: Electrochemistry and Environment in the Doorstep of the XXI Century. Sastre ME, editor. A Coruna: Universidade; 1995. p. 25-51. [ Links ]
4. Khan F, Khanam A. Ecl Quim. 2008;33:29. [ Links ]
5. Svancara I, Walcarius A, Kalcher K, et al. Cent Eur J Chem. 2009;7:598. [ Links ]
6. Gomez DF, Rosales A, Gomez A. Rev Fisica. 2011;3:7. [ Links ]
7. Barrero JG, Amaya JA, Acevedo AR, et al. Rev Facultad Ing Fisico Mecanicas UIS. 2011;3:29. [ Links ]
8. de Santiago A. Miniaturization, design and characterization of electroanalytical and optic methodologies for chemical, pharmaceutical and biological areas. Grade Thesis. National Autonomous University of Mexico; 2002. [ Links ]
9. Garcia A, de Santiago A, Baeza A, et al. Microscale electroanalytical chemistry experimental teaching with locally produced low-cost instrumentation. 65th Annual Int Soc Electrochemistry. Laussane, Switzerland; 2014. [ Links ]
10. Garcia A, De Santiago A, Baeza A. Total microscale analytical chemistry. 8th International Symposium of Microscale Chemistry, Mexico City, Mexico; 2015. [ Links ]
11. Garcia A, De Santiago A, Baeza A et al. Low cost minimal instrumentation electroanalytical experimental approach. 66th Annual International Society of Electrochemistry. Taipei, Taiwan; 2015. [ Links ]
12. Vierna L, Garcia A, Baeza A. Modern Ed Rev. 2012;2:243. [ Links ]
13. Kruskal WH, Wallis W. J Amer Statist Assoc. 1952;260:563. [ Links ]
14. Lovric M. International encyclopedia of statistical science. New York: Springer; 2011. [ Links ]
15. BIPM, IEC, IFCC, ISO, IUPAP, IUPAC, OIMIL. Guide to the expression of uncertainty in measurement, 1995. [ Links ]
16. IUPAC. Uncertainty of the atomic weight of the elements, 2014. [ Links ]
17. Farghaly OA, Abdel-Hameed RS, Abu-Nawwas H. Int J Electrochem Sci. 2014;9:3287. [ Links ]
18. Alvarado G, Campos J. Port Electrochim Acta. 2005;23:209. [ Links ]
19. Garcia A, Baeza A. Analysis of the electrochemical behavior of two redox systems by chronoamperometry in pure diffusion regimen with a minimal instrumental micropolarograph; 2008. http://www.microelectrochemalexbaeza.com. [ Links ]
Acknowledgements
The authors are thankful to R. Cadrelo for his contribution with the electronic equipment for the determination of the multimeters repeatability.
*Corresponding author. E-mail address: javiere@uo.edu.cu
Received May 23, 2016; accepted October 7, 2016

