


Serviços Personalizados
Journal
Artigo
 Inglês (pdf)
 Artigo em XML
 Referências do artigo
 Enviar este artigo por email
Indicadores
-
 Citado por SciELO
 -
 Acessos
Links relacionados
-
 Similares em
SciELO
Similares em
SciELO
Compartilhar

 Permalink
Portugaliae Electrochimica Acta
versão impressa ISSN 0872-1904
Port. Electrochim. Acta vol.34 no.1 Coimbra jan. 2016
https://doi.org/10.4152/pea.201601039
The Effect of Capparis spinosa L. Extract as a Green Inhibitor on the Corrosion Rate of Copper in a Strong Alkaline Solution
Fadel Wediana,* , Mahmoud A. Al-Qudaha and Amad N. Abu-Bakerb
a Department of Chemistry, Faculty of Science, Yarmouk University, P.O. Box 560, Irbid, 22163-Jordan
b Department of Conservation and Management of Cultural Resources, Faculty of Archaeology and Anthropology, Yarmouk University, P.O. Box 560, Irbid, 22163-Jordan
Abstract
The corrosion inhibition efficiency of Capparis spinosa (CS) extract on the corrosion of copper in a 1.0 M NaOH solution was investigated using weight- loss, polarization and potentiodynamic corrosion rate measurements. The weight- loss showed that the inhibition efficiency of CS extract increased when increasing concentrations of CS extract and the immersion time. Maximum inhibition efficiency was 85%, which was obtained at 440 ppm of the CS extract at 45 °C in 1.0 M NaOH. Polarization measurements showed that the CS extract acts as a mixed type inhibitor. The cyclic voltammetry and potentiodynamics measurements suggested that the adsorbability of CS extract on copper was a bulk process, since surface coverage increased when increasing the concentration of CS extract. Thermodynamic measurements showed that the adsorption of CS extract on copper was physical, spontaneous, and favored at high temperatures. The adsorption of the inhibitor on a copper surface was in accordance with the Langmuir adsorption isotherm.
Keywords: Capparis spinosa; copper; corrosion inhibitor; alkaline inhibition; cyclic voltammetry.
Introduction
Corrosion is a chemical deterioration of the surfaces of metals or metal alloys in corrosive environments [1]. This deterioration is usually accelerated by electrochemical processes between metals or alloys, and oxidizing agents present in strongly acidic or alkaline solutions [1, 2]. Copper is a relatively noble metal, which is known to have attractive physical properties such as high electrical and thermal conductivities and mechanical workability [1, 3]. Because of that, copper has been heavily used in many aspects of our daily life. However, copper shows low corrosion resistance in its surrounding environments [1, 3]. Therefore, it has been important to look for various approaches to inhibit or slow down the corrosion rate of copper.
Many organic and inorganic compounds have been employed as corrosion inhibitors of copper in corrosive environments [3, 4]. Organic inhibitors were usually heterocyclic compounds containing S, O, and N [4, 5]. Such compounds are known to be adsorbed on the surface of copper, forming protective layers. These protective layers may modify the surface by blocking part or the whole of the active sites, or by changing the electronic properties of the surface. Therefore, they may reduce or inhibit the rate of electrochemical reactions on that surface [1, 4, 5, 6]. Nevertheless, those inhibitors are in their most expensive and toxic. Thus, green or eco-friendly compounds such as plant extracts have been investigated and used as green corrosion inhibitors.
Green inhibitors are biodegradable, nontoxic, and readily available substances [7]. Many plant extracts have been reported as green corrosion inhibitors on copper in various corrosive media such as Azadirachta [8], Cannabis [9], undulate [7], Zanthoxylum [10], Herba alba [7], Musa acuminata [7], Emblica [7], and Calligonum comosum [11]. Capparis spinosa (CS) extract is known to contain several organic compounds such as sterols, flavones, oxygenated heterocyclic constituents, alkaloids, and isothiocyanate glycosides [12]. Thus, it is expected that Capparis spinosa (CS) extract can be a useful corrosion inhibitor.
The purpose of the present work is to investigate the protection efficiency of Capparis spinosa on copper in a strong basic solution by cyclic voltammetry (CV), polarization techniques, and the weight-loss method, and to investigate the effect of temperature on the inhibition efficiency of CS extract on copper in the range of 298 to 318 K.
Experimental section
Plant material
The Capparis spinosa plant was collected from the Aqaba area (City of Aqaba, Jordan) during the flowering period (April-May 2014). The plant leaves were washed and dried in a dark place for 30 days. The dried plant was grinded into a fine powder before extraction. The plant was authenticated by the Department of Biological Sciences, Yarmouk University, Irbid, Jordan.
Preparation of plant extract
Ten grams of the plant powder were extracted using a Soxhlet extraction. The first step was conducted with 50.0 mL of petroleum ether for 12 hours, and then the residual plant material was extracted with 500.0 mL of methanol for 24 hours. Finally, the methanol was removed by a rotary evaporation, and the remaining solid was used as the inhibitor. The CS extract stock solution was prepared by dissolving 1.0 g of the solid in 1.0 L of a pure methanol solution (with a calculated concentration of 1000 ppm).
Electrode, materials, and instrumentation
A conventional three-electrode electrochemical cell was used. The solutions were purged with oxygen-free nitrogen for three minutes before conducting the electrochemical experiments. The working electrode was a piece of copper wire with a purity of >99.99% (supplied by Goodfellow USA) rounded at the end, which offered a mark for obtaining a reproducible surface area upon immersion, beneath the surface of the solution. The reference electrode was an Ag/AgCl/[Cl-]=1.0 M. The auxiliary electrode was made of 99.99% pure platinum (Johnson Matthey).
All reagents used were AR grade chemicals and were purchased from different suppliers. All solutions were prepared from reagents dissolved in triply distilled water. The nitrogen gas used was CP-grade, which was locally supplied. The cyclic voltammetry and polarization measurements were carried out using a Metrohm Autolab potentiostat/galvanostat model PGSTAT 101 connected to a Pentium IV personal computer. The data were analyzed using the Nova 1.6 electrochemical software. The temperature test was adjusted using a TAMSON model T100 thermostat.
Experimental procedure
Preparation of the copper electrode for electrochemical measurements
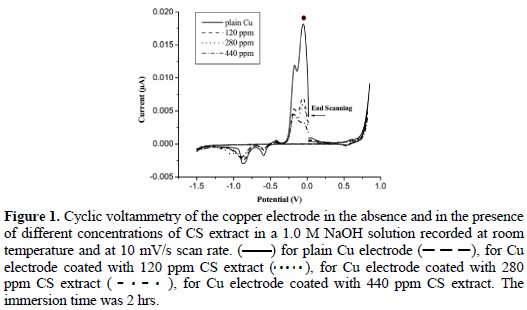
Before each experiment, the copper electrodes were chemically etched by immersion in 20% HNO3 for 5 seconds, rinsed with triply distilled water, inserted in the electrochemical cell containing 1.0 M NaOH.2 The surface was activated by repetitive cyclization of the electrode potential between -1.50 V and 0.745 V, until a reproducible stable voltammogram of copper electrode was produced (Figure 1: solid line) [2]. The CS extract was adsorbed at an open- circuit potential by immersing (dipping) a clean electrode in a solution containing 120, 280, or 440 ppm of CS extract for 2 hours at 25 °C.
Surface properties were characterized by cyclic voltammetry before and after adsorption of the CS extract. For a few selected samples, a FEI Inspect F50 (Netherlands) equipped with Field Emission Gun (FEG) scanning electron microscopic was used to record images before and after exposing the specimens to the corrosive solution without and with the corrosion inhibitor.
Corrosion tests
The effect of CS extract on the corrosion rate of copper was investigated by the weight-loss method, cyclic voltammetry, and electrochemical polarization techniques.
Weight-loss method for the determination of the corrosion rates
The experiment measurements were carried out in 1.0 M NaOH solutions by measuring the weight-loss of copper specimens in the absence (control samples) and the presence of the CS extract. Specimens were rectangular copper foils (dimensions: 3.0 cm × 1.0 cm × 0.50 mm). These experiments were performed at different concentrations of the CS extract: 120, 200, 280, 360, and 440 ppm. All weight-loss measurements were repeated for three times and the average of the results was used for comparison. The test period was set to 2 h under stirred conditions at 25 °C in the basic medium. Newly fresh solutions were used for each experiment.
Electrochemical measurements for the corrosion rate
The electrochemical corrosion measurements were carried out in a 1.0 M NaOH, since the cyclic voltammogram of copper has very distinct features [2]. The potentiodynamic anodic and cathodic polarizations were obtained by scanning the working electrode starting from Ecorr (the open-circuit potential) in the range of -250 to +250 mV relative to Ecorr [13]. The scan rate was set at a 1 mV/sec. The corrosion current (Icorr), and the cathodic and anodic Tafel slopes were obtained from the Tafel plot using the Nova 1.6 electrochemical software. The linear polarization measurements were obtained by scanning the potential in range of Ecorr ±20 mV [13].
Results and discussion
Adsorption of Capparis spinosa extract at the surface of copper
The cyclic voltammetry was used to analyze the adsorption process of CS extract at the surface of copper. Cyclic voltammetry is an excellent technique for surface characterizations. The peak potential, peak multiplicity, and the relative intensity of peaks can provide information about any change in the surface composition and reversibility of the electrochemical reactions that take place at the surface [14]. Fig. 1 shows the voltammogram of the copper electrode in a 1.0 M NaOH (solid line); the solid line voltammogram shows the well-recognized anodic and cathodic peaks of copper surface in alkaline solutions.
The effect of adsorption of different concentrations of the CS extract on copper was conducted using three concentrations: 120, 280, and 440 ppm (Fig. 1). Results reveal that the surface is mainly copper, and the areas under the peaks in presence of the inhibitor are less than those of the plain copper surface. Results suggest that the copper surface was covered by a submonolayer of CS extract [2, 15]. So, it is possible in this case to calculate the surface coverage before and after the adsorption of CS extract [2].
The coverage was calculated by monitoring the change in the area under the most prominent peak (labeled with •) before and after the adsorption of CS extract. The coverage (θ) was calculated using the following equation [2]:

where θa is the area with the extract and θb is the area without the extract. Table 1 shows the calculated θ at different concentrations of the extract at a 2 hr. immersion time.
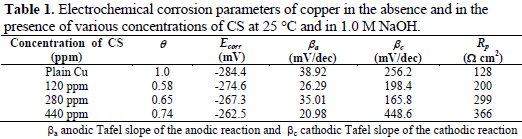
Table 1 reveals that the increase in the concentration of CS extract resulted in an increase in the surface coverage from 0.58 at 120 ppm to 0.74 at 440 ppm. Therefore, it was concluded that the adsorbability of CS extract on the surface of copper was a bulk process.
Electrochemical corrosion measurements
Polarization and potentiodynamic corrosion rate measurements of copper were carried out in the 1.0 M of NaOH solution, with different concentrations of the CS inhibitor (Fig. 2).
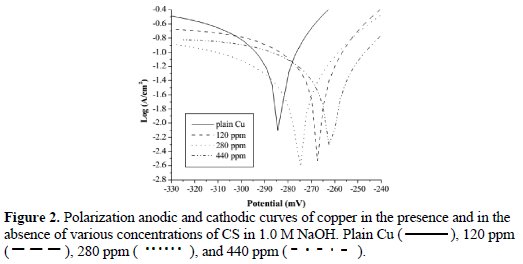
Table 1 and Table 2 summarize the results of electrochemical corrosion measurements.
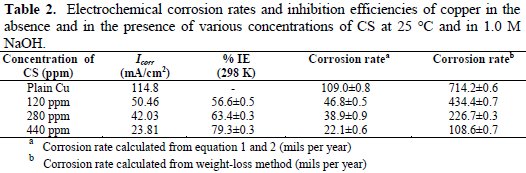
Moreover, Table 2 shows the calculated electrochemical corrosion rates along with the corrosion rates as calculated from the weight-loss experiments for comparison. The electrochemical corrosion rate was calculated based on the equation (1) and (2) [13,14].
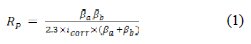
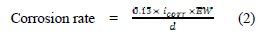
The equation (1) provides the polarization resistance (Rp) and the equation (2) provides the corrosion rate where βa and βb are Tafel slopes of the anodic and cathodic Tafel plots in mV/dec. Rp is the polarization resistance in Ω cm2, and icorr is the corrosion current density μA/cm2 where EW is the equivalent weight and d is the density of corroding species in g/cm3. Table 2 shows that increasing the concentration of CS extract from blank to 440 ppm decreases the Icorr from 114.8 (control) to 23.81 mA/cm2, resulting in 79.3% in IE. Moreover, the Ecorr values shifted to positive potentials when increasing CS extract. It can also be seen that the polarization resistance increases from 180 Ω cm2 for plain copper to 366 Ω cm2 for 440 ppm of the inhibitor. Moreover, electrochemical corrosion rates are in excellent agreement with weight-loss rates. Results in Table 2 indicate the ability of CS extract in the prevention of charge transfer in the test solution, thus retarding the corrosion reaction.
The weight-loss method
The effect of changing the immersion (dipping) time and the concentration of CS extract was evaluated using the weight-loss method. The corrosion rate was calculated for the test samples according to the equation [16]

where w is wt loss in grams, A is the area in cm2, d is the density of copper (g/cm3), and t is the immersion time in hrs. The calculated corrosion rates are given in Table 1.
Fig. 3A shows the effect of changing temperature in the range of 25 °C (298K) to 45 °C (318 K) on the weight loss of copper specimens in the test solution.
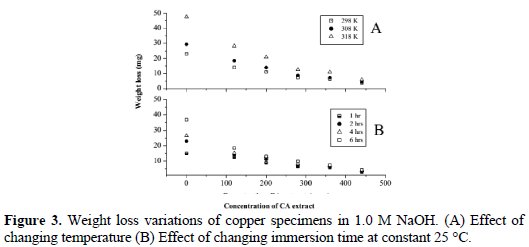
The weight-loss of plain copper specimens (control samples) was 23 mg at 25 °C, and increased to about 48 mg at 45 °C. In its turn, inhibited copper specimens showed a lower amount of weight-loss compared with the control samples. For example, at 25 °C, the weight loss of the sample inhibited with 120 ppm of the CS extract was 14 mg and the amount of weight loss decreased to about 3.5 mg at 440 ppm; similar trends of results were observed at the other temperatures. Fig. 3B shows the weight loss variation of copper samples as a result of changing the immersion times at a constant temperature of 25 °C. To explore the effect of the immersion time, the test was performed at four different immersion times: 1, 2, 4, and 6 h. The results at 2 h will be used as an example; weight losses were 14, 11.1, 7.3, 6.4, 3.5 mg, which were associated to 120, 200, 280, 360, and 440 ppm of inhibitor's concentration, respectively; similar trend of results were observed at other immersion times. It was concluded from Fig. 3 that the weight loss (corrosion rate) of copper decreased when increasing the immersion time and when increasing the concentration of CS extract. The anti-corrosion effect of CS extract on copper was evaluated by calculating the percentage corrosion inhibition efficiency. The percentage inhibition efficiency (IE) was calculated using the following equation [17]

where wo and wi are weight losses of copper in the absence and presence of the inhibitor.
Table 3 shows the percentage inhibition efficiency (IE) of CS extract at various concentrations in the test solution at different temperatures at a constant immersion time of 2 h.
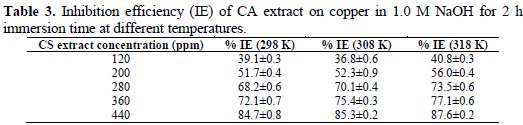
The results indicate that IE increased when increasing concentration of the CS extract at a certain temperature. At 319K, IE increased from 40.83% at 120 ppm to 87.62% at 440 ppm. On the other hand, IE level also increased as the temperature increased from 298 K to 318K, when the concentration of CS extract was kept constant. The maximum IE value was obtained at 318K for a 440 ppm of CS extract. For comparison, calculated IE values from electrochemical measurements (Table 2) are in good agreement with those from weight-loss measurements in Table 3.
The increase of IE levels with temperature can be explained by increasing the strength of adsorption of CS extract with the surface of copper [18, 19]. It was reported that CS extract contains aromatic organic compounds rich in heteroatoms (S, O and N) [12]. It is believed that these heteroatoms could act as a center for adsorption on the surface and enhance the ability of the organic compounds to attach strongly at higher temperature onto the active sites of the surface [19]. This enhances the ability of adsorbed CS extract to form a barrier between the copper surface and the corrosive medium and thus reduces the ability of surface for charge transfer with the oxidizing agents present in the corrosive medium, which as a result causes improvements in IE levels.
Adsorption Isotherm
Adsorption modes on the CS extract on the copper electrode were tested with the most common used adsorption isotherm systems such as Langmuir, El-Awady, Freundlich, and Temkin. These kinds of fitting could provide information about the nature of CS extract-copper interaction. The best results were obtained from Langmuir and Temkin isotherms. The Langmuir isotherm was selected to demonstrate the adsorption behavior of the CS extract on copper surface in 1.0 M KOH. The Langmuir adsorption isotherm is fitted by plotting the concentration of CS extract over the degree of surface coverage (C/φ) vs. the concentration of CS extract (C), according to the following equation [20]
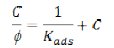
where Kads is the equilibrium constant of the process of adsorption. The best fit of the experimental data was considered acceptable when the correlation coefficient was R2 ≥ 0.99. The degree of surface coverage (φ) was calculated from the weight-loss data using the following formula
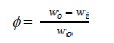
where wo and wi are the weight-losses of copper in the absence and in the presence of CS extract, respectively.
Fig. 4 shows the plot of (C/φ) and (C).
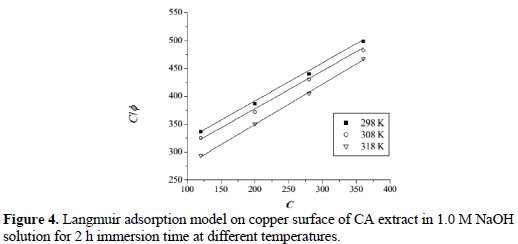
The plot shows a strong linear relationship with the correlation coefficient of ≃ 0.99. This result suggests that the adsorption of CS extract on copper surface obeyed Langmuir adsorption isotherm. Langmuir adsorption isotherm assumes that during the adsorption process there is no interaction among adsorbed molecules on the adjacent active sites. The equilibrium constant Kads of adsorption is related to the standard free energy of adsorption ΔG0ads, as expressed by the following equation [20]
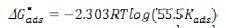
where R is the universal gas constant (8.413 J K-1 mol-1), T is temperature, and 55.5 is the concentration of water. The values of free energy of adsorption of CS extract were calculated at different temperatures and tabulated in Table 4.
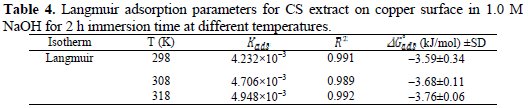
The results indicate that the ΔG0ads has an average value -3.68 kJ mol-1 for the CS extract in 1.0 M NaOH. The value and the negative sign imply that the adsorption of CS extract on copper surface is spontaneous with a physical adsorption mechanism. Moreover, increasing Kads values with an increasing temperature could indicate that the adsorption of CS extract on copper surface was more favorable at higher temperature.
Effect of Temperature
Temperature has a great effect on the corrosion process. The influence of temperature on the mechanism and kinetics of copper corrosion was evaluated in the absence and in the presence of CS extract using the weight loss experiment. To this aim, the corrosion rate of copper was examined at different temperatures. According to Arrhenius formula the corrosion rate can be related to temperature as it follows [21]
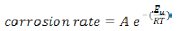
where A is the constant frequency factor, Ea is the activation energy, R is the universal gas constant, and T is temperature. Fig. 5 shows the plot of log (CR) versus the reciprocal of absolute temperature.
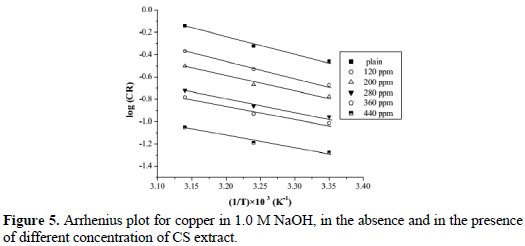
Values of the determined Ea are given in Table 5.
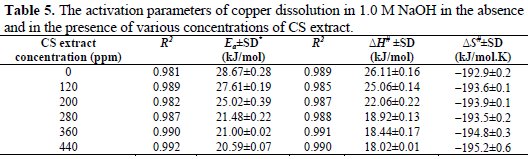
It is clear that activation energy decreased when increasing concentration of CS extract. The value of Ea is higher in an uninhibited solution (28.67 kJ/mol) compared to inhibited solutions, which indicates that the inhibition of copper corrosion in presence of CS extract occurred by both passivation and barrier protection mechanisms [19].
The enthalpy and entropy of activation for copper corrosion in the absence and in the presence of CS extract were calculated using the transition state equation [22]
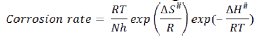
where the corrosion rate is calculated from the weight loss experiment, T is the absolute temperature, h is the Plank's constant, N is Avogadro's number, ΔS# is the entropy of activation, and ΔH# is the enthalpy of activation. Fig. 6 shows a plot between log (CR/T) and 1/T; results are shown in Table 5.
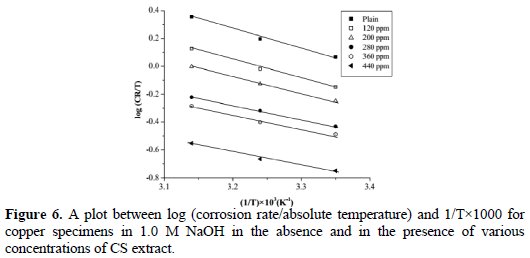
All linear regression coefficients are close to 1, which support the conclusion that the corrosion process of copper in 1.0 M NaOH solution follows the kinetic model. The calculated values of ΔS# in the absence and in the presence CS extract are negative, which suggest that the activated complex in the rate determining step is an association step rather than a dissociation step. In its turn, the positive sign of ΔH# reflects the endothermic nature of the corrosion process at the copper surface. The result from ΔS# and ΔH# suggests that a decrease in disorder takes place on going from reactants to the activated complex [11, 19, 22].
Scanning electron Microscope (SEM)
Typical SEM images of copper surfaces in the absence and in the presence of CS extract exposed to 1.0 M NaOH for 2 h are given in Fig. 7.
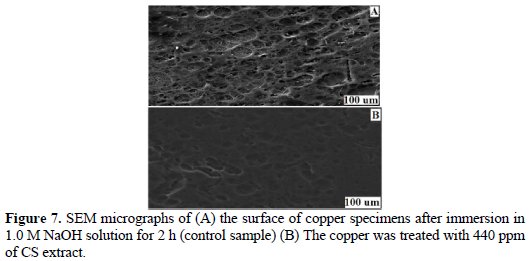
Fig. 7A shows the surface of plain copper. The surface shows a high degree of roughening, while Fig. 7B shows a relatively smooth surface morphology of treated copper surface with 440 ppm of the CS extract. These results suggest that CS extract had successively formed a film layer which was responsible for the corrosion inhibition of copper.
Conclusions
Results of this work indicate that Capparis spinosa extract can be used as a green inhibitor for copper in 1.0 M NaOH. Obtained results from electrochemical measurements showed that inhibition efficiency of copper increases when increasing CS extract concentration in 1.0 M NaOH. Values of inhibition efficiency from the electrochemical measurement agree with that from the weight loss method. The adsorption of CS extract on the copper surface in a basic medium obeys Langmuir isotherm. Values of ΔG# indicate that the adsorption of CS extract on copper surface is spontaneous and follows the physical adsorption mechanism. It is believed that this kind of adsorption retards the corrosion process by forming a barrier film on the attached surface, thus reducing the ability of the surface to exchange charges with the corrosive medium. Inhibition efficiencies of the CS extract suggest that CS extract could be used as a green alternative to the commercial toxic inhibitors which are commercially used in heating and cooling systems in home and industrial sectors.
References
1. Fontana M G. Corrosion engineering. 3rd ed. Singapore: McGraw-Hill; 1986. [ Links ]
2. Hourani M, Wedian F. Corros Sci. 2000;42:2131. [ Links ]
3. Jones D A. Principles and prevention of corrosion. New York: Macmillan; 1992. [ Links ]
4. Yuan Sh, Pehkonen S O, et al. Corros Sci. 2011;53:2738. [ Links ]
5. Emregul K C, Akay A A, et al. Mater Chem Phys. 2005;93:325. [ Links ]
6. Riacheva S. Electrochim Acta.1984;29:1067. [ Links ]
7. Mihajlovic M B, Antonijevic M M. Int J Electrochem Sci. 2015;10:1027. [ Links ]
8. Valek L, Martinez S. Mater Lett. 2007;61:148. [ Links ]
9. Abd-El-Nabey B A, Abdel-Gaber A M, et al. Int J Electrochem Sci. 2013;8:7124. [ Links ]
10. Chauhan J S. Asian J Chem. 2009;21:1975. [ Links ]
11. S-Nooshabadi M, Hoseiny F S, et al. Metall Mater Trans A. 2015;46:293. [ Links ]
12. Khanfer M A, Sabri S S, et al. Nat Prod Res. 2003;17:9. [ Links ]
13. Basics of Corrosion Measurements, Application Note CORR 1. EG&G Princeton Applied Research; 1980. [ Links ]
14. Conway B E, White B E, Bockris J O M. Modern aspects of electrochemistry. Vol. 16. New York: Plenum Press; 1980. [ Links ]
15. Behpour M, Mohammadi N. Corros Sci. 2012;65:331. [ Links ]
16. 1980 Annual Book of ASTM standards. Part 10, G1-G5. Philadelphia: ASTM; 1980. [ Links ]
17. Soltani N, Tavakkoli N, et al. Corros Sci. 2012;62:122. [ Links ]
18. Noor EA, Al-Moubaraki AH. Mater Chem Phys. 2008;110:145. [ Links ]
19. Bataineh T T, Al-Qudah M A, et al. Int J Electrochem Sci. 2014;9:3543. [ Links ]
20. Behpour M, Ghoreishi S M, et al. Mater Chem Phys. 2012;131:621. [ Links ]
21. Obot I B, Obi-Egbedi N O, et al. Corros Sci. 2009;51:1868. [ Links ]
22. Solmaz R G, Kardas G, et al. Electrochim Acta. 2008;53:5941. [ Links ]
Acknowledgements
The authors would like to thank the Yarmouk University -Faculty of Graduate Studies and Scientific Research for financial support.
*Corresponding author. E-mail address: alwedian@yu.edu.jo
Received 9 November 2015; accepted 23 February 2016

