


Serviços Personalizados
Journal
Artigo
 Inglês (pdf)
 Artigo em XML
 Referências do artigo
 Enviar este artigo por email
Indicadores
-
 Citado por SciELO
 -
 Acessos
Links relacionados
-
 Similares em
SciELO
Similares em
SciELO
Compartilhar

 Permalink
Portugaliae Electrochimica Acta
versão impressa ISSN 0872-1904
Port. Electrochim. Acta vol.34 no.1 Coimbra jan. 2016
https://doi.org/10.4152/pea.201601001
The Inhibition Effect of 1-Pentyl Pyridazinium Bromide towards Copper Corrosion in Phosphoric Acid Containing Chloride
A. Bousskria , R. Salghia,* , A. Anejjara , M. Messalib , S. Jodehc , O. Benalid , M. Larouje , I. Waradc , O. Hamedc and B. Hammoutif
a Laboratory of Environmental Engineering and Biotechnology, ENSA, Ibn Zohr University, P.O. Box 1136, 80000 Agadir, Morocco
b Chemistry Department, Faculty of Science, Taibah University, 30002, Al-Madinah Al-Mounawwara, Saudi Arabia
c Department of Chemistry, An-Najah National University, P.O. Box 7, Nablus, Palestine
d Departement de Biologie, Faculte des sciences et de la technologie, Universite Dr. Tahar, Moulay - Saida-Algerie
e Laboratory separation processes, Faculty of Science, Ibn Tofail University, P.O. Box 242, Kenitra, Morocco
f LCAE-URAC 18, Faculty of Science, University of Mohammed Premier, P.O. Box 717 60000, Oujda, Morocco
Abstract
The acid corrosion inhibition process of copper in 2 M H3PO4, containing 0.3 M of NaCl by an eco-friendly ionic liquid, 1-pentyl pyridazinium bromide (PPB), has been investigated using weight loss measurements, potentiodynamic polarization and electrochemical impedance spectroscopy (EIS).The effect of temperature on the corrosion behavior with the addition of PPB was studied in the temperature range 298- 328 K. The value of inhibition efficiency decreases slightly with the increase in temperature. Results show that PPB is a good inhibitor and inhibition efficiency reaches 91 % at 10-3 M. Gravimetric essays indicate that PPB inhibits the corrosion of copper and the value of inhibition efficiency reaches 90 % at 10-3 M of the inhibitor. Potentiodynamic polarization curves showed that the PPB affects both cathodic and anodic current and may be classified as a mixed type inhibitor in (2 M H3PO4 + 0.3 M NaCl). For the inhibitor, the inhibition efficiency increased with an increase in the concentration. The adsorption of this compound on copper surface obeys Langmuir's adsorption isotherm. To elaborate the mechanism of corrosion inhibition, the kinetic and thermodynamic parameters for copper corrosion and inhibitor adsorption, respectively, were determined and discussed. Inhibition efficiency values obtained from weight loss, polarization curves and EIS are reasonably in good agreement. Theoretical calculations provide good support to experimental results.
Keywords: Corrosion inhibition; Adsorption; Copper; 1-pentyl pyridazinium bromide; Phosphoric acid; Theoretical studies.
Introduction
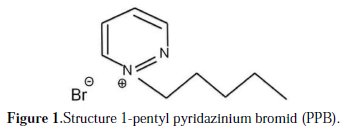
Copper is used widely in industry, because of its good thermal conductivity and mechanical properties. It reacts easily in ordinary environments containing oxygen. Thus, the study of its corrosion inhibition has attracted much attention. Copper corrosion depends not only on the nature of the environment, but also on the condition of use on materials. Most work on copper corrosion reveals that the presence of aggressive elements such as chloride and sulfide accelerates the corrosion of this metal [1-3]. Phosphoric acid is produced in large quantities in Morocco. It is widely used in industries, for example, in food industry, acid pickling, acid cleaning and acid desalting, Due to the general aggressiveness of acid solutions, inhibitors are commonly used to reduce the corrosive attack on metallic materials. The use of inhibitors is one of the most sensible methods for the protection of metals against corrosion, especially in a phosphoric acid environment [4, 5]. There are various organic inhibitors which tend to decrease the corrosion rate of steel and iron in acidic solutions [6-10]. Electronegative functional groups and Ï-electron in triple or conjugated double bonds, as well as a heteroatom like sulphur, phosphorus, nitrogen and oxygen in their structures, are the major adsorption centers. Recently, research has been focused on the use of eco-friendly products or green inhibitors, which are known to have inhibitive action [11-15]. In the last two decades, the organic compounds with low melting points, known as ionics liquids (ILs), were considered as an important topic of research in both industry and academia [16]. There is also a wide range of applications for these ionics liquids [17-21]. Inhibitors, which reduce corrosion on metallic materials, can be divided in to three kinds: (a) inorganic inhibitors; (b) organic inhibitors; and (c) mixed material inhibitors [22]. The inhibitory effect of pyridazinium-based ionic liquid [23], azoles [24-32], and some ionic liquids derivatives such as imidazolium is studied [33]. Ion liquids (ILs) showed very sound properties such as thermal stability, inflammability, moderate solubility for organic and inorganic compounds, high ionic conductivity and electrochemical potential properties [34-38]. It's reported that both imidazolium and pyridinium compounds represent good corrosion inhibitors for copper [3940], mild steel [41-44] and aluminum [45]. A strong relationship between the functional groups of the ionic liquids and the metal surface, due to the presence of the more electronegative nitrogen atom, has been discussed. In this work, the inhibition action of a pyridazinium-based ionic liquid (IL) compound, namely, 1pentyl pyridazinium bromid (PPB), on the corrosion of copper in 2M H3PO4 solution containing 0.3M NaCl will be studied. Electrochemical behavior experiments were done in phosphoric media, in the presence and absence of an inhibitor, using the weight loss method, potentiodynamic polarization and electrochemical impedance spectroscopic (EIS) studies. The effect of (IL) concentration on the corrosion inhibition efficiency will be examined. It is also the purpose of this work to test experimental data obtained from the three techniques with adsorption isotherms at different temperatures, in order to determine the thermodynamic functions for the adsorption process and gain more information about the mode of adsorption of the inhibitor on the surface of the copper. The chemical structures of the studied pyridazinium based ionic liquids are given in Fig. 1.
Materials and methods
Materials
The working electrode used in this work is a copper with a chemical composition (in wt%) of 0.01 % Ni, 0.019 % Al, 0.004 % Mn, 0.116 % Si and 99.5 % Cu Prolabo Chemicals. Prior to all measurements, the copper samples were pretreated by grinding with emery paper SiC (180, 600, 1200 and 2000), rinsed with distilled water, degreased in ethanol in an ultrasonic bath immersion for 5 min, washed again with double-distilled water and then dried at room temperature before use.
Synthesis and characterization of PPB under Ultrasonic irradiation
Pyridazine (1 eq.) and pentyl bromide (1 eq.) were placed in a closed container and exposed to irradiation for 5 hours at 70 °C, using a sonication bath. Completion of the reaction was marked by the precipitation of a solid from the initially obtained clear and homogenous mixture in toluene. The product was isolated by filtration and washed three times with Ethyl acetate to remove any non-reacted starting materials and solvent. Subsequently, the pyridazinium salt was washed with ethyl acetate. Finally, the IL was dried at a reduced pressure to remove all volatile organic compounds.
Brown crystals, yield 81 %, Mp 100-102 °C, 1H NMR (400MHz, CDCl3) δ: 0.87 (t, 3H), 1.13 (m, 4H), 2.03 (quint, 2H), 4.89 (t, 2H), 8.68 (dd, 1H), 8.83 (dd, 1H), 9.71 (dd, 1H), 10.20 (dd, 1H); 13C NMR (100MHz, CDCl3) δ: 154.5 (CH), 149.8 (CH), 136.5 (CH), 135.9 (CH), 64.3 (CH2), 53.2 (CH2), 29.0 (CH2), 27.4 (CH2), 21.5 (CH2), 13.6 (CH3). IR (nmax cm-1) 3132 (C-H, sp 2), 1599-1471 (C=C), 1165(C-N); LCMS (M-Br) 151 found for C9H15N2+.
Solutions
Phosphoric acid is among the one of the least corrosive acidic media compared with nitric, chloride or sulfuric acid. Corrosion behavior of copper in phosphoric acid containing sodium chloride at different concentrations was studied to illustrate the aggressiveness of chloride towards copper corrosion in this medium; as a matter of fact, a comparative study of the action of ions F-, Cl- and SO42- on copper behavior in phosphoric acid 2 M [46] was conducted. Tree experimental techniques have been used such as weight-loss, electrochemical polarization measurements and electrochemical impedance spectroscopy (EIS). And as results, it was found an increase of the corrosion rate when the content of chlorides increases in the ion concentration range studied of Cl- (10-3M to 3.101M). The phosphoric polluted environment by Cl- ions (0.3 M) is, therefore, the most aggressive environment vis-a-vis the corrosion of copper range in this environment. So, the effect of the inhibitor PPB on the corrosion inhibition of copper will be investigated in this electrolyte. It was also found as results in that in the phosphoric medium that the aggressiveness of the electrolytic solution increases when the temperature increases, which results in an increase in the copper corrosion rate [46]. The experiments were carried out in 2 M H3PO4 medium containing 0.3 M of NaCl. The solution tests were freshly prepared before each experiment; it was prepared by dilution of Analytical Grade 85 % H3PO4 with bidistilled water and pure NaCl. The organic compound tested was 1-pentyl pyridazinium bromide (PPB). The concentration range of this compound was 10-3 to 10-6 M.
Weight loss measurements
Gravimetric methods were conducted on copper and carried out at a definite time interval of 8 h at room temperature, using an analytical balance (precision ± 0.1 mg). All experiments were carried out under total immersion in 80 ml of test solutions. Copper specimens used a total surface of 12 cm2. Prior to each gravimetric or electrochemical experiment, the exposed area was mechanically abraded with 180, 320, 800, 1200 grades of emery papers, rinsed thoroughly with acetone and bidistilled water, before plunging the electrode in the solution. Pure copper samples (99.5%) were used. The experiments were carried out in 2 M H3PO4 medium containing 0.3M of NaCl, which was prepared by dilution of Analytical Grade 85 % H3PO4 with bidistilled water and pure NaCl.
Polarization measurements
Electrochemical impedance spectroscopy (EIS)
The electrochemical measurements were carried out using a Voltalab (Tacussel- Radiometer PGZ 100) potentiostat, and were controlled by Tacussel corrosion analysis software model (Voltamaster 4) under static condition. The corrosion cell used had three electrodes. The reference electrode was a saturated calomel electrode (SCE). A platinum electrode was used as auxiliary electrode. The working electrode was from copper. All potentials given in this study were referred to this reference electrode. The working electrode was immersed in a test solution for 30 minutes, to establish a steady state open circuit potential (Eocp). After measuring the Eocp, the electrochemical measurements were performed. All electrochemical tests have been performed in aerated solutions at 298 K. The EIS experiments were conducted in the frequency range with a high limit of 100 kHz and a different low limit of 0.1 Hz at open circuit potential, with 10 points per decade, at the rest potential, after 30 min of acid immersion, by applying 10 mV ac voltage peak-to-peak. Nyquist plots were made from these experiments. The best semicircle can be fit through the data points in the Nyquist plot, using a nonlinear least square fit, so as to give the intersections with the x-axis.
Potentiodynamic polarization
The electrochemical behaviour of the copper sample in inhibited and uninhibited solution was studied by recording anodic and cathodic potentiodynamic polarization curves. Measurements were performed in the 2 M H3PO4 medium containing 0.3 M of NaCl solution with different concentrations of the tested inhibitor, by changing the electrode potential automatically from -600 mV to 100 mV versus corrosion potential at a scan rate of 1 mV.s-1. The linear Tafel segments of anodic and cathodic curves were extrapolated to corrosion potential, to obtain corrosion current densities (Icorr).
Quantum chemical calculations
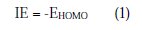
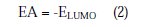
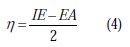
Complete geometrical optimizations of the investigated molecules were performed using DFT (density functional theory) with the Beck's three parameter exchange functional, along with the Lee-Yang-Parr nonlocal correlation functional (B3LYP) [47-49], with 6-31G* basis set implemented in Gaussian 03 program package [50]. This approach is shown to yield favourable geometries for a wide variety of systems. This basis set gives good geometry optimizations. The geometry structure was optimized under no constraints. The following quantum chemical parameters were calculated from the obtained optimized structure: The highest occupied molecular orbital (EHOMO) and the lowest unoccupied molecular orbital (ELUMO); the energy difference (ΔE) between EHOMO and ELUMO; dipole moment (μ); electron affinity (A); ionization potential (I); and the fraction of electrons transferred (ΔN). According to Koopman's theorem [51], the ionization potential (IE) and electron affinity (EA) of the inhibitors are calculated using the following equations:
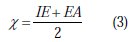
Thus, the values of the electronegativity (χ) and the chemical hardness (η), according to Pearson, operational and approximate definitions can be evaluated using the following relations [52]:
The number of transferred electrons (ΔN) was also calculated depending on the quantum chemical method [53, 54], by using the equation:
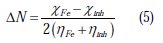
where χFe and χinh denote the absolute electronegativity of iron and the inhibitor molecule ηFe, and ηinh denotes the absolute hardness of iron and the inhibitor molecule, respectively. In this study, we use the theoretical value of χFe =7.0 eV and ηFe = 0, for calculating the number of electrons transferred.
Optical microscopy measurements
Immersion corrosion analysis of copper sample in the acidic solutions with and without the optimal concentration of the inhibitor was performed using optical microscopy (OM). Immediately after the corrosion tests, the samples were subjected to OM studies to examine the surface morphology. OM Est Scope was used for the experiments. The working sample was analyzed at three different locations to ensure reproducibility.
Results and Discussion
Potentiodynamic polarization curves
The effect of PPB on the corrosion reactions was determined by polarization techniques (Fig. 2).

The changes observed in the polarization curves after the addition of the inhibitor are usually used as criteria to classify inhibitors as cathodic, anodic or mixed type [55, 56]. Before starting the interpretation of the behavior of our inhibitor on copper in acidic medium containing chlorides we note that the polarization curves show the behavior of copper in the aggressive medium (2M H3PO4 + 0.3M NaCl), and we remark that all cathodic polarization curves are similar, since they have a wide large linear domain characteristic of a charge transfer mechanism. However, the anodic polarization curves were more influenced by the presence of chloride ions in phosphoric acid solution. In fact, the anodic reaction of copper in 2 M H3PO4 + 0.3 M NaCl solutions is the dissolution of Cu to Cu+ , which occurs through oxidation as follows [3, 4, 31,32]:
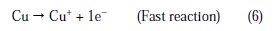
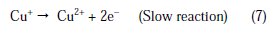
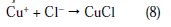
Cu+ reacts in a faster reaction than Cu2+ with chloride ion from the solution, to form a partially protective layer of CuCl on the copper electrode surface as follows [10,40,41]:
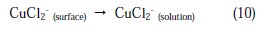
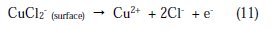
Once CuCl2 is formed at the surface of copper electrode, it will diffuse into the bulk solution or it will dissolve by oxidation causing the copper dissolution:
Here, three distinct regions can be identified for Cu in phosphoric acid medium containing chloride:
a Tafel region at lower over-potentials extending to the peak current density, due to the dissolution of copper into Cu+, Eq. (1); a region of decreasing currents until a minimum is reached, due to the formation of CuCl, Eq. (3); and a region of sudden increase in current density as a result of CuCl2 formation, Eq. (4), which is the responsible for the dissolution of Cu [38]. Fig. 2 shows the Tafel polarization curves for copper in 2 M H3PO4 medium containing 0.3 M of NaCl at different concentrations (10-3 to 10-6 M) of inhibitor at 298 K.
The potentiodynamic parameters (Table 1) such as corrosion potential (Ecorr), cathodic Tafel slopes (bc) and corrosion current density (Icorr) were obtained from Tafel plots, and the inhibition efficiency values EI (%), were calculated using Eq. (7):

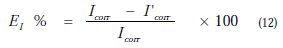
where Icorr and I'corr are uninhibited and inhibited corrosion current densities, respectively.
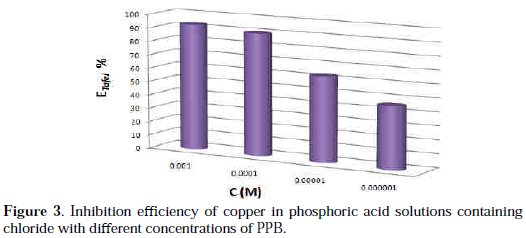
Under the experimental conditions performed, the cathodic branch represents the hydrogen evolution reaction, while the anodic branch represents the iron dissolution reaction. These branches are determined by extrapolation of Tafel lines to the respective corrosion potentials. Analysis of the polarization curves indicates that the inhibitor PPB studied leads both to decrease in the cathodic and anodic current densities and decrease in the corrosion rate. The anodic peak of the active zone decreased with an increase in the PPB concentration. This peak is followed by a passivity plateau. It is also evident that the efficiency of the inhibitor increased with an increase in the concentration of the inhibitor, as Fig. 3 shows.
There was no remarkable shift in the corrosion potential (Ecorr) value with respect to the blank. Indeed, according to literature report [57], when corrosion potential is more than ± 85 mV, with respect to the corrosion potential of the blank, the inhibitor can be considered distinctively as either cathodic or anodic type. However, the maximum displacement in this study is less than ± 85 mV. As it can be seen from Table 1, Ecorr values did not change significantly (the displacement was < 35 mV) in presence of the inhibitor, based on the marked decrease of the cathodic and anodic current densities, upon introducing the inhibitor in the aggressive solution. PPB can be considered as a mixed-type inhibitor, meaning that the addition of the inhibitor reduces the anodic dissolution and also retards the cathodic hydrogen evolution reaction. PPB blocks the reaction sites of copper electrode and it's shown from Fig. 2 that increasing the PPB concentration reduces both the cathodic and the anodic currents. In addition, the parallel cathodic Tafel curves in Fig. 2 show that the hydrogen evolution is activation controlled and the reduction mechanism is not affected by the presence of the inhibitor [58]. All the electrochemical parameters deduced from Fig. 2 are summarized in Table 1.
Inspecting the results we note that the corrosion current density decreases monotonically, when the content of PPB increases in solution. Icorr reaches a value of 10 μA/cm2 at a concentration of 10-3 M of the inhibitor. This value of Icorr led to an inhibition efficiency of about 93% and confirms that PPB is a good inhibitor against the corrosion of copper in 2 M H3PO4 medium containing 0.3 M NaCl. The values of the cathodic Tafel lines bc, show slight changes with the addition of PPB. This result suggests that the copper corrosion mechanism in the medium studied is not changed by the presence of the inhibitor [59].
Electrochemical Impedance Spectroscopy Measurements EIS
The corrosion behavior of copper in the aggressive medium (2 M H3PO4 + 0.3 M NaCl) solution in the presence of PPB was investigated by EIS at room temperature, after 30 min of immersion at Ecorr. Fig. 4 represents the influence of PPB concentrations on Nyquist impedance spectra.
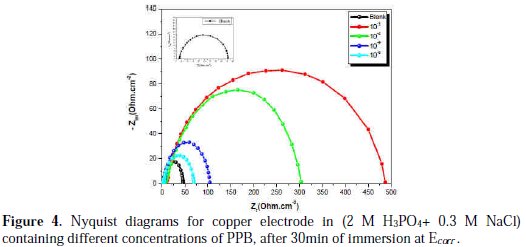
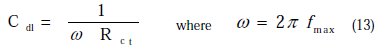
At open circuit, the spectrum shows one capacitive loop. In the presence of PPB, the capacitive loop size increases. The charge-transfer resistance (Rct) values are calculated from the difference in impedance at lower and higher frequencies, as suggested by Tsuru et al. [60]. The double layer capacitance (Cdl) and the frequency at which the imaginary component of the impedance is maximal (-Zmax) are found as represented in equation 13:
As observed, the Nyquist plots contain a depressed semi-circle with the center below the real X-axis, which size increased by increasing the inhibitor concentrations, indicating that the corrosion of copper is mainly a charge transfer process [61], and the formed inhibitive film was strengthened by increasing the concentration of the PPB inhibitor.
The equivalent circuit
The quantitative analysis of the electrochemical impedance spectra was studied based on a physical model of the corrosion process with hydrogen depolarization and with charge transfer controlling step. The simplest model includes the charge transfer resistance (Rct) in parallel to the capacitance (Cdl) connected with the solution resistance (Rs). The equivalent circuit model employed for this system is presented in Fig. 5.
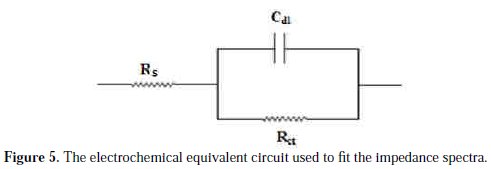
The obtained impedance diagrams are almost in a semi-circular appearance, indicating that the charge-transfer process mainly controls the corrosion of copper. Deviations of perfect circular shape are often referred to the frequency dispersion of interfacial impedance. This anomalous phenomenon may be attributed to the inhomogeneity of the electrode surface arising from surface roughness or interfacial phenomena. In fact, in the presence of the PPB, the values of Rct have enhanced and the values of double layer capacitance are also brought down to the maximum extent. The decrease in Cdl shows that the adsorption of the inhibitors takes place on the metal surface in acidic solution. The impedance parameters derived from these plots are shown in Table 2.
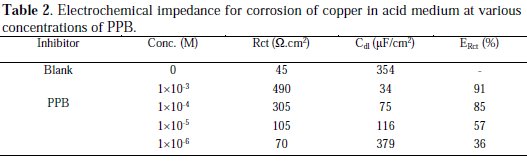
Again, the maximum percentage of inhibition efficiency (ERct %) was achieved at the concentration of 10-3 M (91%).
This percent inhibition efficiency is calculated by charge transfer resistance obtained from Nyquist plots, according to the equation 14:
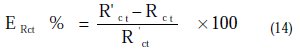
Where Rct and R'ct are the charge transfer resistance values without and with inhibitor, respectively.
Weight loss measurements and adsorption isotherm
Weight loss measurement was done according to the method described previously [62], which is a non-electrochemical technique for the determination of corrosion rates and inhibitor efficiency, providing more reliable results than electrochemical techniques, because the experimental conditions are approached in a more realistic manner. Yet, immersions tests are time-consuming [63-64]. Therefore, due to such differences, often due to experimental conditions, the values would obviously differ from the values of electrochemical measurements.
All the tests were conducted in an aerated 2 M H3PO4 medium containing 0.3 M NaCl at 298 K, with different concentrations of 1-pentyl pyridazinium bromide PPB. The values of the inhibition efficiency and corrosion rate obtained from the weight loss measurements of copper for different concentrations of PPB in phosphoric acid medium containing chloride at 298 K after 6h of immersion are given in Table 3.
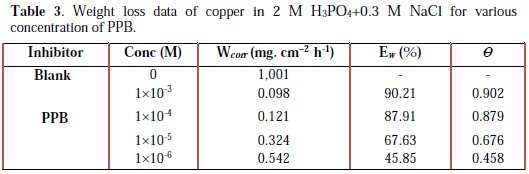
At the end of the tests the specimen were carefully washed in acetone and then weighed. Duplicate experiments were performed in each and the mean value of the weight loss has been reported. The inhibition efficiency (Ew %) and surface coverage (θ) were determined by using the following equations:
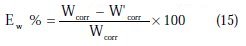
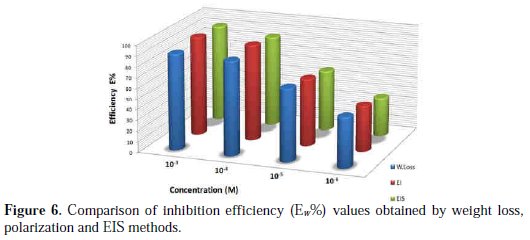
where Wcorr and W'corr are the corrosion rates of copper due to the dissolution in 2 M H3PO4 medium containing 0.3 M NaCl, in the absence and presence of a definite concentration of inhibitor, respectively, and θ is the degree of surface coverage of the inhibitor. It can be seen from Table 3 that 1-pentyl pyridazinium bromide (PPB) inhibits the corrosion of copper, and its efficiency increases with the increasing inhibitor's concentration. Maximum Ew% (90.21%) of PPB was achieved at 10-3 M. These polarization curves tests were in good agreement with the corrosion weight loss and impedance measurements (Fig. 6).
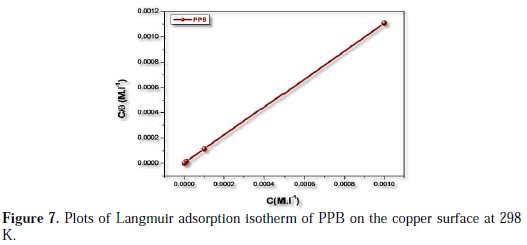
In order to understand the mechanism of corrosion inhibition, the adsorption behavior of the adsorbate on the copper surface must be known. Two main types of interaction can describe the adsorption of the molecule of PPB's physical adsorption and chemisorption. These are influenced by the chemical structure of the inhibitor, the type of the electrolyte and the charge and nature of the metal. The information on the interaction between the inhibitor molecule of PPB and the metal surface can be provided by the adsorption isotherm. The degree of surface coverage (θ) for different concentrations of the inhibitor was evaluated from weight loss measurements. Attempts were made to fit θ values to various isotherms, including Frumkin, Temkin and Langmuir. It was found that the best fit data were obtained with the Langmuir isotherm (Fig. 7).
According to this isotherm, θ is related to the inhibitor's concentration [65].
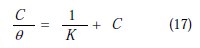
where K is the adsorption/desorption equilibrium constant, and C is the corrosion inhibitor concentration in the solution,
where ΔGads is the free energy of adsorption.
It was found that Fig. 7 (plot of θ/C versus C) gives a straight line with the slope near to 1, indicating that the adsorption of the compound under consideration on the copper/ acidic solution interface obeys Langmuir's adsorption.
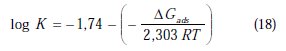
The free energy of adsorption (ΔG0ads) can be calculated from the Kads value obtained from the above correlation:
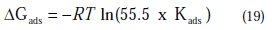
where 55.5 is the concentration of water, R is the universal gas constant and T is the absolute temperature.
The values of thermodynamic parameters are listed in Table 4
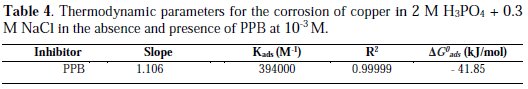
The adsorption-desorption equilibrium constant Kads, was determined as 10-3 M, leading to D G0ads = -41.85 kJ.mol-1 for PPB at the temperature of 298 K. The large Kads value gives a better inhibition efficiency, due to strong electrical interaction between the double layer and adsorbing inhibitor molecules, while a small Kads value compromises such interactions between the adsorbing inhibitor molecules and the metal surface, because they are weaker, indicating that the inhibitor molecules are easily removable by the solvent molecule from the surface [66]. The negative sign of ΔGads indicates the spontaneity of the adsorption process and the stability of the adsorbed layer on the electrode surface [67]. Generally, values of ΔGads around -20 kJ mol-1 or less negative are known to be associated with physical adsorption (electrostatic interactions between the inhibitor and charged surface), while those around -40 kJ .mol-1 or more negative are known to be associated with chemisorption (charge sharing or transferring from organic molecules to the metal surface form a coordinate type of metal bond) [68]. From this estimation, it can be concluded that PPB is chemically adsorbed on the charged copper surface.
Effect of temperature
Polarization curves
Temperature has a great effect on the corrosion phenomenon and the study of its effect on the corrosion rate and inhibition efficiency facilitates the calculation of kinetic and thermodynamic parameters for the inhibition and the adsorption processes. These parameters are useful in interpreting the type of adsorption by the inhibitor. For this purpose, we made potentiodynamic polarization in the range of temperature 298 to 328 K, in the absence and presence of PPB at 10-3 M. The corresponding data are shown in Fig. 8, Fig. 9 and Table 5.
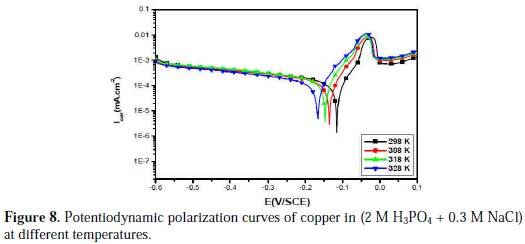
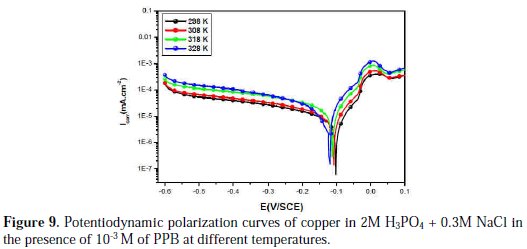
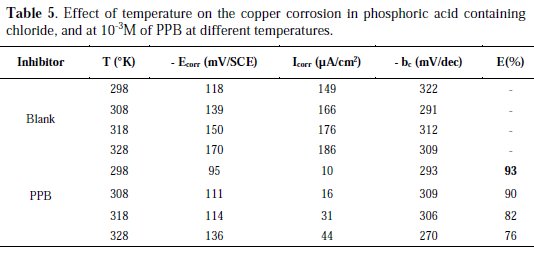
It is clear from Fig. 8 and Table 5 that the increase of corrosion rate is more pronounced with the rise of temperature for blank solution. It has been observed from Fig. 8 and Table 5 that in the presence of PPB, Icorr is highly reduced. Also, the inhibition efficiencies decrease slightly with an increase in temperature, indicating that higher temperature dissolution of steel predominates on adsorption of PPB at the metal surface and suggests a physical adsorption mode.
Kinetic parameters
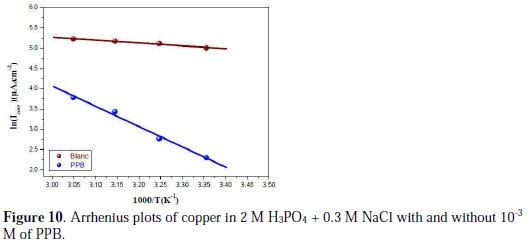
In order to obtain more details on the corrosion process, activation kinetic parameters such as activation energy in free and inhibited acid were calculated using Arrhenius equation.
The activation parameters for the studied system (Ea, ΔHa and ΔSa ) were estimated from the Arrhenius equation and transition state equation (Eq. 20-Eq.21):
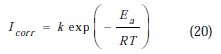
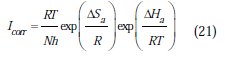
where k is the Arrhenius factor, Ea is the apparent activation corrosion energy, N is the Avogadro's number, h is the Plank's constant, δHa and δSa are the enthalpy and the entropy changes of activation corrosion energies for the transition state complex, and R is the perfect gas constant. The apparent activation energy was determined from the slopes of Ln (Icorr) vs. (1/T) (graph depicted in Fig. 10).
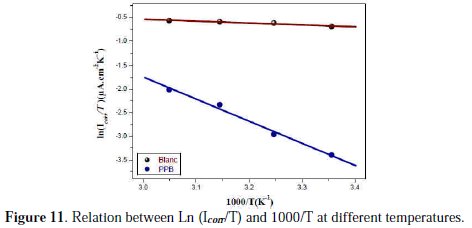
A plot of ln (Icorr/T) against 1/T (Fig. 11) gave a straight line with the slope (ΔHa /R) and the intercept (ln(R/N A h) + (ΔSa /R)), from which the values of ΔHa and ΔSa were calculated and listed in Table 6.
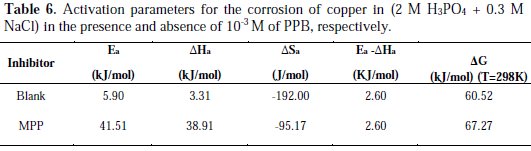
Increase in activation energy (Ea) of inhibited solutions compared to the blank suggests that the inhibitor is physically adsorbed on the corroding metal surface, while either unchanged or lower energy of activation in the presence of the inhibitor suggests chemisorption [69]. As reported in Table 6, Ea values increased greatly after addition of the inhibitor. Hence, corrosion inhibition of PPB is primarily occurring through physical adsorption. The positive signs of ΔHa reflected the endothermic nature of the copper dissolution process. The value of ΔSa is higher for the inhibited solution than that for the uninhibited solution. This phenomenon suggested that a decrease in randomness occurred on going from reactants to the activated complex. This might be the result of the adsorption of the organic inhibitor molecule from the acidic solution which could be regarded as a quasi-substitution process between the organic compound in the aqueous phase and water molecules at electrode surface [70]. Large negative values of entropies show that the activated complex in the rate determining step is an association rather than dissociation step, meaning that a decrease in disordering takes place on going from reactants to the activated complex [71, 72].
Computational procedures
In order to correlate experimental data obtained from different electrochemical technique for PQE and its structural and electronic properties, quantum chemical properties such as energy of highest occupied molecular orbital (EHOMO), energy of lowest unoccupied molecular orbital (ELUMO), HOMO-LUMO energy gap (δEL-H), vertical ionization potential (IE), vertical electron affinity (EA) and number of transferred electrons (δN) have been computed. These computed parameters are listed in Table 7.
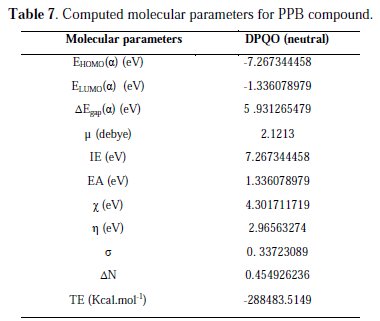
The vertical ionization potential (IE) and vertical electron affinity (EA) were computed using unrestricted Kohn-Sham formalism. The molecular band gap was computed as the first vertical electronic excitation energy from the ground state using the time-dependent density functional theory (TD-DFT) approach, as implemented in Gaussian 03. Frontier orbital theory is useful in predicting adsorption centers of the inhibitor molecules responsible for the interaction with surface metal atoms [73, 74]. Terms involving the frontier MO could provide dominative contribution, because of the inverse dependence of stabilization energy on orbital energy difference [73]. It has been reported in literature that the higher the HOMO energy of the inhibitor, the greater the trend of offering electrons to unoccupied d orbital of the metal, and the higher the corrosion inhibition efficiency. In addition, the lower the LUMO energy, the easier the acceptance of electrons from metal surface, as the LUMO-HOMO energy gap decreased and the efficiency of inhibitor improved [75]. Analysis of Fig. 12 shows the distribution of the two energies HOMO and LUMO localized in the atoms of pyridazine cycle.
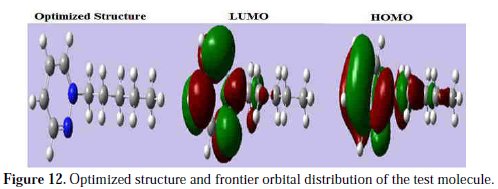
Consequently, this is the favorite site for interaction with the metal surface. The total energy of PPB is equal to 288483.5149 Kcal. mol-1. This result indicated that PPB is favorably adsorbed through the active centers of adsorption.
Optical microscopy (OM)
In order to study the morphology of the carbon steel surfaces in contact with acidic solution, Optical microscopy OM was used. After immersion in 2 M H3PO4 + 0.3 M NaCl solution for 7 days at 298 K, in the absence and presence of optimum concentration of PPB, the copper specimens were taken out, dried and kept in a desiccator. The OM images of copper immersed in 2 M H3PO4 + 0. 3M, in the absence and presence of the optimum concentration of PPB, are shown in Fig. 13 (A, B, C).
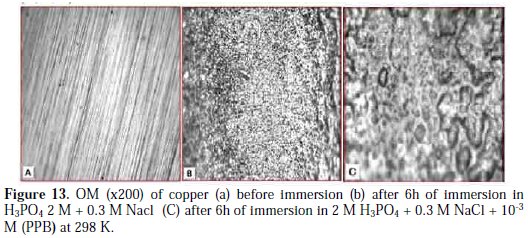
The resulting Optical microscopy micrographs reveal that the surface was damaged due to corrosion in absence of the inhibitor (blank), but in presence of the inhibitor, there is much less damage on the surface. This is attributed to the formation of a good protective film on the carbon steel surface.
Conclusions
The following can be concluded:
PPB act as good copper corrosion inhibitor in 2 M H3PO4 + 0.3 M NaCl. All electrochemical tests are in good agreement with the maximum percentage of inhibition efficiency obtained at the concentration of 10-3 M of PPB. Potentiodynamic polarization measurements demonstrate that PPB act as mixed- type inhibitor.
The values of apparent activation energy Ea increase with the increase in the inhibitor's concentration. Enthalpy of activation ΔHa reflects the endothermic nature of the copper dissolution process.
The adsorption of the organic molecule on the copper surface obeys the Langmuir adsorption isotherm. The negative values of free energy of adsorption (ΔGads) indicate that the adsorption process is spontaneous and chemically adsorbed on the copper surface.
The results obtained from weight loss, polarization curves and EIS are in reasonably good agreement.
The calculated quantum chemical parameters such as HOMO-LUMO energy gap and total energy support the good inhibition performance of pyridazinium based ionic liquid.
Morphological studied surface with optical microscopy micrographs showed that a film of inhibitor is formed on the copper electrode surface.
References
1. Charles J, Catelin D, Dupoiron F. Mater Technol. 1987;8:309. [ Links ]
2. Sedrik A J. Corrosion. 1986;42:376. [ Links ]
3. Nassif N. Surf Technol. 1985;26:189. [ Links ]
4. Trabanelli G. Corrosion. 1991;47:410. [ Links ]
5. Kim Ashassi-H S, Shaabani B, Seifzadeh D. Appl Surf Sci. 2005;239:154. [ Links ]
6. Wahdan M H, Hermas A A, Morad M S. Mater Chem Phys. 2002;76:111. [ Links ]
7. Bentiss F, Traisnel M, Lagrenee M Corros Sci. 2000;42:127. [ Links ]
8. Li X, Tang L, Li L, et al. Corros Sci. 2006;48:308. [ Links ]
9. Benabdellah M, Aouniti A, Dafali A, et al. Appl Surf Sci. 2006;252:8341. [ Links ]
10. Emregul KC, Hayvali M. Mater Chem Phys. 2004;83:209. [ Links ]
11. Vivekananthan S S, Sakunthala P, Kesavan D, et al. Chem Sci Rev Lett. 2013;1:195. [ Links ]
12. Raja P B, Sethuraman M G. Mater Letter. 2008;62:2977. [ Links ]
13. Belkhaouda M, Bammou L, Salghi R, et al. J Mater Environ. 2013;5:1042. [ Links ]
14. Chinnaiyan T, Thavan K. Chem Sci Rev Lett. 2014;3:10. [ Links ]
15. Kesavan D, Parameswari K, Lavanya M, et al. Chem Sci Rev Lett. 2014;2:415. [ Links ]
16. Ashassi-Sorkhabi H, Shaabani B, Seifzadeh D. Appl Surf Sci. 2005;239:154. [ Links ]
17. Hua Z, Xia SQ, Ma PS. Chem Technol Biotechnol. 2005;80:1089. [ Links ]
18. Ibrahim M A M, Messali M. Prod Finish. 2011;76:14. [ Links ]
19. Sato T, Maruo T, Marukane S, et al. J Power Sources. 2004;138:253. [ Links ]
20. Endres F. Chem Phys Chem. 2002;3:144. [ Links ]
21. Ue M, Takeda M, Toriumi A, et al. J Electrochem Soc. 2003;150:A499. [ Links ]
22. Ebenso E E, Alemu H, Umoren S A, et al. Int J Electrochem Sci. 2008;3:1325. [ Links ]
23. Sami BA. Int J Electrochem Sci. 2013;8:10788. [ Links ]
24. Sathianandhan B, Balahrishnan K, Subramnyan N. Br Corros J. 1970;5:270. [ Links ]
25. Tadros A B, Abdenaby B A. J Electroanal Chem. 1988;246:433. [ Links ]
26. Chin R J, Note K. J Electrochem Sot. 1971;118:545. [ Links ]
27. Eldakar N, Nobe K. Corrosion. 1976;32:238. [ Links ]
28. Eldakar N, Nobe K. Corrosion. 1976;33:128. [ Links ]
29. Agrawal R, Namboodhiri T K G. J Appl Electrochem. 1992;22:383. [ Links ]
30. Abdenaby B A, Eltourhy A, Elgamal M, et al. Surf Coat Technol. 1986;27:325. [ Links ]
31. Ateya B G, Elkhair A, Alqasimi R. Corros Sci. 1982;22:717. [ Links ]
32. Zucchi F, Trabanelli G, Brunoro G. Corros Sci. 1992;33:1135. [ Links ]
33. Zarrouk A, Messali M, Aouad M R, et al. J Chem Pharm Res. 2012;47:3427. [ Links ]
34. Ngo H L, Le Compte K, Hargens L, et al. Thermochim Acta. 2000;357:97. [ Links ]
35. Bonhote P, Dias A P, Papageorgiou N. et al. [ Links ] Inorg Chem. 1996;35:1168.
36. Dieter K M, Dymek C J, Heimer N E, et al. Am Chem Soc. 1988;110:2722. [ Links ]
37. Forsyth S A, Pringle J M, MacFarlane D R. Aust J Chem. 2004;57:113. [ Links ]
38. Endres F, El-Abedin S Z, Matter S. Phys Chem. 2006;8:2101. [ Links ]
39. Gasparac R, Martin C R, Stupnisek-Lisac E. J Electrochem Soc. 2000;147:548. [ Links ]
40. Zhang D Q, Gao L X, Zhu G D. Corros Sci. 2004;46:3031. [ Links ]
41. Muralidharan S, Iyer S V K. Anti-Corros Met Mater. 1997;44:100. [ Links ]
42. Shi S C, Yi P G, Cao C Z, et al. Chem Ind Eng Chin. 2005;56:1112. [ Links ]
43. Zhang QB, Hua YX. Electrochim Acta. 2009;54:1881. [ Links ]
44. Likhanova N V, Dominguez-Aguilar M A, Olivares-Xometl O, et al. Appl Electrochem. 2007;37:1153. [ Links ]
45. Quraishi M A, Rafiquee M Z A, Khan S, et al. Appl Electrochem. 2007;37:1153. [ Links ]
46. Mounir F, El-Issami S, Bazzi Lh, et al. IJRRAS. 2012;2:13. [ Links ]
47. Becke A D. J Chem Phys. 1992;96:9489. [ Links ]
48. Becke A D. J Chem Phys. 1993;98:1372. [ Links ]
49. Lee C, Yang W, Parr R G. Phy Rev B. 1988;37:785. [ Links ]
50. Frisch M J, Trucks G W, Schlegel H B, et al. Gaussian 03, Revision C.02. Pittsburgh, PA: Gaussian Inc; 2003. [ Links ]
51. Dewar M J S, Thiel W. J Am Chem Soc. 1977;99:4899. [ Links ]
52. Pearson R G. Inorg Chem. 1988;27:734. [ Links ]
53. Sastri V S, Perumareddi J R. Corrosion. 1997;53:617. [ Links ]
54. Lukovits I, Kalman E, Zucchi F. Corrosion. 2001;57:3. [ Links ]
55. Sangeetha M, Rajendran S, Sathiyabama J, et al. Port Electrochim Acta. 2011;29:429. [ Links ]
56. Rosliza R, Senin H B, Wan Nik W B. Colloids Surf. 2008;312:185. [ Links ]
57. Pinto G M, Nayak J, Shetty A N. Mater Chem Phys. 2011;125:628. [ Links ]
58. Bentiss F, Bouanis M, Mernari B, et al. Appl Surf Sci. 2007;253:3696. [ Links ]
59. Bentiss F, Gassama F, Barbry D, et al. Appl Surf Sci. 2006;252:2684. [ Links ]
60. Tsuru T, Haruyama S, Gijutsu B. J Jpn Soc Corros Eng. 1978;27:573. [ Links ]
61. Aljourani J, Raeissi K, Golozar M A. Corros Sci. 2009;51:1836. [ Links ]
62. Ajmal M, Mideen A S, Quraishi M A. Corros Sci. 1994;36:79. [ Links ]
63. Hussin M H, Kassim M J. Mater Chem Phys. 2011;125:461. [ Links ]
64. De Souza F S, Spinelli A. Corros Sci. 2009;51:642. [ Links ]
65. Kumar B S S, Nayak J, Shetty A N. J Coat Technol Res. 2011;4:1. [ Links ]
66. Nasshorudin D. MSc dissertation. Universiti Sains Malaysia; 2010. [ Links ]
67. Hussi M H, Kassim M J. Mater Chem Phys. 2011;125:461. [ Links ]
68. Benali O, Larabi L, Traisnel M, et al. Surf Sci. 2007;253:6130. [ Links ]
69. Tsuru T, Haruyama S, Gijutsu J. Soc Corros Eng. 1978;27:573. [ Links ]
70. Afia L, Salghi R, Zarrouk H, et al. Port Electrochim Acta. 2012;30:267. [ Links ]
71. Oguzie E E. Corros Sci. 2007;49:1527. [ Links ]
72. Martinez S, Stern I. Appl Surf Sci. 2002;199:83. [ Links ]
73. Fang J, Li J. J Mol Struct. 2002;593:179. [ Links ]
74. Bereket G, Hur E, Ogretir C. J Mol Struct. 2002;578:79. [ Links ]
75. Khaled K F. Appl Surf Sci. 2008;255:1811. [ Links ]
*Corresponding author. E-mail address: r.salghi@uiz.ac.ma
Received 05 August 2015; accepted 23 October 2015

