


Serviços Personalizados
Journal
Artigo
 Inglês (pdf)
 Artigo em XML
 Referências do artigo
 Enviar este artigo por email
Indicadores
-
 Citado por SciELO
 -
 Acessos
Links relacionados
-
 Similares em
SciELO
Similares em
SciELO
Compartilhar

 Permalink
Portugaliae Electrochimica Acta
versão impressa ISSN 0872-1904
Port. Electrochim. Acta vol.33 no.5 Coimbra set. 2015
https://doi.org/10.4152/pea.201505289
Effect of Gadolinium Content on the Corrosion Behavior of Magnesium Alloys in 1 wt.% NaCl Solution
N. Zidanea , Y. Ait Albrimia , A. Ait Addib , R. Ait Akboura , J. Doucha , A. Nahleb and M. Hamdania,*
a Laboratoire de Chimie Physique, Faculte des Sciences, Universite Ibn Zohr, B.P. 8106, Dakhla, Agadir, Maroc.
b Department of Chemistry, Corrosion Prevention & Control Research Center, College of Sciences, University of Sharjah, PO Box: 27272, United Arab Emirates.
Abstract
The aim of this work was to study the effect of gadolinium content on the corrosion behavior of magnesium alloys in 1 wt.% NaCl solution at 21.5 (±0.5) °C. Four Mg-Gd alloys, namely Mg-2 wt.% Gd, Mg-5 wt.% Gd, Mg-10 wt.% Gd, and Mg-15 wt.% Gd, were studied. Weight loss measurements, potentiodynamic tests, electrochemical impedance spectroscopy, XR diffraction, and scanning electron microscopy combined with energy-dispersive X-ray spectroscopy (SEM-EDS) were performed on the four Mg-Gd samples. The results showed the influence of the Gd content on the corrosion behavior of these alloys in 1wt.% NaCl solution. The corrosion resistance of the Mg-Gd alloys was improved with the introduction of 10 wt.% Gd in Mg matrix. Thus, weight loss and electrochemical measurements revealed the better corrosion resistance for Mg10 wt.% Gd alloy. Further addition of Gd exceeding 10 wt.% in a magnesium matrix reduces the corrosion resistance of Mg-alloy and induces an incremental increase in the corrosion rate.
Keywords: magnesium alloys, biomaterials, corrosion resistance, gadolinium alloying.
Introduction
Properties of high strength-to-weight ratio and high stiffness-to-weight ratio make magnesium based alloys very attractive for uses where lightweight materials are required [1-6]. However, due to their biocompatibility, magnesium alloys are suitable candidate for degradable material as implants. Moreover, these materials have received considerable attention due to the fact that their mechanical characteristics are close to those of natural bone [7-10]. The main limitation of magnesium for use as an implant is its very high corrosion rate, especially in wet or aqueous environments. The corrosion of Mg is accompanied by hydrogen evolution and basification of the electrolytic solution. One of the most efficient ways to protect Mg from corrosion is by alloying it with different metals. Therefore, efforts have been made to improve its corrosion performance by modifying the composition with one or more elements in various weight percentages. Thus, alloying is commonly used to protect Mg against corrosion phenomena that rely greatly on their microstructure and the distribution of alloying elements in the Mg matrix [11-15). In order to improve the corrosion resistance of such Mg alloys, this present research was carried out. Magnesium alloys containing particularly high solubility rare earth metals (RE) such Gd, Dy, Y, Nd, La, and Ce [11-21] have recently been studied. The distribution of these alloying elements in the Mg matrix was responsible for the change of the corrosion behavior of Mg alloys by the formation of new a corrosion resistant crystallographic b-phase [22-24]. Even though the corrosion resistance of some magnesium alloys can be enhanced by adding elements, the latter should have low toxicity for biomedical applications. Recent references suggest that Mg-Gd alloy is suitable for a biocompatible implant as Gd has high solubility in solid Mg [7]. As yet, literature reports are relatively scarce [7,25]. However, investigation of the influence of the amount of Gd in binary Mg-Gd alloys on the corrosion behavior in 1 wt.% NaCl solution has shown that introducing Gd in optimum concentration led to a reduction of the corrosion rate as long as the Gd was in solid solution. The corrosion rate increased significantly as soon as there were precipitates in the microstructure of the Mg-Gd alloys [7]. However, some recent studies on Mg-Y and Mg-Gd alloys prepared by magnetron sputtering reported that there was no significant change in the corrosion rate with alloying content in 3.5 wt.% NaCl solution saturated with Mg(OH)2 [25]. It was reported that the investigation was carried out on Mg-alloys using long-term techniques such as weight loss determinations and hydrogen measurements, or short term techniques such as potentiodynamic measurements, electrochemical impedance spectroscopy, and surface characterization (SEM-EDS, XRD, and XPS). In general, good corrosion resistance of a given material can be identified by low corrosion current density, high corrosion potential and high polarization resistance.
The aqueous Mg corrosion process and hydrogen evolution can be represented by the reactions [8,26]:


The overall corrosion reaction leads to the formation of Mg(OH)2 accompanied by the hydrogen evolution, following Equation 3

In the presence of chloride ions, Mg2+ ions react to form the soluble salt MgCl2, according to Equation 4:

It is well known that the corrosion resistance of Mg-alloys decreases as the concentration of Cl-increases in the aqueous solution, due to the destruction of the protective layer on their surface. Also, the corrosion resistance of such materials is mainly improved in strong rather than in weak-alkaline solution, or neutral or acidic solutions [27]. This is likely due to the formation of a compacted corrosion product layer on the surface of the alloy in alkaline solutions, which also occurs with a decrease in the concentration of aggressive ions. It was concluded that the corrosion protection products layer was better at high pH values of the solution. The stability of protective layer decreased with either increasing Cl-concentration or lowering of the solution pH [27]. In the present study, binary Mg-Gd alloys were investigated to determine the influence of different amounts of Gd on the corrosion behavior of magnesium alloys. Four different Mg-Gd alloys (2, 5, 10, and 15 wt.%) were tested electrochemically in 1 wt.% NaCl solution at 21.5 °C. Weight loss, open circuit potential, Tafel polarization curves, electrochemical impedance spectroscopy (EIS), scanning electron microscopy combined with energy-dispersive X-ray spectroscopy (SEM-EDS), and XR diffraction were used. The main objectives of the present study were (i) to investigate the effect of Gd content on the corrosion behavior of Mg-Gd alloys, and (ii) to answer the question ''can alloying improve and tailor the corrosion resistance of the Mg-Gd, or not?''.
Experimental
Materials and samples
For the present investigation, Mg-2 wt.% Gd, Mg-5 wt.% Gd, Mg-10 wt.% Gd, and Mg-15 wt.% Gd were used. These materials were offered by a German team that has already described the preparation method of the Mg alloys in a previous publication [7]. All investigated materials were cylindrical in shape (15 mm in diameter and 4 mm thickness) cut into Mg-alloy rods. The samples were prepared by grinding each side with 1200 grid emery paper, the surfaces degreased ultrasonically with ethanol and finally dried in open air prior to corrosion testing. 1 wt.% (10 g.L-1) sodium chloride aqueous solution was prepared using bi-distilled water. The initial pH value of the prepared solution was 6.5 (±0.1) and the temperature was kept at 21.5 (±0.5) °C using a DBO- meter chamber. The pH was measured using a pH-meter (Knick 766 Calimatic). All reagents used in this work were analytical grade.
Weight loss measurements
After cleaning, samples of each alloy type were immersed (i.e., suspended) in 200 mL of naturally aerated quiescent 1 wt.% NaCl solution at 21.5 (± 0.5) °C.
The samples were weighed before and after immersion in the unstirred solutions, which were open to the atmosphere. After exposure, corrosion products were removed by immersing the samples in 180 g.L-1 chromic acid for 20 minutes at room temperature [7]. After acid cleaning, samples were rinsed ultrasonically in ethanol, dried in the open air then reweighed. The difference in mass of the Mgalloy samples per surface unit area is defined as the corrosion rate (CR=Dm/S) in the solution after 24 hours of immersion. Each measurement was performed twice on a new specimen and the average was reported. The standard deviation of the observed weight loss was less than 6%. After 24 hours of immersion and before acid cleaning, all specimens increased in weight. An analytical balance with an accuracy of ±0.1 mg was used for weighing the Mg-alloy specimens. The average corrosion resistance of the alloys was also calculated and expressed in mm.year-1 according to the following equation [7]:
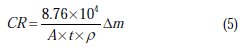
where: Dm = weight change [g]; A = surface area [cm2]; t = time [hour], and r = density of the alloy [g.cm-3].
Electrochemical measurements
Mg-alloy samples in disc form were used as the working electrodes in quiescent 1 wt.% NaCl aqueous solution at 21.5 (±0.5) °C. The specimens were mounted on a glass tube using Araldite epoxy resin and only one side of the specimen was in contact with the electrolyte (1.8 cm2). The electrical contact with the remaining side of the test electrode was made using a rigid copper wire. Electrochemical studies were carried out in a single-compartment three-electrode glass cell. The potential of the working electrode was measured against a saturated calomel electrode (SCE) (0.240 V vs. SHE). The SCE was connected through a KCl-containing agar-agar salt bridge, the tip of which was placed as close as possible to the surface of the working electrode in order to minimize the solution resistance between the test and reference electrodes (IR drop). The aerated and unstirred electrolyte had a volume of 200 mL. The counter electrode consisted of a platinum plate, 6 cm2 in surface area. The volume of the aerated and unstirred electrolyte used was 200 mL.
The electrochemical study was performed using a computerized electrochemical potentiostat set Voltalab PRZ 100 (Radiometer-Analytical). The corrosion behavior of the Mg-alloys was investigated using potentiodynamic polarization technique. The polarization curves were measured after determination of the open circuit potential of the test electrode. For all electrochemical investigations, the open-circuit potential (OCP) was measured for at least 90 minutes. The polarization curves were recorded in the range of -2.0 to + 1.0 V vs. SCE in 1 wt.% NaCl aqueous solutions at a scan rate of 1 mV.s-1 while each specimen was held in the vertical position.
The experimental procedures and conditions employed in the EIS study were similar to those described previously [28,29]. An AC voltage amplitude of 5 mV peak-to-peak voltage excitation and a frequency range of 10-2-105 Hz were employed during the impedance measurements. Results were displayed in the form of Nyquist plots. Each experiment was repeated at least three times to ensure reproducibility.
SEM-EDS and X-ray diffraction
The corrosion morphologies of the Mg-alloys were characterized using a high resolution SEM (Zeiss Ultraplus 40, Germany) equipped with an energy dispersive X-ray spectrometer (EDS) to analyze the composition of the samples. The phase content of the samples was monitored using X-ray diffraction (XRD) (Pan Analytical X'Pert PRO, CuKα = 1.5406 Â) from Kiel University, Germany.
Results
pH measurements
The corrosion of the Mg-alloys immersed in 1 wt.% NaCl aqueous solution was accompanied by hydrogen evolution, according to the overall reaction (Equation 3), leading to an increase of the alkalinity of the solution. Fig. 1 depicts typical hydrogen evolution through the pH change as a function of immersion time of a specimen Mg-alloy in 200 mL of 1 wt.% NaCl solution at 21.5 °C.
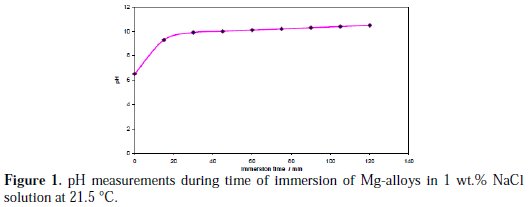
The solution was homogenized prior to the pH measurements. The pH values of the solution increased rapidly from 6.5 to 9.3 during the first 15 minutes. This was followed by a period of slower pH increase between 9.3 and 10.0 during the next 30 minutes.
After 90 minutes, the pH of the solution reached the steady state (10.5). The pH of the used solutions did not exceed 10.7 irrespective of the composition of the samples and the immersion time. This result probably was due to Mg(OH)2 that was suspended in water (called milk of magnesia) which exhibits a pH between 9.5 and 10.5. The formation of one Mg(OH)2 molecule leads to formation of one H2 molecule (equation 3).
Doepke et al.[30] reported that the rising pH during immersion of Mg in NaCl solutions was most likely moderated by the formation of a corrosion product laying on the surface of the Mg sample that decreased the overall corrosion rate. In addition, the increased pH of the solution decelerated the corrosion activity due to the precipitation of a passivating film on the surface [31]. Generally, the magnesium alloy has high corrosion resistance in alkali solution but is active in acidic or neutral environments [27,32]. In strong alkaline solution, much of the Cl- ions were replaced by OH- ions so that the adsorption of Cl- on the layer was consequently reduced.
Weight loss measurements
Weight loss determinations for the four Mg-alloys have been performed after immersion in 1 wt.% NaCl solution after 24 hours at 21.5 °C, and the results are depicted in Fig. 2.
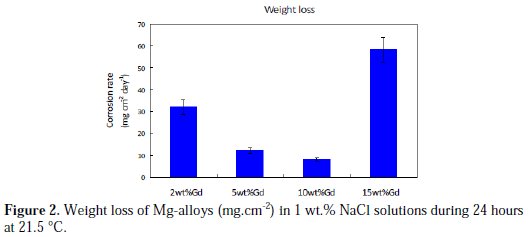
The weight of the corrosion products that remained insoluble on the Mg-alloy surface was determined by weighing the corroded sample before and after cleaning. It was observed that the corrosion products that formed during immersion in the NaCl solution remained largely insoluble on the surface of the samples. Table 1 summarizes the corrosion rates obtained for the different Mgalloys.
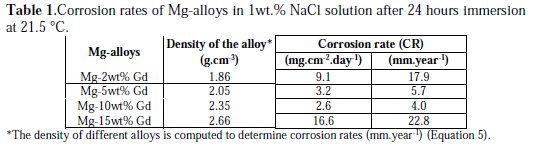
It can be observed from the data that the value of corrosion rate (CR) decreased and reached 2.6 mg.cm-2.day-1 which corresponds to 4.0 mm.year-1, when the percentage of Gd increased to 10 wt.%. However, the corrosion rate was the highest (16.6 mg.cm-2.day-1) for the alloy containing 15 wt.% Gd. In addition, the color of the solution used with the 15 wt.% Gd sample turned whitish, which could be clearly observed with the naked eye during the immersion test period. This milk-like coloration could be due to the presence of great quantity of Mg(OH)2, i.e., milk of magnesia, in colloidal form in the solution.
For the same binary Mg-Gd alloy and under the same conditions, Hort et al. [7] reported from weight loss measurements that the corrosion rate initially decreased and then increased. Mg-10 wt.% Gd alloy exhibited the lowest corrosion rate. A similar trend was also reported with the binary Mg-10 wt.% Dy alloy [17], and the mechanism responsible for an optimal corrosion resistance for Mg-10 wt.% RE (rare earth metals) is under investigation. The corrosion process of Mg-alloys when immersed in NaCl solution could be explained on the basis that the surface of the alloy is covered with a film of corrosion products. In some part of the alloys surface, the film is permeable, which may permit the Cl-ions to penetrate and reach active sites on the surface of the alloy beneath the formed corrosion product film. Cl-ions may also dissolve Mg(OH)2 which in turn will thin the passive film, allowing the aggressive ions to reach the alloy substrate more easily.
Open circuit potential
Fig. 3 shows the open circuit potential (OCP) of the Mg-alloy electrodes versus time in aerated and unstirred 1 wt.% NaCl solutions at 21.5 °C.
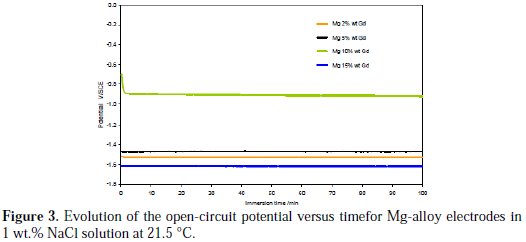
The curves demonstrate that most of the Mg-alloy electrodes reached a steady from the beginning, except in the case of the Mg-10 wt.% Gd alloy. The OCP values of the Mg-alloys changed in the following increasing order: Mg-15 wt.% Gd < Mg2 wt.% Gd < Mg-5 wt.% Gd < Mg-10 wt.% Gd. At the onset of corrosion there was an incubation period, during which the OCP of Mg-10 wt.% Gd tends initially to decrease abruptly towards the negative direction (during the first minute), indicating that a film has been formed on the surface of the specimen, before reaching a steady state at -0.888 V vs. SCE. The steady state condition indicates that a dynamic balance has been established between development of the corrosion activity and the deposit of the corrosion products on the surface of the alloy when the whole specimen surface has corroded. The time needed to attain a steady state was about 3-4 minutes. For all Mg-alloys, the OCP remained constant up to 100 minutes. The steady state condition might be due to the lack of variation in the interface composition. By comparing the OCP values obtained for all the specimens it can be observed that the OCP value of Mg-10 wt.% Gd shifted to a noble potential value by at least 0.6 V. This increase of OCP suggests a reduction of susceptibility of the alloy to the corrosion process but the OCP values do not provide any information on the corrosion kinetics [33]. That is to say that the Mg-alloy interfaces immersed in 1 wt.% NaCl solution probably undergo formation of a magnesium hydroxide film wherein the adsorbed Cl-ions do not reduce the effectiveness of the protective film.
Tafel polarization measurements
Potentiodynamic polarization measurement is a convenient and effective method to characterize the thermodynamics and the kinetics of the reaction which takes place on the working electrode surface. The corrosion potential (Ecorr) and corrosion current (Icorr) values can be extracted from the potentiodynamic polarization curves. Fig. 4 shows Tafel current-potential curves for the Mg-alloys after 90 minutes of immersion in aerated stagnant 1 wt.% NaCl solutions at 21.5 °C.
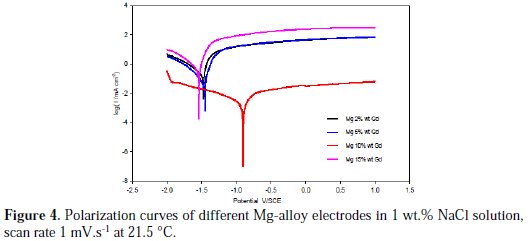
The polarization curves are not symmetrical on the anodic and cathodic branches. The curves are recorded over the potential range of -2.0 to +1.0 V vs. SCE and scanning in the positive direction at a scan rate of 1 mV.s-1. All of the polarization curves showed the same trend. The cathodic polarization curves are assumed to represent the hydrogen evolution through reduction of the water molecules and followed Tafel behavior, while the anodic polarization curves represent the dissolution of magnesium. The polarization curves obtained were similar to each other in terms of current densities and corrosion potential, with the exception of the polarization curve obtained for the Mg-10 wt.% Gd electrode. Thus, the electrochemical behavior of the three Mg-alloys was similar. The potentiodynamic polarization curve obtained for the Mg-10 wt.% Gd electrode clearly shows that both the cathodic and anodic current densities were reduced and the corrosion potential, Ecorr, was shifted by about 0.6 V in the positive direction (less active region). The influence of the Gd content on the free corrosion potential was negligible for the other three Mg-alloys. The ennoblement of corrosion potential by about 0.6 V should indicate good corrosion resistance for the Mg-10 wt.% Gd alloy. This result was consistent with weight loss and OCP measurements.
The cathodic curves indicated that the cathodic process was not diffusion controlled. During the cathodic process, hydrogen was produced in the form of bubbles on the electrode surface. Therefore the slope of the cathodic curves was steep.
Despite having the same shape, it can be seen that both the anodic part and cathodic part obtained for Mg-10 wt.% Gd electrode presented low current density values compared to the other alloy electrodes. This means that the Mg-10 wt.% Gd content had significant effects on retarding the cathodic hydrogen evolution reaction and on the dissolution of Mg-alloy. The electrochemical parameters obtained from the polarization curves, including the open circuit potential (OCP), corrosion potential (Ecorr), and corrosion current densities (Icorr), are summarized in Table 2.
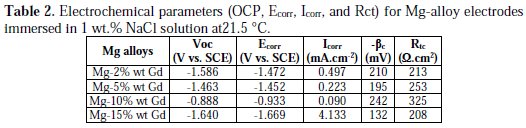
The values of corrosion current were estimated based on the Tafel extrapolation method for the most linear part of the cathodic branch of the polarization curve back to Ecorr, and are given as a function of the nature of the alloy. It is clearly shown that for the 10% Gd electrode, the open circuit potential (OCP) was the highest and the corrosion current density was the lowest. Judging from the polarization curves (Fig. 4 and Table 2), the cathodic reaction and the anodic reaction were significantly lower as a result of the addition of 10 wt.% Gd.
It is evident that the corrosion potential (Ecorr) values are slightly different from those of open circuit potential (OCP) due to the modification into the Mg-alloy electrode surface.
EIS study
EIS measurements were performed to characterize the magnesium alloy/solution interface. In order to investigate the corrosion behavior of the alloys and stability of the film formed on the interface, the EIS measurements were carried out at the OCP in 1 wt.% NaCl solution. Fig. 5 depicts typical Nyquist plots for the studied Mg-alloys.
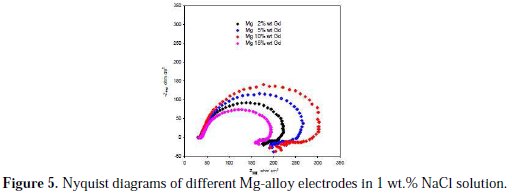
It can be seen from this figure that all of impedance spectra were rather similar, except the difference in the semicircle diameter. The EIS diagram presents the 'semicircles' for capacitive behavior at high frequencies (HF) in combination with an inductive loop at low (LF) frequencies. The impedance response of the electrode, which was apparent from the higher impedance values obtained, changed with the Gd content.
Many studies support the use the capacitive loop to extract the charge transfer resistance Rct to obtain information on the corrosion rate [34-37].The diameter of the capacitive loop is associated with the charge transfer resistance of the corrosion process [35-37]. Rct is inversely related to the corrosion current density. The literature associates the corrosion of magnesium alloys to the diameter of this capacitive loop in the higher frequency region with the charge transfer resistance (Rct) of the corrosion process [38]. Thus, Rct increases in the following order: Mg-15 wt.% Gd < Mg-2 wt.% Gd < Mg-5 wt.% Gd < Mg-10 wt.% Gd, which ranked the corrosion resistance of alloys in the same way as shown in Table 2. The decrease of Rct means that the corrosion of Mg-alloys accelerates. These results also were consistent with the results obtained by weight loss, OCP and potentiodynamic measurements.
The second loop is present with all the specimens in low magnitude. King et al. [39] studied the corrosion of Mg using EIS and asserted that the electrochemical response usually displays inductive behavior with decreasing frequency. The inductive loop interpretation has been discussed in the literature and was attributed to species adsorption [40,41]. Thus, the inductive loop was ascribed to a process involving Mg+ even though there was no firm evidence for the presence of the Mg+ ion [42,43], or as Mg2+ ions, or MgOH+, and to the dissolution of the protective film on the electrode surface [38]. For others, the interpretation of the inductive behavior observed in the Nyquist plot is immaterial in studies of electrochemical corrosion as the kinetic information is estimated from the capacitive arc [38,44].
SEM and EDS
The morphology and the composition of corrosion products formed on Mg-alloys after the 4 hour immersion test in 1 wt.% NaCl was characterized by means of scanning electron microscopy equipped with energy-dispersive X-ray spectroscopy (SEM-EDS). Fig. 6 (1 to 4), show the SEM microstructures of the Mg-alloy surfaces after 4 hours immersion in 1 wt.% NaCl at 21.5 °C. In general, the film of products was fragile and uncompact.
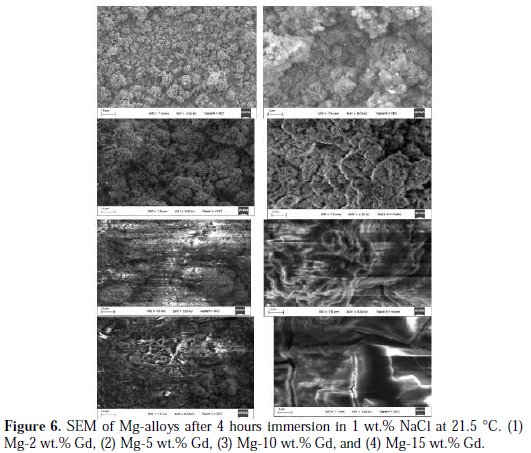
The film formed on the Mg-alloy surface with 2 and 5 wt.% Gd showed a cauliflower-like porous shape at a low magnification. At relatively high magnification the deposits were gypsum flower-like. The corrosion compounds formed on the surface of these two alloys contained crevices. The surface obtained after the immersion test of the specimen with 10 wt.% Gd was less rough than the former and appeared to be covered by an accretion. The formed film appeared thicker and smoother than on the other alloys, and should protect the Mg metal. The insoluble corrosion products on the surface of the alloy slow down the corrosion rate. The corrosion products formed on the 15 wt.% Gd were smoother but crackled. Even though the layer was thick, it did not offer strong protection.
The differences may be caused by the different distribution of alloying elements in microscopic scale and the microstructure of alloys, which are the fundamental reasons for the metal corrosion morphology and corrosion resistance. In order to identify the elemental composition of the corrosion products of different specimens, EDS analysis was performed on the corrosion products from the alloys after 4 hours immersion in 1wt.% NaCl and the results are listed in Table 3.

It can be seen that the formed corrosion film on 10% Gd alloy contained the highest amount of Gd and surprisingly the highest amount of Na+ and Cl- ions, in addition to a small amount of La.
X-ray diffraction
Observations with the naked eye of the Mg-alloys after 4 hours immersion in 1 wt.% NaCl solution at 21.5 °C showed that their surface was covered with a white compound. The XRD patterns of the 2 wt.% Gd alloy are presented in Fig. 7.
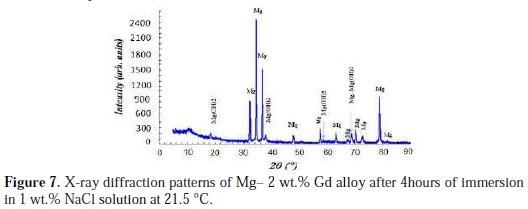
Similar XRD patterns were obtained for the four studied Mg-alloys but are not shown. They were compared with the JCPDS Card No. 44-1482 and with the JCPDS card No. 35-0821 for identifying Mg(OH)2 and magnesium metal, respectively. The peaks at around 2θ = 18.5, 38.0, 58.7 and 68.8 were assigned to the brucite type Mg(OH)2. The product could be indexed to the hexagonal structure of magnesium hydroxide. In addition, the peaks at around 2θ = 32.3, 34.5, 36.7, 47.9, 57.6, 63.3, 67.6, 68.8, 70.3, 72.8, 78.9 and 81.9 were attributed to Mg metal. It is well known that the corrosion products of Mg in NaCl solutions are mainly Mg(OH)2 and amorphous MgO phase [42,45].
Discussion
Alloying is one of the most used methods of enhancing the corrosion resistance of Mg and its alloys. The immersion of Mg-alloys in NaCl aqueous solutions involves a corrosion process that is concomitant with H2 evolution and consequently an increase in the pH of the solution. The results obtained by weight loss determinations, OCP measurements, potentiodynamic scans, and EIS plots were in accordance with the deduction of corrosion process of the Mg-10 wt.% Gd alloy.
Corrosion of this last alloy was lower in 1 wt.% NaCl alkaline solution because of the lower mass loss, reduced corrosion current (Icorr), corrosion potential (Ecorr) shift in the positive direction, and the enlarged capacitive loop that which represented larger charge transfer resistance, Rct. The morphology and composition of the corrosion compounds obtained for the Mg-10 wt.% Gd alloy seem to be different to those of the other studied alloys. The predominance of the b-phase in the Mg-10 wt.% Gd alloy should increase the compactness of the Mg(OH)2 formed on the Mg-alloy surface, which slows down the dissolution of the corrosion product and consequently decreases the corrosion rate of the Mgalloy [7]. The reason might be that after the addition of 10 wt.% Gd in the magnesium matrix, the b-phase particles are easy to precipitate in the magnesium matrix during the process of heat treatment processing. Furthermore, the morphology of the film, which is continuous over the exposed surface, plays the role of a corrosion barrier. Additionally, based on the presence of Na+ and Clions in composition of corrosion compounds, as shown by the EDS analysis, in the case of Mg-10 wt.% Gd alloy, the formed film impedes diffusion of these aggressive ions to the metal interface. In case of weight loss experiments, visual observation of the Mg-10 wt.% Gd electrode surface during the immersion tests revealed a continuous decrease in the rate of hydrogen gas evolution on its surface with time, compared with the other alloys, suggesting a decrease in the corrosion rate.
Conclusions
The corrosion behavior of Mg-2 wt.% Gd, Mg-5 wt.% Gd, Mg-10 wt.% Gd, and Mg-15 wt.% Gd was studied using weight loss, OCP, electrochemical measurements, SEM-EDS, and RXD techniques in 1 wt.% NaCl solution. The electrochemical results were consistent with the weight loss measurements. Alloying was observed to play an important role in modulating the corrosion behavior of the Mg-alloys. Thus, introduction of 10 wt.% Gd in the Mg matrix improved the corrosion resistance appreciably in 1 wt.% NaCl solution.
References
1. Blawert C, Morales E D, Dietzel W, et al.Mater Sci Forum. 2005;488-489:697. [ Links ]
2. Majumdar J D, Galun R, Mordike B, et al. Mater Sci Eng A. 2003;361:119. [ Links ]
3. Song W, Martin H J, Hicks A, et al. Corros Sci. 2014;78:353. [ Links ]
4. Song G, Atrens A. Adv Eng Mater. 1999;1:11. [ Links ]
5. Gray J E, Luan B. J Alloys Compd. 2002;336:88. [ Links ]
6. Ghali E, Dietzel W, Kainer K. J Mater Eng Perform. 2004;1:7. [ Links ]
7. Hort N, Huanga Y, Fechner D, et al. Acta Biomater. 2010;6:1714. [ Links ]
8. Choi Y, Salmanb S, Kuroda K, et al. Corros Sci. 2012;63:5. [ Links ]
9. Hanzi A C, Gunde P, Schinhammer M, et al. Acta Biomater. 2009;5:162. [ Links ]
10. Zhao L, Cui C, Wang Q, et al. Corros Sci. 2010;52:2228. [ Links ]
11. Srinivasan A, Huanga Y, Mendis C L, et al. Mater Sci Eng A. 2014;595:224. [ Links ]
12. Doepke A, Xue D, Yun Y, et al. Electrochem Acta. 2012;70:165. [ Links ]
13. Zhao X, Shi L L, Xu J. J Mater Sci Technol. 2013;29:781. [ Links ]
14. Liu M, Schmutz P, Uggowitzer P J, et al. Corros Sci. 2010;52:3687. [ Links ]
15. Kubasek J, Vojtech D. T Nonferr Metals Soc. 2013;23:1215. [ Links ]
16. Peng Q, Wang J, Wu Y, et al. Mater Character. 2008;59:435. [ Links ]
17. Yang L, Huang Y, Peng Q, et al. Mater Sci Eng B. 2011;176:1827. [ Links ]
18. Yang L, Huang Y, Feyerabend F, et al. Acta Biomater. 2013;9:8499. [ Links ]
19. Yang L, Huang Y, Feyerabend F, et al. J Mech Behav Biomed Mater. 2012;13:36. [ Links ]
20. Yang L, Hort N, Laipple D, et al. Acta Biomater. 2013;9:8475. [ Links ]
21. Leng Z, Zhang J, Yin T, et al. J Mech Behav Biomed Mater. 2013;28:332. [ Links ]
22. Song G. Adv Eng Mater. 2005;7:563. [ Links ]
23. Zhao M C, Liu M, Song G, et al. Corros Sci. 2008;50:1939. [ Links ]
24. Song G, Atrens A, Wu Z, et al. Corros Sci. 1998;40:1769. [ Links ]
25. Schluter K, Shi Z, Zamponi C, et al. Corros Sci. 2014;78:43. [ Links ]
26. Mueller W D, Nascimento M L, Mele M F L. Acta Biomater. 2010;6:1749. [ Links ]
27. Gao L, Zhang C, Zhang M, et al. J Alloys Compd. 2009;468:285. [ Links ]
28. Laouini E, Douch J, Hamdani M, et al. J Appl Electrochem. 2011;41:731. [ Links ]
29. Laouini E, Hamdani M, Pereira M I S, et al. Int J Electrochem Sci. 2009;4:1074. [ Links ]
30. Doepke A, Kuhlmanna J, Guo X, et al. Acta Biomater. 2013;9:9211. [ Links ]
31. Ambat R, Aung N N, Zhou W. J Appl Electrochem. 2000;30:865. [ Links ]
32. Zeng R, Zhang J, Huang W, et al. Trans Nonferrous Met Soc China. 2006;16:763. [ Links ]
33. Kartsonakis I A, Balaskas A C, Koumoulos E P, et al. Corros Sci. 2012;65:481. [ Links ]
34. Pebere N, Riera C, Dabosi F. Electrochim Acta. 1990;35:555. [ Links ]
35. Mathieu S, Rapin C, Hazan J, et al. Corros Sci. 2002;44:2737. [ Links ]
36. Baril G, Pebere N. Corros Sci. 2001;43:471. [ Links ]
37. Feliu S, Samaniego A, Barranco V, et al. Appl Surf Sci. 2014;295:219. [ Links ]
38. Feliu S J, Samaniego A, Barranco V, et al. Corros Sci. 2014;80:461. [ Links ]
39. King A D, Birbilis N, Scully J R. Electrochim Acta. 2014;121:394. [ Links ]
40. Xin Y C, Liu C L, Zhang W J, et al. J Electrochem Soc. 2008;155:C178. [ Links ]
41. Fekry A M, Ameer M A. Int J Electrochem Sci. 2011;6:1342. [ Links ]
42. Baril G, Galicia G, Deslouis C, et al. J Electrochem Soc. 2007;154:C108. [ Links ]
43. Song G, Atrens A, John D S, et al. Corros Sci. 1997;39:1981. [ Links ]
44. Pinto R, Ferreira M G S, Carmezim M J, et al. Electrochim Acta. 2011;56:1535. [ Links ]
45. Wang L, Zhang B P, Shinohara T. Mater Design. 2010;31:857. [ Links ]
46. Wang N, Wang R, Peng C, et al. T Nonferr Metals Soc. 2010;20:1936. [ Links ]
Acknowledgements
This work was supported financially by the CNRST through the competence Pole PECCA. The authors also would like to thank W. Dietzel and N. Hort and their team at the Institute of Materials Research, Max-Planck-Str. 1, D-21502 Geesthacht, Germany, for providing the Mg alloys and also M. Es-Souni and S. Habouti at the Institute for Materials & Surface Technology (IMST) HAW Kiel-University of Applied Sciences, Grenztrasse 3, D-24149 Kiel, Germany, for performing the XRD, SEM and EDS analyses.
*Corresponding author. E-mail address: hamdani.mohamed@gmail.com
Received 13 January 2015; accepted 10 July 2015

