


Serviços Personalizados
Journal
Artigo
 Inglês (pdf)
 Artigo em XML
 Referências do artigo
 Enviar este artigo por email
Indicadores
-
 Citado por SciELO
 -
 Acessos
Links relacionados
-
 Similares em
SciELO
Similares em
SciELO
Compartilhar

 Permalink
Portugaliae Electrochimica Acta
versão impressa ISSN 0872-1904
Port. Electrochim. Acta vol.33 no.1 Coimbra jan. 2015
https://doi.org/10.4152/pea.201501035
Thermodynamic Characterization of Metal Dissolution and Adsorption of Polyvinyl Alcohol-Grafted Poly(Acrylamide-Vinyl Sulfonate) on Mild Steel in Hydrochloric Acid
R. Geethanjalia,* and S. Subhashinib
a Research Scholar, Department of Chemistry, Avinashilingam Institute for Home Science and Higher Education for Women, Coimbatore, India
b Department of Chemistry, Avinashilingam Institute for Home Science and Higher Education for Women, Coimbatore, India
Abstract
The corrosion inhibition of mild steel in hydrochloric acid by polyvinyl alcohol-gpoly( acrylamide-vinyl sulfonate) has been studied by weight loss and electrochemical methods (AC impedance and DC polarisation) techniques in the temperature range of 303 - 343 K. The inhibitor was found to provide an excellent efficiency of more than 90 %. Various adsorption isotherms have been employed for fitting the obtained results to confirm the mode of adsorption of the grafted terpolymer on mild steel. Thermodynamic parameters of adsorption such as equilibrium constant, Gibbs free energy, adsorption heat and adsorption entropy were evaluated and discussed. Various parameters that determine the kinetics of mild steel dissolution such as activation energy, enthalpy and entropy were also calculated. Results obtained from various techniques were comparable and suggest that the terpolymer follows chemical adsorption mode for inhibition.
Keywords: Acryalmide, Activation, Acryl terpolymer, Adsorption, AFM, enthalpy, entropy, free energy, PVA, HCl, Mild steel, Vinyl sulfonic acid.
Introduction
The severity of the corrosion process is determined decisively by the physical and chemical conditions that prevail at the interface of the metal. The use of less active metals for industrial equipment is not economically significant, and hence use of low cost active metals such as mild steel (MS) is preferred. But these metals when exposed to corrosive environments undergo different forms of corrosion. Corrosion of metals in acid accompanied with high temperatures is more aggressive, and hence quantitative understanding of the corrosion rate in such conditions would facilitate an accurate assessment of risk factors associated with it. Hydrochloric acid pickling is usually carried out at temperatures up to 60 °C and sulphuric acid pickling is carried out at temperatures up to 90 °C [1]. Use of organic compounds containing N, S and O as corrosion inhibitors is reducing due to concern about environmental protection from the global viewpoint. Hence the use of drugs, plant extracts, and natural and synthetic water soluble polymers is preferred for corrosion inhibition. Water soluble polymers are widely used owing to their low cost, availability, simple design and synthesis procedures and reduced toxicity. Polymers were found to be effective inhibitors because a single polymeric molecule can displace several water molecules from the metal surface thereby providing effective surface coverage area, and the presence of multiple adsorption sites makes desorption of inhibitors a slower process [2]. The idea of polymerizing/blending/compositing stems from the fact of introducing multiple adsorption sites or inculcate special functional groups that render properties like solubility, degradability, and processability. Recently, some grafted polymers were reported as corrosion inhibitor like water based acrylic terpolymer [3], PVA-based terpolymer [4], PVA-grafted amino acid [5,6] and so on. This paper focuses on the use of water soluble polymers as corrosion inhibitors for MS in hydrochloric acid medium. The water soluble polymer used for the present work is a grafted terpolymer having Polyvinyl alcohol (PVA) backbone grafted with poly(acrylamide-co-vinyl sulfonate) polymers. The terpolymer PVA-AAm-VSA is tailored such that it accommodates the necessary hetero atoms like N, S and O. The metal corrosion occurs through electrochemical reaction at metal/solution interface, and hence it is ideal to study the corrosion reactions by electrochemical experiments along with the conventional weight loss techniques. Moreover electrochemical experiments provide authentic results in a minimal period, and hence in this study, corrosion inhibition behaviour of the grafted terpolymer on mild steel in hydrochloric acid medium is also measured electrochemically at various temperatures ranging from 303 K-343 K. To date, the nature of adsorption films formed in the corrosion inhibition draws an aesthetic attention and consideration as it strongly supports the mechanism of inhibition. Confirming this assertion this paper presents a detailed study on adsorption and kinetic modelling through both weight loss and electrochemical techniques.
Experimental
Inhibitors
The terpolymer PVA-AAm-VSA was synthesized by free radical polymerization of the PVA and monomers acrylamide and vinyl sulfonic acid sodium salt in distilled water [4]. PVA (2.5 g; mol wt. 140 000), acrylamide (1 g), and vinyl sulfonic acid sodium salt (1.5 g) were dissolved in 80 mL of water. The whole reaction mixture was purged with nitrogen gas for half-an-hour. 10 mL of sodium dodecyl sulfonate solution (0.03 g) were mixed into the reaction solution. Then, 0.273 g of potassium persulfate were dissolved in 10 mL water and added as an oxidant initiator. The reaction was allowed to continue for 3 hours. Then the reaction mixture was added to five-fold volume of acetone to precipitate the product. The product was dried under vacuum for 24 hours and utilized for further studies. Total yield = 94 %.
Material preparation
The present studies were conducted by shearing the commercially available mild steel (MS) strips into 5 cm × 1 cm × 2 mm for immersion studies, and were cut into 1 cm2 coupons fixed to a brass rod for all electrochemical studies. The MS strips were found to have the following composition: C-0.106 %, Mn-0.196 %, P-0.027 %, Cr-0.022 %, S-0.016 %, Ni-0.012 %, Si-0.006 %, Mo-0.003 %, and remainder Fe. Analar grade hydrochloric acid (Merck) was used for preparation of corrosive medium.cWeight loss studies were conducted by immersing the MS strips in triplicates in 100 mL of 1 M HCl solution with and without various concentrations of the inhibitor (0.03-0.45 wt.%) at various temperatures (303-343 K) for ½ an hour. The strips were taken out and neutralized with NaHCO3. The samples were cleaned to remove corrosion products, dried, and reweighed. All the experiments were carried out based on ASTM G31 standard procedure.
Electrochemical measurement unit containing a Potentiostat/Galvanostat (model Solartron 1280 B) connected to a personal computer with the softwares Corrware and Zplot was used for electrochemical experiments. A saturated calomel electrode (SCE) and a platinum electrode were used as reference and counter electrode, respectively. The working electrode was polished with different grades of emery paper, rinsed with distilled water, dried and then immediately inserted into the glass cell that contained 100 mL of electrolyte solution. The electrode was kept immersed for 15 minutes in 1 M HCl before starting the measurement to attain steady state. Polarization studies were carried out from anodic potential of -0.1 V to cathodic potential of -1 V with respect to the corrosion potential at a sweep rate of 2 mV/s. The corrosion current densities (Icorr) were determined from the intersection point of cathodic and anodic Tafel lines.
Electrochemical impedance measurements were carried out using AC amplitude of 10 mV at frequency sweep from 20 kHz to 0.1 Hz. The data were collected by using Z plot software and interpreted with Z view software. The Stern-Geary equation for kinetics is used to determine the best-fit value of ba, bc, Ecorr and Icorr. All the experiments were conducted at 303 K-343 K at aerated atmosphere.
Surface analysis
Mild steel strips were immersed in inhibited (0.45 wt.% inhibitor) and uninhibited solution for 6 hours. Then the specimens were cleaned with distilled water, dried, and analysed by AFM instrument (A.P.E research, model A100, Italy).
Results
Effect of temperature-weight loss method
The effect of temperature on the inhibited acid-metal is highly complex because many changes that occur on the metal surface such as rapid etching, adsorption/desorption of inhibitor, and inhibitor may itself undergo decomposition or rearrangement. Fig. 1 shows the trend in inhibition efficiency of PVA-AAm-VSA on mild steel against inhibitor concentration in 1 M HCl at 303 K-343 K respectively.
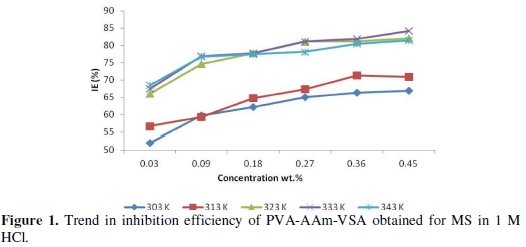
This figure reveals that the IE gradually increased in the temperature domain range of 303-333 K (68 % to 85 % for 0.45 wt.% of inhibitor) and then slightly decreases at 343 K. This fact can be explained on the basis of structural orientation (Fig. 2) according to Fares et al. [7] and Chamovska et al. [8].
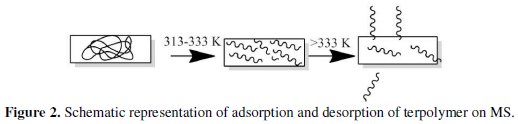
At lower temperatures coiled structure of the polymer chains covers the surface and prevents the metal dissolution. But at temperatures from 313-333 K, the long chains of the coiled structure could have broken into small segments but still providing better efficiency. At temperatures greater than 333 K, the short chains could have started desorbing from the metal surface and consequently IE starts decreasing, because increase in temperature stimulates the kinetic energy of the metal surface which adversely affects the adsorption process. Hence the adsorption-desorption equilibrium is shifted more towards the desorption process [2] and the electrode surface is more roughened owing to the enhanced corrosion.
Effect of temperature-potentiodynamic polarisation method
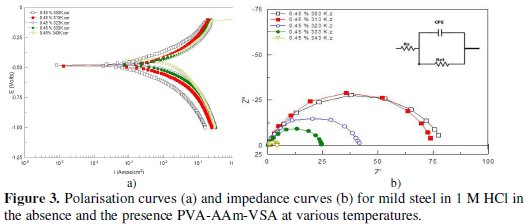
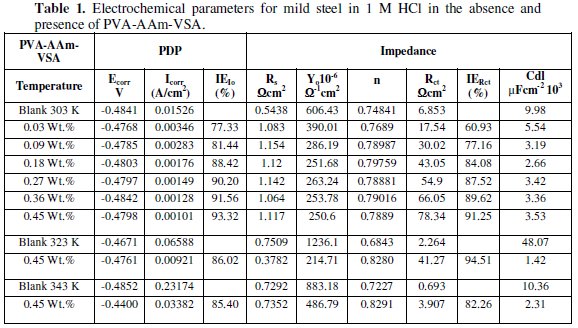
Fig. 3a shows the polarisation curves obtained for optimum concentration of PVA-AAm-VSA at 303 K - 343 K and the corresponding electrochemical parameters such as corrosion potential (Ecorr), corrosion current (Icorr) and inhibitor efficiency IEIcorr are given in Table 1.
The inhibition efficiency of terpolymer is calculated by using corrosion current density using the following formula:

where I0corr and Icorr are the corrosion current density obtained for uninhibited solution and inhibited solution, respectively. The polarisation plot shows that PVA-AAm-VSA suppressed both metal dissolution (anodic) and hydrogen evolution (cathodic) reaction, indicating the mixed type of inhibition. Moreover, the Tafel lines are parallel in nature suggesting the activation-controlled type hydrogen evolution reaction [9]. The displacement in the Ecorr values is less than 85 mV which is an indication of mixed type inhibitory action of the inhibitors. Also the Ecorr values shifts to positive direction which is an indication that inhibitor molecules are more adsorbed on the anodic sites, resulting in an inhibition of the anodic reactions [10]. Inspection of Table 1 reveals that there is a definite decrease in corrosion current with the addition of inhibitor. This shows the decrease in anodic current density with increase in inhibitor concentration, as the inhibitor addition obstructs the sites responsible for corrosion [11,12]. Increase in the inhibition efficiency with respect to temperature is due to the increased adsorption of inhibitor on the metal surface, and decrease in inhibition efficiency at higher temperatures is due to the detachment of the inhibitor film formed on the metal surface [12].
Effect of temperature-AC impedance method
EIS results are more reliable because the measurements were done close to the corrosion potential and it is considered as non-destructive test due to the small magnitude of the applied potential, i.e. 5 mV. This small perturbation of the corrosion potential minimizes the surface modification and errors associated with large deviations from the electrochemical equilibrium [13]. Solution resistance (Rs), charge transfer resistance (Rct) and double layer capacitance (Cdl) were determined from EIS and they are listed in Table 1. The IE was determined using the charge transfer resistance values through the following equation:

where R0ct and Rct are the electrochemical parameters obtained for uninhibited solution and inhibited solution, respectively.
Fig. 3b is the Nyquist representation for corrosion of MS in the presence and absence of PVA-AAm-VSA at various temperatures. The impedance obtained at 303 K and 313 K was larger and then the size gradually decreased with increase in temperature. This fact can be attributed to the better adsorption ability of the inhibitor initially at lower temperatures. With increase in temperature the adsorbed film started desorbing leading to decrease in impedance size. The Nyquist plot appears as single capacitive semicircles with their center depressed onto the real axis [14,15] being this effect named as dispersing effect [16]. Hence the circuit (Fig. 3b inset) used for fitting the data should be expressed in terms of a constant phase element (CPE), because the use of CPE is generally required due to the distribution of relaxation time as a result of the inhomogeneity, roughness, adsorption or diffusion at micro and nano level of the metal surface [17]. CPE is defined as

where ZCPE is impedance of CPE; Y0 is a proportional factor, ω is the angular frequency (in rad/s), j2 = -1 is the imaginary number and n is the CPE exponent.
Double layer capacitance associated with the CPE element is calculated from Rct using the following formula:

where n can be related to non-uniform current distribution, distribution of reaction rates and roughness of electrode surface. The values of n can differentiate the type of the circuit element involved. When n=0, Y0=Resistance; n=1;Y0=Capacitance; n=-1;Y0=Inductance; n=0.5;Y0=Warburg impedance [18]. However, when n is a medium value between them, it may indicate a relative and integrated influence by the above factors, no longer a simple resistance, capacitance or diffusive element [19].
The charge transfer resistance values increase with increase in inhibitor concentration which can be a result of slower corroding system [20]. At the same time Y0 decreased indicating that increasing the inhibitor concentration decreased the corrosion rate. The decrease in Cdl values occurs as a result of reduction of local dielectric constant and/or by increase in the thickness of the electrical double layer [21]. This can be related to the fact of adsorption of the inhibitor molecules at the metal/solution interface. In other words, decrease in Cdl values with increasing inhibitor concentration ensures surface coverage of the metal by inhibitor film. The obtained n values are in the range of 0.5 ≤ n ≤ 1, which is again an evidence for the surface roughness and other parameters [22]. The IE values calculated from the Rct values show that the concentration of the inhibitor has a positive influence on IE and the temperature has a negative influence on the IE. The aforementioned fact is tenable to the adsorption and desorption of inhibitors, respectively.
Adsorption considerations
Thermodynamic adsorption parameters
In order to gain a detailed insight on inhibition of mild steel corrosion by the inhibitor molecules, various adsorption isotherms were designed as they provide information about molecular interactions between the inhibitor molecules and active sites of the metal [20]. The surface coverage θ is calculated from the inhibition efficiency acquired from weight loss (IEWL) and electrochemical studies (IEIcorr and IERct). An attempt was made to fit the surface coverage values onto various isotherms, namely Langmuir, Temkin, El-Awady, Freundlich, Flory-Huggins, Frumkin and Bockris-Swinkles. The data were found to be well fitted in the Temkin isotherm with regression values close to unity and the Temkin adsorption isotherm equation is represented as [23,24]

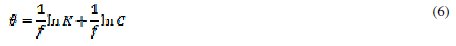
where 'a' is called the molecular interaction parameter, which can be negative or positive, θ is the surface coverage, K is the adsorption equilibrium constant and C is the concentration of the inhibitor in wt.%. Positive values of 'a' relate to the attractive forces and negative values of 'a' relate to the repulsive forces that exist between adsorbed inhibitor molecules. When -2a is represented as 'f' which describes the heterogeneity that prevail between the molecular interactions in the adsorption layer and the heterogeneity of the metal surface, Temkin equation can be represented in the transformed form as shown here.
A plot of θ vs. ln C (Fig. 4) gave straight lines with regression values almost equal to unity.
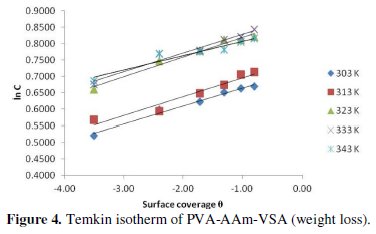
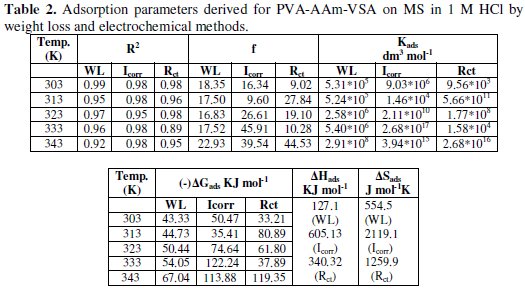
The parameters including 'f' and 'K' were calculated from the slope and intercept, respectively, and are presented in Table 2.
The validity of Temkin's isotherm is basically an evidence for the chemisorptive nature of adsorption. Since the obtained f values are greater than 0, it can be assumed that the adsorbed inhibitor molecules suffer repulsive forces among themselves [24, 25]. As far as the adsorptive equilibrium constant is concerned, they tend to increase with increasing temperature, which supports the stronger adsorption leading to chemisorption. The thermodynamic free energy of adsorption can be calculated using the following equation using the deduced K values

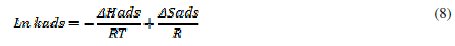
where CH2O is the molar concentration of water expressed in g/L, R is the molar gas constant J/mol/K and T is the temperature in K. From the plot of ln Kads vs. 1/T, the adsorption enthalpy ΔHads and adsorption entropy ΔSads can be calculated from the slope and intercept, respectively, using the Vant Hoff's equation [9, 26]
Also the increase in K values indicates the strength of the adsorption between inhibitor molecules and metal. In this study, K values increase proportionally with temperature which is attributable to the effective adsorption of the inhibitor [24-28].
Generally, free energy values of 20 kJ mol-1 or less are correlated to the physisorption that occur through electrostatic interaction between charged molecules and charged metal surface; the free energy values of more than 40 kJ mol-1 or more are related to the chemisorption that involves charge sharing or transfer from the inhibitor molecules to the metal surface to form a coordinate covalent bond [29-31]. In the present study, the negative values of ΔG indicate the spontaneity of the adsorption process and the magnitude of ΔG values was found to be more than 40 kJ mol-1 as obtained for weight loss studies, and can be attributed to chemical adsorption of the terpolymeric inhibitor. The magnitude of ΔG values obtained from electrochemical measurements was in the range of 50 - 120 kJ mol-1 which also shows the strong chemisorption of the inhibitor. Moreover the ΔG values increase with increasing temperature, which is due to the fact of strong chemisorption at higher temperatures.
The positive values of ΔH for PVA-AAm-VSA can be related to the fact of endothermic adsorption. As a contrary to the observations from the literature, positive values of ΔH are associated with the positive entropy. This may be pertained to the following reason: polymers are generally larger molecules, and the terpolymer under investigation is a bigger macromolecule with hetero atoms like N, S and O. Hence, before getting adsorbed onto the metal surface, the macromolecule has to orient itself in the solution state to extend the bonding with the metal surface. This process requires some energy which could overly the exothermic energy of ions that tend to attach to the surface. However, the total enthalpy of the system is an algebraic sum of adsorption enthalpy and desorption enthalpy. Hence, desorption of water molecules becomes implicitly an endothermic process resulting a positive enthalpy for the whole system. The positive entropy is explained by Singh and Quraishi [32] and Wang et al. [33] as follows: Adsorption of inhibitors from the aqueous solution is considered as quasi-substitution process between the organic compound in the aqueous phase and water molecules at the mild steel surface. The adsorption of inhibitors on metal surface takes place at the cost of desorption of water molecules. The total entropy is calculated as algebraic sum of adsorption of organic inhibitor molecules and desorption of water molecules. So the gain in entropy is related with the solvent entropy. That is from the solvent side, the disorderliness increases resulting in increased entropy.
Thermodynamic activation parameters
The effect of temperature on the inhibited-acid metal is highly complex, because many changes occur on the metal surface such as rapid etching, desorption of inhibitor or the inhibitor itself may undergo decomposition [34]. The thermodynamic parameters for dissolution of mild steel were calculated using the change in corrosion rate values obtained from the electrochemical (Icorr from polarisation and Icorr from impedance) values at 303-343 K and are depicted in Table 3.
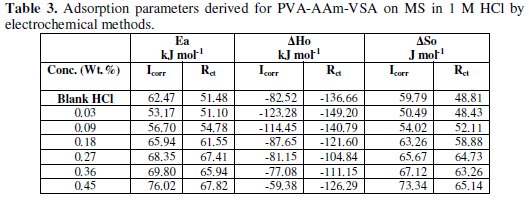
Activation energy (Ea) value for mild steel dissolution was calculated from the slope of Arrhenius plot (log Icorr vs. 1/T: Fig. 5a and 5b) using the following equation.

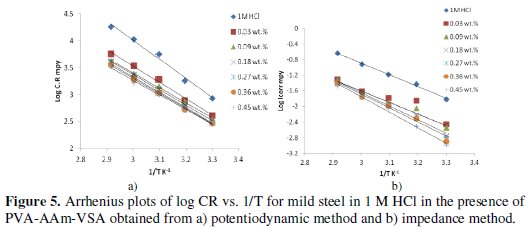
where R is the general gas constant expressed in J/K/mol, T is the absolute temperature in K and λ is the Arrhenius pre-exponential factor. CR is the rate of metal dissolution which is directly related to corrosion current density (Icorr) and hence Icorr is used for calculations.
Icorr is calculated from Rct using the following formula [21]:

where R is the general gas constant expressed in J/K/mol, T is the absolute temperature, and Rct is the charge transfer resistance. The calculated values for the activation energy for blank HCl are found to be around 62 and 50 kJ mol-1 from electrochemical method which is consistent with the values reported in literatures, i.e., 50 - 100 kJ mol-1[35].
The values of Ea are higher than that of the blank and increase with increase in concentration. This is tenable to the fact of increase in the energy barrier of the corrosion reaction occurring at the steel surface. Also the change in the Ea values is considered as a change in corrosion mechanism when the inhibitor molecules are adsorbed on the surface [36].
The transition state plot of log Icorr/T vs. 1/T (Fig. 6a and 6b) was constructed to find out the enthalpy of activation ΔH0 from the slope (-ΔH0/R) and ΔS0 from the intercept ([ln (R/Nh)R(ΔS0/R)]), using the following equation:

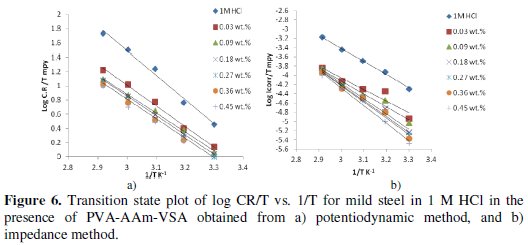
where h is the Planck's constant, N is the Avogadro's number, R is the general gas constant expressed in J/K/mol. The values ΔH in the presence of inhibitors are larger than in absence of inhibitor.
Positive values of ΔHo reflect the endothermic nature of the metal dissolution process, which is attributed to the slower dissolution of mild steel in the presence of the inhibitor than in the absence. Large negative values of ΔSo are observed for both the inhibited and uninhibited solution, however the values obtained for the blank are more positive which depicts the increased disorderliness during metal dissolution. For inhibited solution, the disorderliness decreases in terms of more negative values of entropy. This suggests that the activated complex in the rate determining step is mainly association rather than dissociation [37], more precisely decreases in disorderliness while proceeding to the activated complex formation [38]. This also suggests that the inhibition process is primarily enthalpy controlled [39].
Atomic force microscopic investigation
Morphological analysis of the surfaces of the mild steel were carried out by AFM in the range 0 to 50 μm at room temperature after immersion in different test solutions for 6 h. Three-dimensional AFM images of mild steel, mild steel immersed in 1 M HCl and mild steel immersed in 1 M HCl containing PVAAAm- VSA are shown in Fig. 7.
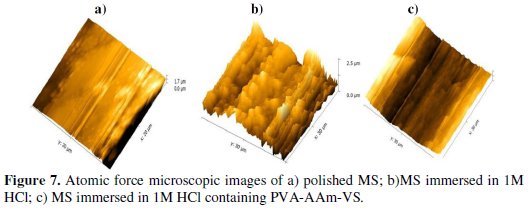
The roughness parameter (Ra) and root mean square roughness (Rms) were calculated using the software called Gwyddion.
Nano to micro scale level has emerged as contemporary choice for investigating the influence of inhibitors on the metal surface [40]. The integrity and persistence of inhibitor films formed on the metal surface is of paramount importance in the corrosion inhibition studies. The AFM technique reveals the extent of inhibitor film adsorption on the MS surface in terms of calculating the roughness parameter and through 3D images of the surface. The roughness parameter given in the table has the following order:
Polished MS < PVA-AAm-VSA < Corroded MS
In the absence of the inhibitors, the surface of the film shows several mountain like formations that correspond to rough surface [41].The Ra and Rms corresponding to the MS corroded in blank HCl are 0.567 μm and 0.693 μm, which are very higher than the roughness parameters obtained for inhibited surfaces. However this roughness is reduced to 0.313 μm and 0.401 μm in the presence of the inhibitor which shows the protected surface of the mild steel by the terpolymeric inhibitor.
Conclusion
The following results can be drawn from this study: PVA-AAm-VSA was found to provide higher inhibition efficiency of 83 % at 333 K from weight loss studies. In the electrochemical process, the inhibitor was found to affect both the anodic and cathodic processes. The surface coverage values derived from both the techniques were found to follow Temkin isotherm model. The calculated thermodynamic parameters of adsorption confirmed the chemical nature of adsorption of the inhibitor. The temperature dependency of the corrosion process was altered by the inhibitor addition. The activation energy of the inhibited solution was found to be greater than the blank HCl. Thermodynamic and adsorption characterization by weight loss, DC polarisation and AC impedance were found to be in good agreement.
References
1. Schmitt G. Br Corros J. 1984;19:165. [ Links ]
2. Umoren S, Li Y, Wang F. Corros Sci. 2010;52:1777. [ Links ]
3. Azghandi M V, Davoodi A, Farzi G A, et al. Corros Sci. 2012;64:44. [ Links ]
4. Geethanjali R, Subhashini S. Res J Rec Sci. 2014;3:170. [ Links ]
5. Subhashini S, Sabirneeza A A F. Proceedings of the World Congress on Engineering and Computer Science. 2011;II:19. [ Links ]
6. Sabirneeza A A F, Subhashini S, Rajalakshmi R. Mater Corros. 2011:1. [ Links ]
7. Fares M M, Maayta A K, Al-qudah M M. Corros Sci. 2012;60:112. [ Links ]
8. Chamovska D, Cvetkovska M, Grchev T. J Serb Chem Soc. 2007;72:687. [ Links ]
9. Bentiss F, Traisnel M, Lagrenee M. J Appl Surf Sci. 1999:237. [ Links ]
10. Mistry B M, Jauhari S. Chem Eng Comm. 2014:37. [ Links ]
11. Rehim S S A, Hazzazi O A, Amin M A, et al. Corros Sci. 2008;50:2258. [ Links ]
12. Olivares-Xometl O, Likhanova N V, Dominguez-Aguilar M A, et al. Mater Chem Phys. 2008;110:344. [ Links ]
13. Orazem M E, Tribollet B. Electrochemical impedance spectroscopy. Hoboken: John Wiley & Sons; 2008. [ Links ]
14. Popova A, Raicheva S, Sokolova E, et al. Langmuir. 1996;12:2083. [ Links ]
15. Lebrini M, Lagrenee M, Vezin H, et al. Corros Sci. 2007;49:2254. [ Links ]
16. MacCafferty E. Corros Sci. 1997;39:243. [ Links ]
17. Navvaro-Flores E, Chong Z, Omanovic S. J Mol Catal A: Chem. 2005;226:179. [ Links ]
18. Oldham K B. Electrochem Comm. 2004;6:210. [ Links ]
19. Lu Y, Wang W, Xu H, et al. Corros Sci. 2010;52:780. [ Links ]
20. Khaled K F. Electrochim Acta, 2003;48:2493. [ Links ]
21. Soltani N, Tavakkoli N, Khayatkashani M, et al. Corros Sci. 2012;62:122. [ Links ]
22. Benedeti A V, Sumodjo P T A, Nobe K, et al. Electrochim Acta. 1995;40:2657. [ Links ]
23. Abd El Rehim S S, Ibrahim M A M, Khalid K F. Mater Chem Phys. 2001;70:268. [ Links ]
24. Li X, Deng S, Fu H, et al. Corros Sci. 2008;50:3599. [ Links ]
25. Ali SA, El-Shareef A M, Al-Ghamdi R F, et al. Corros Sci. 2005;47:2659. [ Links ]
26. Durnie W, Marco R D, Jefferson A, et al. J Electrochem Soc. 1999;146:1751. [ Links ]
27. Stoyanova A E, Sokolova E I, Baicheva S N. Corros Sci. 1997;39:1595. [ Links ]
28. Amin M A, Abd El Rehim S S, Abdel-Fatah H T M. Corros Sci. 2009;51:882. [ Links ]
29. Donahue F M, Nobe K. J Electrochem Soc. 1965;112:886. [ Links ]
30. Kamis E, Bellucci F, Latanision R M, et al. Corrosion. 1991;47:677. [ Links ]
31. Solmaz R, Kardas G, Culha M, et al. Electrochim Acta. 2008:53. [ Links ]
32. Singh A K, Quraishi M A. Mater Chem Phys. 2010;123:666. [ Links ]
33. Wang X, Yang H, Wang F. Corros Sci. 2010;52:1268. [ Links ]
34. Riggs O, Hurd I R, Ray M. Corrosion 1967;23:252. [ Links ]
35. Negm N A, Elkholy Y M, Zahran M K, et al. Corros Sci. 2010;52:3523. [ Links ]
36. Ali S A, El-Shareef A M, Al-Ghamdi R F, et al. Corros Sci. 2005;47:2659. [ Links ]
37. Abdallah M. Corros Sci. 2003;45:2705. [ Links ]
38. Hamed E. Mater Chem Phys. 2010;121:70. [ Links ]
39. Ashassi-Sorkhabi H, Ghasemi Z, Seifzadeh D. Appl Surf Sci. 2005;249:408. [ Links ]
40. Xianghong L, Guannan M. Appl Surf Sci. 2005;252:1254. [ Links ]
41. Quraishi M A, Shukla S K. Mater Chem Phys. 2009;113:685. [ Links ]
Acknowledgement
One of the authors, R.Geethanjali thanks Tamil Nadu State Council for Science and Technology for catalysing and financially supporting the research work under RFRS scheme.
*Corresponding author. E-mail address: anjalirajj@gmail.com
Received 8 February 2015; accepted 23 February 2015

