


Serviços Personalizados
Journal
Artigo
 Inglês (pdf)
 Artigo em XML
 Referências do artigo
 Enviar este artigo por email
Indicadores
-
 Citado por SciELO
 -
 Acessos
Links relacionados
-
 Similares em
SciELO
Similares em
SciELO
Compartilhar

 Permalink
Portugaliae Electrochimica Acta
versão impressa ISSN 0872-1904
Port. Electrochim. Acta vol.32 no.2 Coimbra mar. 2014
https://doi.org/10.4152/pea.201402157
Cashew Nut Testa Tannin: Assessing its Effects on the Corrosion of Aluminium in HCl
Nnaemeka J. N. Nnajia,* , Nelson O. Obi-Egbedib and Chukwuma O. B. Okoyec
a Department of Chemistry/Biochemistry/Molecular Biology, Federal University Ndufu Alaike Ikwo, Ebonyi State-Nigeria
b Department of Chemistry, University of Ibadan, Oyo State-Nigeria
c Department of Pure and Industrial Chemistry, University of Nigeria, Nsukka, Enugu State-Nigeria
Abstract
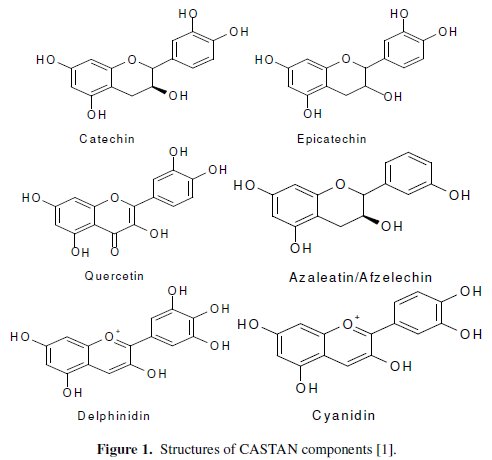
Cashew nut testa tannin [CASTAN] has been found to inhibit the corrosion of aluminium in hydrochloric acid solutions using gravimetric, thermometric and UV/visible spectrophotometric techniques. CASTAN inhibition was by adsorption on aluminium following Temkin isotherm in 0.1 M HCl and Langmuir isotherm in 0.5 M and 2.0 M HCl at 303 Kelvin. Physical adsorption on aluminium has been proposed in studied HCl solutions; therefore, CASTAN is a cathodic inhibitor. Earlier reports [1] showed CASTAN to contain quercetin, azaleatin, catechin, epicatechin, cyanidin and delphinidin. However, UV/visible spectrophotometric analysis of CASTAN in ethanol reveals quercetin as its major component. This work therefore investigated the correlation between computed molecular parameters and inhibitive properties of CASTAN and adsorption sites on its components. Calculated quantum chemical parameters namely: EHOMO (highest occupied molecular orbital energy), ELUMO (lowest unoccupied molecular orbital energy), energy gap (ΔE) and dipole moment ( μ ) suggest that CASTAN is a soft inhibitor and it's components inhibited aluminium corrosion in protonated forms. Calculated Mulliken charges implicated some electron rich sites, namely: the aromatic and conjugated C=C, C=O and O-H as adsorption sites on the inhibitor molecules. Proposed kinetic model reveals complex reaction mechanism, parallel reactions, for aluminium corrosion inhibition by CASTAN.
Keywords: cashew nut testa; cathodic and soft inhibitor; corrosion inhibition; quantum chemical calculations; parallel reactions; Nnaji's inhibition constant.
Introduction
Electrochemistry can be described as a branch of chemistry concerned with the properties and interactions of electron transfers involved in chemical processes. A typical electrochemical process is one which involves the interaction of a metal, like aluminium, with its environment. This interaction causes the interacting (reacting) aluminium to deteriorate such that its chemical composition and properties change. This deterioration is known as corrosion [2].
But for some types of high temperature corrosion, all forms of corrosion occur by electrochemical processes [2]. An example is the dissolution of aluminium in hydrochloric acid which normally dissolves and corrodes away [2, 3].
In industries, aluminum has found wide usage particularly in a variety of aggressive and corrosion service environment [4]. Somehow, aluminium resists corrosion in these aggressive environments by the formation of a compact and strongly adherent film majorly composed of Al2O3, Al(OH)3 and AlO.OH on the surface [5, 6]. Regrettably, continued exposure of aluminium to these aggressive and corrosive environments causes the protection of aluminium by this thin film to fail. The failure of this film to protect aluminium has been attributed to the presence and concentrations of anions like Cl- [6, 7].
A practical, efficient and effective method of improving the longevity of aluminium after the failure of the formed thin film to protect it from corroding is by the use of corrosion inhibitor [8]. The mechanism of protecting aluminium in aggressive and corrosive environments has been reported to be by adsorption of corrosion inhibitors on the surface of aluminium [6, 8-10]. Works [4-6, 8, 9, 11] have shown that natural products derivable from agricultural byproducts inhibit aluminium corrosion. In fact, tannins have been demonstrated [12] to be good replacements for standard corrosion inhibitors. The major reasons are that unlike these standard corrosion inhibitors, tannins (as natural products) are environmentally friendly, easily available and cheap alternative corrosion inhibitors.
In the eastern parts of Nigeria, cashew trees abound and so are the nuts. The testa of the nuts, an outer covering of the cashew nuts (usually consisting disposal problems), are known to contain flavanoids [1]. As shown in Fig. 1, contained flavanoids possess electron rich centers known to inhibit metal corrosion [4, 6, 8, 10] namely: aromatic C=C, C=O and O-H. Electron rich sites possessed by CASTAN components, known to inhibit metal corrosion, led to its use in this study.
To understand the mechanisms by which corrosion inhibitors adsorb on aluminium, adsorption isotherms have been used. Commonest amongst these adsorption isotherms are: Langmuir, Freundlich, Temkin and El-Awady isotherms [6, 9-11, 13-15]. To ensure that the appropriate adsorption model was chosen, the chi-square (χ2) statistic has been used to analyze how well the tested adsorption models (Langmuir, Freundlich, Temkin and El-Awady) fit experimental data.
Determination of molecular structures and unraveling the correlations between molecular structures and reactivity have become possible using quantum chemical methods [14]. Routinely therefore, quantum chemical calculations have found extensive usage in corrosion inhibition studies. Recently, quantum chemical approach has been used to predict electron rich centers/sites of molecules which on adsorption onto metal surfaces, help to decrease the rate of metal corrosion in aggressive environments [14, 15]. As such, sites containing π-electrons and lone pair of electrons on double and triple bonds, and heteroatoms (nitrogen, oxygen and sulphur) respectively, have been implicated. This work therefore presents and demonstrates a good understanding of aluminium corrosion inhibition in hydrochloric acid solutions by CASTAN. This was achieved using statistical tools (χ2, analysis of variance (ANOVA) and regression) to analyze obtained experimental data. In addition, this present effort proposes a new mechanism for the kinetics of corrosion inhibition of aluminium in hydrochloric acid solutions.
Theory
The dissolution of aluminium in hydrochloric acid can be represented by the following reaction

This aluminium dissolution, represented by eq. (1), can be described by anodic and cathodic controlled reactions respectively represented by eq. (2) and (3)


The presence of Cl- ions (from HCl), increases the rate at which aluminium corrodes [6, 7, 16] causing the combination of Cl- ions with Al (III) ions to form aluminium chloride, as shown below

This process represented by eq. (4), releases electrons which cause H+ ions to be chemically reduced to hydrogen gas, as shown in eq. (3).
There are sacrificial substances known as corrosion inhibitors, which retard the rate at which aluminium corrodes by decreasing the rate(s) at which the anodic and/or cathodic controlled reactions of eq. (2) and (3) occur [4, 6, 15, 17-19].
Frontier orbital theory suggests that corrosion inhibitors retard metal corrosion effectively if electrons can easily be released (and quantitatively too) by the inhibitors, from their highest occupied molecular orbitals (HOMOs) [20, 21]. It is believed that these HOMOs are possessed by rich electron sites on the inhibitors such as: unsaturation (aromatic centers, C=C, C=O, N=O and the likes) and heteroatoms (oxygen, nitrogen, sulphur and the likes) [4, 6, 15, 17-19]. Inhibitors are believed to protonate in aqueous solutions [22], therefore, it follows that these inhibitors polarize and have their dipole moment values increased. This is true considering that the dipole moment has a relationship with (orientation) polarization (Po) as shown below [23]

where μ is (permanent) the dipole moment, N is Avogadro's number, k is Boltzmann's constant and T is temperature in Kelvin. Eq. (5) suggests that orientation polarization of a molecule is proportional to the square of its dipole moment. That is

But the product of (electronic) charge quantity (q) and charge separation (r) gives dipole moment, for a linear molecule, whose vector quantity property allows the determination of the dipole moment for a polyatomic molecule by vector addition [23]. It follows therefore that high dipole moments imply the ease at which molecules can (be) polarize (d) and high electronic charges possessed. The frontier orbital theory and the dipole moment confer on the polyatomic inhibitor molecule excess negative charges distributed around them, allowing polarizability, better coverage and adsorption. Therefore, inhibitor molecules with different electronegative elements will have increased surface coverage effects on aluminium surface due to large dipole moments. Also, required drifts of electrons from the inhibitor to the electrochemical aluminium corrosion process will contribute effectively to retarding the rate at which the corrosion process occurs.
Materials and methods
Extraction and characterization of CASTAN
Cashew nut testa used was collected from a local market near Nsukka and air dried. The air dried cashew nut testa was ground to powder, extracted with 70% aqueous acetone and filtered using Buckner funnel and vacuum pump. Obtained dark filtrate was air dried to give a light brown solid-CASTAN. Infrared spectrum of CASTAN was obtained on a Shimadzu FTIR-8400S infrared spectrophotometer using potassium bromide of spectroscopic grade at the Analytical Unit of NARICT, Zaria, in Kaduna State of Nigeria. UV-Visible spectrum of CASTAN was obtained using JENWAY 6405 spectrophotometer inter-phased with a computer.
Materials
Pure aluminum sheet of type AA 1060 (0.042 cm guage) was purchased from EAST CHASE and TOTS Aluminium Nigeria limited, Ohodo in Enugu State. Each sheet was mechanically press cut into 4 cm × 5 cm coupons. The specimen were used as supplied without further polishing, but were degreased in absolute ethanol, dried in acetone, weighed and stored in a moisture free desiccator prior to use in corrosion studies. The concentrations of CASTAN prepared and used in the study were 0.1-0.5 g/L. Acetone and concentrated HCl were of BDH-AnalaR grades purchased from BHD, Poole, England. Distilled was prepared at the National Centre for Equipment Maintenance and Development (NCEMD), University of Nigeria, Nsukka, Enugu State.
Methods
Gravimetric measurements
Clean weighed aluminium coupons were immersed completely in twelve 250 mL beakers containing 100 mL corrodent and various concentrations of inhibitors. The beakers were placed in a thermostated oven maintained at 30 °C, 40 °C, and 50 °C, respectively, at different times. The coupons were retrieved at 1 hour, 2 hours, 3 hours and 5 hours interval progressively for 11 hours, scrubbed with bristle brush in distilled water at room temperature, dried in acetone and weighed. The differences in weight of the coupons were taken as the weight loss, which was used to compute the corrosion rate given by [15, 16]:

where J1 and J2 are the masses of the specimen before and after corrosion, respectively, A is the total area of the specimen and t is the corrosion time. The inhibition efficiencies (%I) of inhibitors, inhibitors and KI solution mixtures were calculated using [15, 16]:
where C0 and C1 are the corrosion rates for aluminum in the absence and presence of inhibitor, respectively, in HCl solution at the same temperature. The degree of surface coverage (θ), is given by the equation [15, 16]:

Thermometric measurements
All experiments were initially carried out at room temperature (30 ± 1 °C). The variations in temperature with time as aluminum dissolves in 2 M HCl were monitored at two minutes intervals with inhibitor (0.1 - 0.5 w/v %) and without inhibitor using mercury in glass thermometer (0-100 °C) to the nearest ± 0.05 °C.
This method allowed for the evaluation of the reaction number (RN), defined as

where Tm and Ti are maximum and initial temperatures of the system, respectively, and t is the time taken to reach the maximum temperature.
The inhibition efficiency (%I) was evaluated from percentage reduction in the reaction number, thus [15]:
where RNaq is the reaction number in the absence of inhibitors and RNin is the reaction number in the presence of inhibitor. The degree of surface coverage (θ) is given by eq. (12) [15]:
Quantum chemical calculation
Full geometry optimization of the inhibitor (CASTAN) was carried out using density functional theory (DFT). B3LYP, a version of the DFT method that uses Becke's three-parameter (B3) functional and includes a mixture of HF with DFT exchange terms associated with the gradient corrected correlation functional of Lee, Yang, and Parr (LYP) was used for the quantum chemical calculations [22, 24] . Full geometry optimization of the inhibitor was carried out at the B3LYP using 6-31G* basis set level incorporated in the Spartan '06 V112 program package. A number of quantum molecular properties for CASTAN components (neutral and protonated) in aqueous media, such as Mulliken charges on atoms, EHOMO, ELUMO, energy gap (ΔE) and dipole moment, were determined.
Statistical analysis
In a situation where there are K groups (K ≥ 2), the ANOVA technique becomes appropriate and maintains the type one error rate at the pre-established alpha level [13, 14].
Experimental and calculated values of θ were compared using chi-square statistic according to the following [25]:
where θexp and θcal are experimental and theoretical/calculated surface coverage values, respectively, and χ2 is chi-square statistic.
The effects of three factors, namely: (i) temperature, (ii) HCl concentration, and (iii) inhibitor (CASTAN) concentration on inhibition efficiency were investigated and the data were statistically analysed using SPSS version 16. A simple linear regression, with one independent variable, was performed to determine how much theoretical/calculated surface coverage (θcal) values (from chosen adsorption isotherm models) account/predict experimentally obtained surface coverage (θexp) values.
Results and discussions
FTIR and UV/visible spectrophotometric measurements
The IR signals/frequencies of the aqueous acetone extract of cashew nut testa are shown in our previous work [26]. Two absorption bands appear around 3435 cm-1 corresponding to O-H absorptions. Signals around 3435 cm-1 and 3213 cm-1 and 3213 cm-1 that are most likely due to vibrations of O-H. The assignments were because these absorptions have absorbance values of about 0.602 are also due to NH2 stretching of primary amines and/or proteins. Vibration seen at 1616 cm-1 has been attributed to C=O. Aromatic vibrations show signals at 1522 cm-1 and 1452 cm-1. Absorption signal at 1359 cm-1 is due to the presence of condensed tannins. A signal which corresponds to C-C appears around 1230 cm-1. Signals which appear at 1125 cmand 1044 cmsuggest the presence of C-O (stretching) absorptions. Broad absorption signals which centered around 813 cm-1 and 643 cm-1 indicate the presence of substituted aromatic rings. These assignments are consistent with those found in literature [1, 27, 28].
Fig. 2 presents the UV/visible spectrum of CASTAN in ethanol.
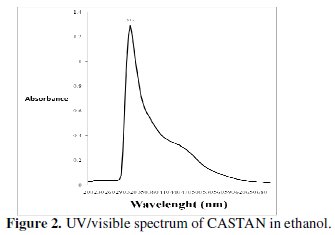
UV/visible spectroscopy has been found useful in the identification of the nature of vegetable tannins [29]. Therefore, the UV/visible spectrum of CASTAN in ethanol shows a 'sharp' peak at 315 nm and a broad (or shoulder) peak around 420-480 nm, hence, characteristic of condensed tannins [29, 30]. Wavelength range of 300-400 nm is related to conjugated system between ring B and carbonyl of ring C for band I (cinnamoyl), and band II (benzoyl) located in the wavelength range of 240-300 nm is related to conjugated system between ring A and carbonyl of ring C, hence, quercetin implicated [31]. Fig. 1 presents CASTAN components and reveals that quercetin alone conforms with the UV/visible description cinnamoyl and benzoyl bands, therefore, it can be concluded that quercetin is the major component of CASTAN.
Fig. 3 presents the UV/visible spectrum of CASTAN in 0.5 M HCl solutions before and after aluminium corrosion.
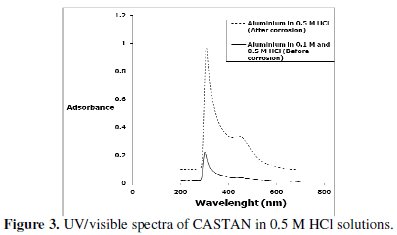
It has been demonstrated [32] that natural organic matter absorption in the ultraviolet region is of n-π* transition that reveals the presence of aromatic C=O and O-H, whereas n-π* transitions at longer wavelengths suggest that, C=C signals absorb weakly. Figure 3 reveals two absorptions in the spectra of 0.5 M HCl solutions containing CASTAN before and after aluminium immersion. After 11 hours, the shape of the two absorptions remained significantly unchanged. However, after corrosion, these peaks had increased intensities suggesting that aromatic C=C, C=O and O-H took part in the adsorption-corrosion inhibition processes. These suggest that CASTAN adsorption on aluminium took place through the aromatic rings and phenolic functional groups of CASTAN components.
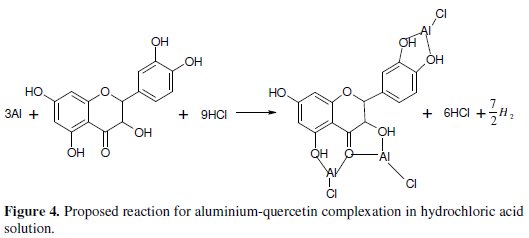
The adsorption of (monochromatic) light is a suitable technique for identification of complex ions [33]. Changes in the position of the absorption maxima and in the value of absorbance indicate the formation of a complex between two species in solution [34]. To confirm therefore the formation of CASTAN-Al complex, uv/visible absorption spectra obtained from 0.5 M HCl solution containing CASTAN before and after 11 hours of corrosion are shown in Fig. 3. This is indicative that [ CASTAN - Al3+ ] complexes formed via π-electrons of aromatic C=C and n-electrons of C=O and O-H sites on CASTAN in 0.5 M HCl solution. Also, the formation of [ CASTAN - Al3+ ] complexes caused increases in values of absorbance for CASTAN spectrum after 11 hours as presented. The variations in absorbance values, support the existence of [ CASTAN - Al3+ ] complex formation via π-electron rich sites of aromatic C=C, conjugated aromatic polyphenols, hydroxyl and carbonyl sites on CASTAN. Physisorption has been proposed because the shape of the spectra did not change significantly after 11 hours [35, 36]. Spectroscopic data suggest that quercetin can chelate cations through both 3hydroxy- 4-carbonyl and the 3',4'-dihydroxyl chelation sites [37, 38], and by quantum chemical studies, chelation is through the 5-hydroxy-4-keto site [39]. Therefore, using quercetin as an example, Fig. 4 presents the adsorption sites on CASTAN components by physisorption on aluminium.
Gravimetric measurement
Gravimetric (or weight loss) technique was used to study the corrosion rate of aluminium in the absence and presence of CASTAN at 30 °C -50 °C. From the obtained corrosion rates, the inhibition efficiency (I%) values were calculated using eq. (8). The values of inhibition efficiency gotten from gravimetric measurements at different CASTAN concentrations, at different temperatures (30 °C - 50 °C) and in 0.1 M and 0.5 M HCl solutions, are presented in Fig. 5 and 6.
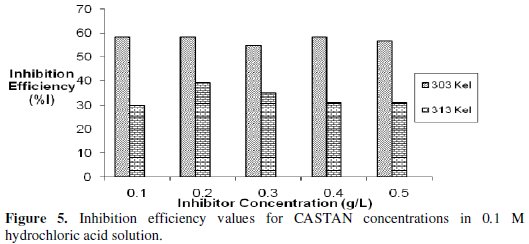
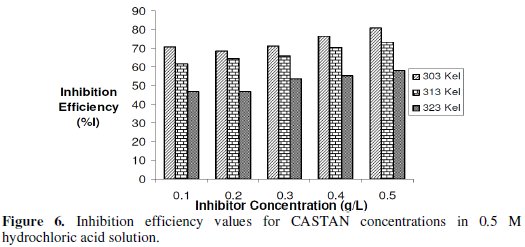
Fig. 6 shows that I% for CASTAN attains the highest value of 80.7% corresponding to the highest CASTAN concentration for 0.5 M HCl at 30 °C. For 0.1 M HCl solutions, I% generally decrease with increase in CASTAN concentration and also decrease with increase in temperature. In contrast, 0.5 M HCl solutions gave I% values which increase with increase in CASTAN concentration but decrease with increase in temperature. These suggest that the number of adsorbed CASTAN molecules decreases as the temperature increase, therefore, lead to a decrease in I% values calculated. Therefore, physisorption of CASTAN on aluminium in 0.1 M and 0.5 M HCl solutions account for the decrease in inhibition efficiency of CASTAN with increase in temperature.
Analysis of variance (ANOVA) results presented in Table 1 reveal that significant difference existed in inhibition efficiencies at different: temperatures, corrodent (HCl) concentrations; and significant difference existed in inhibition efficiencies for/due to corrodent (HCl) concentration and temperature interactions.
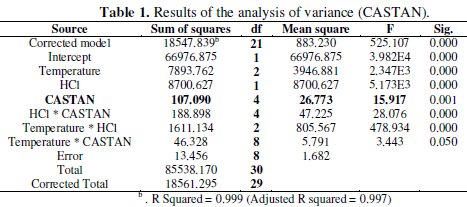
These suggest that the differences observed in Fig. 5 and 6 are statistically significant.
Thermometric measurement
The variations of temperature with time for the dissolutions of aluminium in 2 M HCl at various CASTAN concentrations and without CASTAN are presented in Fig. 7.
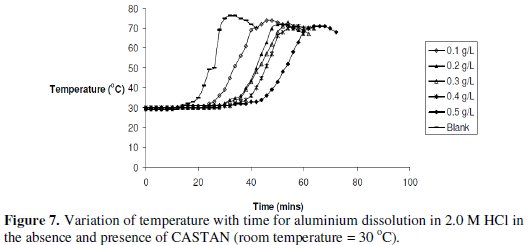
Observations can be made that the times to attain maximum temperature increased for systems containing CASTAN.
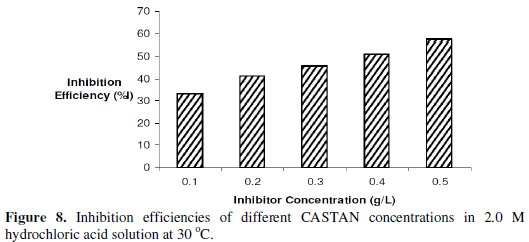
Inhibition efficiencies of CASTAN in 2 M HCl are shown in Fig. 8 and suggest that aluminium corrosion inhibition by CASTAN increases with increase in CASTAN concentration in 2.0 M HCl.
Adsorption considerations
Adsorption of CASTAN largely is dependent on: the nature of the metal surface and the charge on the metal surface; nature of corrodent and particularly the anion specie/moiety; corrosion process temperature; and the electrochemical potential at the solution-interface [5].
CASTAN components (cyanidin, delphinidin, quercetin, azaleatin, catechin and epicatechin) reveal that CASTAN possesses aromatic centers and structural features (size and steric arrangements) from flavonoid skeletons, rich electron densities from oxygen atoms of the ketonic and phenolic functional groups of anthocyanins.
The establishment of adsorption isotherm models which explain/describe the adsorption of an inhibitor can provide vital clues to the nature of the metal- inhibitor interaction(s). Therefore, in order to elucidate the nature of adsorption of CASTAN on aluminium in HCl solutions, adsorption isotherms describing the adsorption processes were determined.
The commonly used linearised adsorption isotherms are [6, 9-11, 13-15]: Langmuir model (eq. (14)); Freundlich model (eq. (15)); Temkin model (eq. (16)); and El-Awady model (eq. (17)). Respectively they are represented thus:


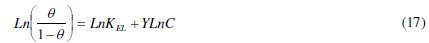
where KL, Kf, KT and KEL are adsorption capacity values obtained from Langmuir, Freundlich, Temkin and El-Awady isotherm models, respectively. Also, 1/n is Freundlich constant, 'f' is the Frumkin lateral interaction factor related to Temkin heterogeneity 'a' (f = -2a) and Y is the El-Awady constant which is characteristic of the number of active sites on the aluminium surface.
Plots of eq. (14)-(17) were performed using Microsoft Excel package of 2003 version. From the intercepts of these plots, adsorption capacity values were obtained and used to determine free energy of adsorption [13] by the following relationship
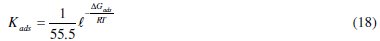
where Kads is any of the adsorption capacity values from eq. (14)-(17). Calculated adsorption capacity values and free energy of adsorption are presented in Table 2.
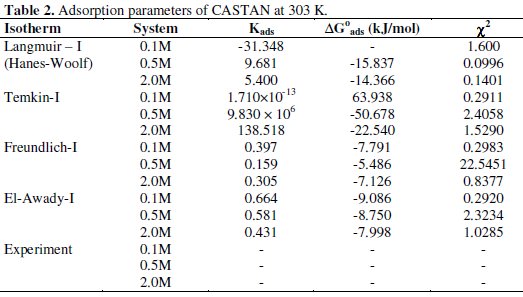
Using chi-square statistic, experimentally and theoretically determined surface coverage values were compared. Presented in Table 2 are values of calculated χ2 from which the lowest value reveals the isotherm that fits χ2 experimental/adsorption data well. From the calculated value, it was concluded that Temkin adsorption isotherm gave the best fit for 0.1 M HCl systems and Langmuir adsorption isotherm fitted the data for 0.5 M and 2.0 M HCl systems well at 30 °C.
Eq. (19) represents the obtained data plots for Temkin adsorption isotherm that fitted adsorption data for 0.1 M HCl solutions.

Using Microsoft Excel package 2003, plots of Temkin adsorption isotherm with experimental data at 30 °C are given as eq. (19)
Comparing eq. (16) and (19), a slope of -0.0136 corresponds to 1/f and when compared with (1/f)lnKT, gives KT value of 1.710×10⁻¹³. The KT value denotes the strength between adsorption and adsorbent such that small KT value implies weak interaction (physical adsorption otherwise known as physisorption). The value of 1/f is negative and reveals that repulsive forces exist among CASTAN molecules and aluminium surface [10], hence, adsorption effectiveness was reduced and consequently, inhibition of aluminium in HCl was compromised. In fact, it is most likely that repulsive interactions between layers of adsorbed CASTAN components such as cyanidin and delphinidin exist. The positive charges on cyanidin and delphinidin molecules are most likely responsible for repulsion between CASTAN and aluminium which led to poor adsorption and consequently decreased inhibition.
For 0.5 M HCl solutions, adsorption data fitted well into eq. (20) at 30 °C from which the following equation was obtained:

The plot represents Langmuir adsorption isotherm. It is true that if the coefficient of determination (R2) has a very high value, a slope of 0.1903 deviates from the predicted value of unity from eq. (14). Therefore, lateral or vertical adsorption mode/mechanism by CASTAN components is proposed; consequently, interactions of CASTAN molecules on aluminium are such that high chemical adsorption or heavy physisorption must have occurred. Another possibility is that the aluminium surface is characterized by non similar (heterogeneous) adsorption sites. In contrast, earlier adsorption studies by Langmuir [31] posited that surface adsorption sites are similar (homogeneous) for adsorbents from which plots of adsorption data gave values of unity and therefore favour chemisorption. For the fact that physisorption was proposed earlier (section ''Gravimetric measurement''), consequently, these adsorbing CASTAN molecules (adsorbates) would interact with themselves, and multilayer coverage by adsorbing molecules is expected, otherwise, aluminium surface is characterized with/by heterogeneous (non similar) adsorption sites.
In the same vein for 2.0 M HCl solutions, adsorption data fitted well into eq. (21) at 30 °C from which the following equation was obtained:

Though the coefficient of determination (R2) is very high, the value of slope of 0.1442 deviates from the predicted value of unity from eq. (14). This suggests that interactions of CASTAN molecules on aluminium involve high chemical adsorption or heavy physical adsorption. In fact, low KL value of 5.400 reveals physisorption of CASTAN on aluminium. Physisorption mechanism is further confirmed by comparing calculated free energy values shown in Table 2. Free energy value of -14.366 KJ/mol is not up to -40 kJ/mol and therefore suggests physisorption of CASTAN on aluminium in 2.0 HCl [13].
The conclusion therefore is that physical adsorption mechanisms took place in 0.1 M, 0.5 M and 2.0 M HCl solutions for the adsorption of CASTAN on aluminium. Oguzie [14] reported earlier that corrosion inhibitors which physisorb on metals are cathodic inhibitors. CASTAN has been shown to physisorb on aluminium in HCl solutions, therefore, it is a cathodic inhibitor. It suggests therefore that aluminium corrosion inhibition by CASTAN is such that its presence in HCl slows down the rate at which hydrogen gas evolves in the corrosion processes as eq. (3) presents.
Statistical analysis
Regression analysis is a correlation based statistical technique for making predictions. It allows one variable to be predicted from another/other variable(s) based on the correlation between the variable. As such, the technique models the relationship between variables to give a structural model known as the regression model [25].
Here the simple linear regression was used to determine how much theoretical surface coverage (θcal) values (from adsorption isotherm models) account/predict experimentally obtained surface coverage (θexp) values. The linear eq. (19) was taken to represent the regression models developed for θcal and θexp values from

where Y is the experimental surface coverage value, X is the theoretical surface coverage value, 'a' is the regression constant and 'b' is the regression coefficient. Two 'normal' equations were generated and solved simultaneously to determine the regression constant and regression coefficient values. These 'normal' equations generated are represented thus


where N represents the number of θexp values and Σ represents summation.
For 0.1 M HCl systems, substituting appropriately into eq. (23) and (24), and solving simultaneously, b = 0.5 and a = 0.3644 to give a regression model

Using eq. (26), the standard error (SEy) of estimate (regression model) was
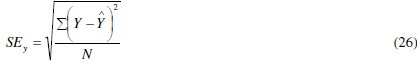
The calculated SEy at 95% confidence level gave ± 0.0253. Considering the prediction from eq. (22), the SEy measures the error in the predicted surface coverage values ( Y ) for 0.1 M HCl systems.
Furthermore, to account for how much of the θexp values accounted for by theregression model, the coefficient of determination (R2) was calculated using eq. (27) [40].
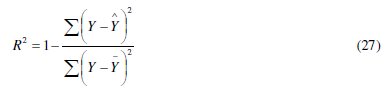
where Y is the mean value of the experimental surface coverage values. From eq. (25), R2 value of 0.1589 (about 15.89%) was calculated. R2 value suggests that about 15.89% of the experimental surface coverage values were accounted for by the theoretical surface coverage values obtained from the Temkin adsorption model. The calculated low R2 value can be attributed to the fact that from the regression statistic, the Temkin adsorption model does not account for the experimental surface coverage values well. In contrast, this model seems to give the best fit to adsorption data from the tested adsorption models from chi-square and standard error statistics.
For 0.5 M HCl systems, substituting appropriately into eq. (23) and (24), and solving simultaneously, the following regression parameters were determined: b = 0.2573 and a = 0.5543 to give a regression model

Using eq. (26), the standard error of estimate (regression model) was calculated to give standard Error (SEy) value of ± 0.0622 at 95% confidence level.
Considering the prediction from eq. (26), the SEy measures the error in the predicted surface coverage values ( Y ) for 0.5 M HCl systems.
Furthermore, to account for how much of the θexp values were accounted for by the Langmuir model, the coefficient of determination (R2) was calculated using eq. (27). From equation (27), R2 value of 0.4886 (about 48.86%) was calculated. R2 value suggests that about 48.86% of the experimental surface coverage values were accounted for by the theoretical surface coverage values obtained from the Langmuir adsorption model. Comparing results obtained from 0.1 M systems with those of 0.5 M systems, 0.5 M systems were accounted for more than 0.1 M systems.
For 2.0 M HCl systems, substituting appropriately into eq. (23) and (24)), and solving simultaneously, b = 0.5924 and a = 0.1146 to give a regression model

Using eq. (26), the standard error of estimate (regression model) was calculated to give standard Error (SEy) value of ± 0.03403 at 95% confidence level. Considering the prediction from eq. (26), the SEy measures the error in the predicted surface coverage values ( Y ) for 2.0 M HCl systems.
Furthermore, to account for how much of the θexp values accounted for by the Langmuir adsorption model, the coefficient of determination (R2) was calculated using eq. (27). From eq. (27), R2 value of 0.9557 (about 95.57%) was calculated. R2 value suggests that about 95.57% of the experimental surface coverage values were accounted for by the theoretical surface coverage values obtained from the Langmuir adsorption model. Comparing results obtained from 0.1 M and 0.5 M systems with those of 2.0 M systems, 2.0 M systems were accounted for most than 0.1 and 0.5 M systems.
Regression studies were done because linear adsorption isotherms give good results [9] in adsorption studies. However, the uses of linear adsorption models (eq. (14)-(17)) have come under criticisms on the basis that they introduce errors from the linearisations of the adsorption models [41, 42]. The fact that the adsorption models are non-linear, consequently fitting them to adsorption data require: special optimization programs [41]; availability of these programs or softwares; and expertise to make use of them. It is therefore necessary that the linearised versions of the non-linear adsorption isotherms (eq. (14)-(17)) are tried out.
Now, one may insist that the use of the linear forms of adsorption isotherms does not give good results as compared to results obtained from non-linear adsorption isotherms. Scientifically (or mathematically) speaking, chi-square and regression statistics are powerful tools (techniques) of performing error analysis of data. Therefore, R2 values of 15.89%, 48.86% and 95.57% representing correlation coefficients for θexp and θcal, respectively, for 0.1 M, 0.5 M and 2.0 M HCl systems, suggest that the form of adsorption isotherm used (linear or non-linear) is not the only factor affecting how well adsorption mechanism can be explained. Excellent R2 value for 2.0 M HCl systems supports our claim. We suggest therefore that the type (or nature) of adsorption, also affects how well existing adsorption isotherms/models can explain adsorption processes!
Temperature effect of CASTAN adsorption on aluminium in HCl solutions
The temperature stability of CASTAN as aluminum corrosion inhibitor in hydrochloric acid solutions was studied. Usually, the Arrhenius plots of eq. (30) come handy [13], as such, kinetic/thermodynamic parameters can be obtained therefrom.

Calculated corrosion rates (Ccorr) of aluminium in 0.1 M and 0.5 M HCl solutions at 30 °C - 50 °C were used to make the Arrhenius plots. The values of frequency factor (A) and activation energy (Ea) were determined from Arrhenius plots of eq. (30). Respectively, A and Ea were gotten from intercepts and slopes of eq. (30) plots and presented in Table 3.
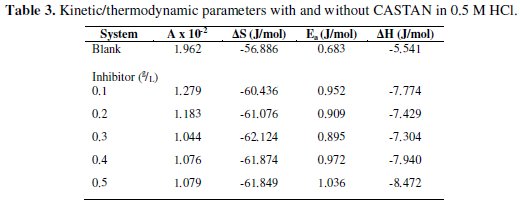
Table 3 shows that in 0.1 M HCl and 0.5 M HCl solutions, the frequency factor values for aluminium dissolution are higher for blank solutions than those solutions containing various concentrations of CASTAN. These are evidences for good inhibition efficiency exhibited by CASTAN [14]. Activation energy values obtained from slopes of eq. (30) plots for 0.1 M and 0.5 M HCl blanks are lower than values obtained for systems containing CASTAN. These also confirm what was observed in the laboratory: the presence of CASTAN, prolonged the longevity of aluminium in 0.1 M and 0.5 M HCl solutions.
Kinetics of CASTAN adsorption on aluminium in HCl
The major reaction that explains aluminium corrosion in hydrochloric acid can be represented, as shown in eq. (1). In the absence of CASTAN, but in the presence of air and moisture, the formation of oxide films has been reported. These oxide films (Al2O3, Al(OH)3 and AlO.OH) have been reported to decrease the rate at which aluminum corrodes [5, 6]. Reaction pathways that account for the formation of these aluminum compounds can be represented thus:


Regrettably, the presence of anions such as Cl-breakdown the passivity of aluminium; therefore, the protection of aluminium enjoys fails. The addition of corrosion inhibition becomes vital for continued aluminium protection. The presence of an inhibitor therefore brings about the production of other corrosion products and the chemistry of this process can be presented as:

It is clear that for the corrosion inhibition process, eq. (31)-(34) occur; therefore, the corrosion inhibition process is a complex reaction type. To account for these reactions (that is the complexity of corrosion), we propose that parallel reactions occur in such a way that eq. (1) is the main reaction in the corrosion process. The side reactions involve eq. (31)-(33) for corrosion process without inhibitor and eq. (31)-(34) for corrosion process with inhibitor present. A general expression representing parallel reactions is


where [Al.Inh] represents Al2O3, Al(OH)3 and AlO.OH in the absence of the inhibitor and [Al.CASTAN] in the presence of CASTAN, k1 is rate constant for the dissolution of aluminium, k2 is the unimolecular rate constant for decomposition of activated complex, and Kc the proportionality constant for the formation of activated complex.
From gravimetric measurements, the reaction rate constant, k1, can be determined from the following differential rate law

Rearranging eq. (37) gives
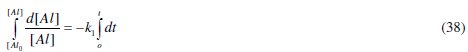
Solving eq. (38) gives

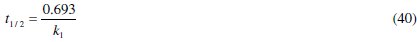
where [Al]0 is the weight of aluminium coupon before corrosion, [Al] is the weight of aluminium at different time intervals during corrosion, t is the time involved. From the slopes of eq. (39) plots, k1 was calculated. Substituting k1 values into eq. (40) enabled the determinations of half-lives (t1/2) for the various corrosion processes.
In chemistry, reactions are thought to progress when reactants possess enough energy (activation energy) to react and form products. Consequently, these reactants acquire energy to form an activated complex which then decomposes into products. This can be illustrated thus:

From the foregoing, the aluminium corrosion inhibition by inhibitor (CASTAN) can therefore be represented by eq. (42).

From eq. (42), an overall rate for the corrosion process can be written as given below where k is the overall rate constant for the dissolution of aluminium. A rate equation for the production of activated complex can be expressed mathematically assuming that the reactants are in equilibrium with the activated complex (as shown in eq. (41)).

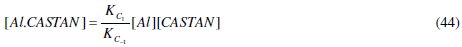

Comparing eq. (44) and (45) reveals that, KC = KC1 / KC- 1 , hence its name, proportionality constant.
From the unimolecular decomposition of the activated complex shown by eq. (36), another rate equation can be written as


Close observation of eq. (36) clearly shows that the corrosion process goes through two major steps: formation of activated complex and decomposition of activated complex. These two major steps gave rise to expressions (43) and (47). Therefore, equating the overall rate equation represented by eq. (43) and eq. (47) which represent the corrosion steps, the following equation was obtained:

This obviously makes the overall rate constant, k, be related thus

The overall rate constant is also known as the bimolecular rate constant for the corrosion inhibition process involving reaction between aluminium and CASTAN. The proportionality constant (KC) has relationship with the unimolecular rate constant (k1) thus [43]:

The proportionality constant has been shown to have the following expression [43, 44]

Eq. (51) was used to calculate KC values. Substituting KC values into eq. (50), k1 values were calculated. The values of k were also calculated from eq. (51) after substituting values for k1 and KC.
A close observation of eq. (1) reveals that hydrogen is given off during aluminium corrosion in HCl. Assuming ideal gas behaviour for the hydrogen gas evolved, eq. (52) gives a relationship between heat of CASTAN adsorption on aluminium and energy of activation in HCl solutions [44].

where Δn is the number of moles of hydrogen gas evolved. Values of Δn were calculated and presented in Tables 4 and 5.
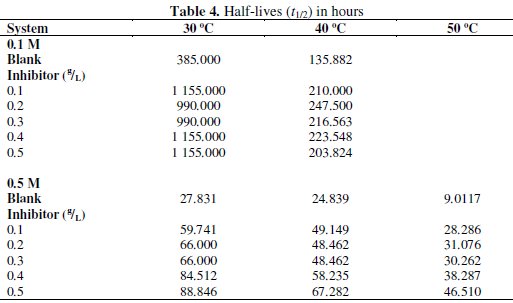
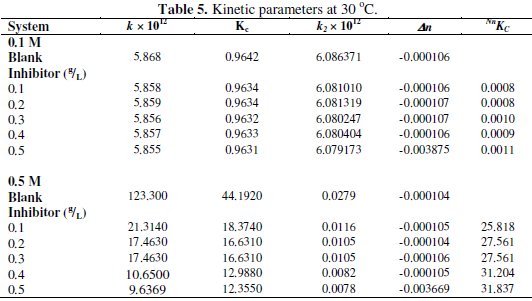
Tables 4 and 5 present complex reaction kinetic parameters, in the presence and absence of CASTAN, calculated from kinetic data. It is expected that more negative Δn value should favour better corrosion inhibition whereas more positive value should favour aluminium corrosion. From Table 5, therefore, Δn values for 0.5 M HCl solutions are more positive than for 0.1 M HCl solutions, suggesting that aluminium corroded more in 0.5 M HCl solution.
Table 4 presents values of half-lives and it was observed that values for 0.1 M HCl were higher/larger than for 0.5 M HCl, suggesting that CASTAN inhibited aluminium corrosion better in 0.1 M HCl than in 0.5 M HCl.
Thermodynamics of CASTAN adsorption on aluminium in HCl
Thermodynamic model is an important tool to study the mechanism of inhibition on the corrosion of metals [13, 15]; therefore, a thermodynamic model was chosen/selected so that complete understanding of the CASTAN inhibition mechanism on aluminium corrosion would be possible.
Free energy of adsorption for CASTAN adsorption on aluminum was obtained using eq. (34) [13, 14]. The free energy of adsorption values, ΔGads, which can characterize the interaction of CASTAN on metal surface [15], were calculated and presented in Table 2. The negative values of ΔGads suggest the spontaneity of adsorption processes and stability of the adsorbed layer on the aluminium surface [10]. Usually, the values of ΔGads around -20 kJ/mol (and lower magnitude) are consistent with physisorption and those around -40 kJ/mol (and higher magnitude) involve chemisorptions [13].
The well-known thermodynamic adsorption parameters-free energy of adsorption (ΔGads), heat of adsorption (ΔHads) and entropy of adsorption (ΔSads), were determined. Values of ΔGads were calculated using eq. (15) and plotted against temperature (T) using a thermodynamic expression, as shown below:

On careful observation, one identifies that eq. (53) is similar to a straight line equation such that the intercepts gotten from the plots represent ΔHads. The values of ΔHads thus obtained were introduced into eq. (53) therefore allowing the calculations of DSads. Calculated thermodynamic parameters are presented in Table 3.
Calculated negative values of ΔGads (presented in Table 2) indicate that CASTAN adsorption on aluminium in HCl solutions is spontaneous. In addition, negative ΔHads values are suggestive of exothermic adsorption processes by CASTAN on aluminium in HCl solutions. From values of ΔHads in Table 3 which are not up to -40 kJmol-1, CASTAN adsorption processes on aluminium in HCl solutions are indicative of physical adsorption.
Quantum chemical studies
In this work, quantum chemical calculations using DFT were used to explain the experimental results obtained and to further give insight into the inhibition action of CASTAN on aluminium surface. In acidic environment the inhibitors also interact with the acidic solution leading to the possibility of co-existence of both protonated and non protonated species of the inhibitor components. In such cases, it is interesting to investigate the preferred species to interact with the metal surface and to study the influence of protonation on the molecular structures and the molecular properties of the inhibitor components. The possible sites for protonation as determined by quantum chemical calculations are the heteroatoms (hydroxyl groups) present in each CASTAN component. The results of the quantum chemical calculations on the different possible sites for protonation suggest that the preferred sites for protonation are: O3 (azaleatin) and O7 (quercetin). These are the sites that are less sterically hindered which can allow protonation. Tables 6 and 7 show the calculated quantum chemical properties for CASTAN components (epicatechin, catechin, azaleatin, cyanidin, quercetin and delphinidin).
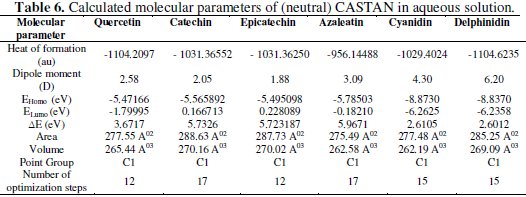
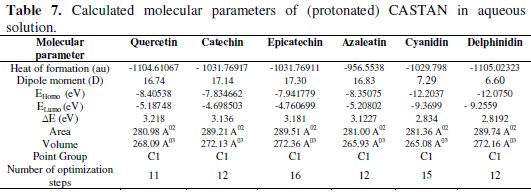
Frontier orbital theory holds that reactivity of molecules often occurs on the highest occupied molecular orbital (HOMO) and lowest unoccupied molecular orbital (LUMO). Therefore, EHOMO and ELUMO determine how the molecule interacts with other species because HOMO is the outermost (higher energy) orbital, and acts as the electron donor, hence, is directly related to the ionization potential, while LUMO is the innermost (lowest energy) orbital and acts as the electron acceptor, hence, related to the electron affinity [46]. Higher EHOMO values indicate a tendency of CASTAN molecules to donate electrons to appropriate acceptor molecules with low energy or empty 3p orbitals of aluminium to form coordinate bond. Lower ELUMO values suggest stronger electron accepting abilities of CASTAN molecules and ensure electron back- donation bonding with its anti-bonding orbitals.
Table 7 shows lower ELUMO values for protonated (epicatechin, catechin, azaleatin, cyanidin, quercetin and delphinidin) structures than those of the neutral forms, therefore revealing that the adsorption of CASTAN onto aluminium was such that its components exist in protonated forms in hydrochloric acid solutions. Low ELUMO values imply high electron affinity [46]; therefore, values of ELUMO for cyanidin and delphinidin in neutral and protonated forms are lowest, hence, they have high electron affinities. These explain why the increased presence causes a decrease in CASTAN inhibition efficiency in 0.1 M HCl solutions. As reported by Abdallah et al. [47], negative EHOMO values suggest physisorption.
Presented in Tables 6 and 7 are negative EHOMO values for CASTAN molecules (neutral and protonated) suggesting physisorption onto aluminium in HCl. The difference between EHOMO and ELUMO is the energy gap ( ΔE ) as shown below [36, 37, 45].

It is an important stability index [48] such that large ΔE values imply high stability for the molecule in chemical reactions. Smaller ΔE values imply low stability, hence, more reactivity for the molecule in chemical reactions [46, 49]. The most widely used quantity to describe the polarity is the dipole moment of the molecule [50].
Dipole moment is another molecular parameter which correlates the adsorption of inhibitors on metal surfaces [46]. Table 7 reveals higher dipole moment values for protonated CASTAN components than their neutral forms and these suggest that aluminium corrosion inhibition exhibited by CASTAN was feasible in hydrochloric acid solutions due to adsorption of CASTAN molecules on aluminium in their protonated forms. According to Dwivedi and Misra [51], a molecule with high dipole moment has low energy gap ( ΔE ), therefore, its chemical reactivity is high; can be easily polarized; has low kinetic stability; and is a soft molecule.
Mulliken charges of the atoms of CASTAN molecules are shown in Table 8.
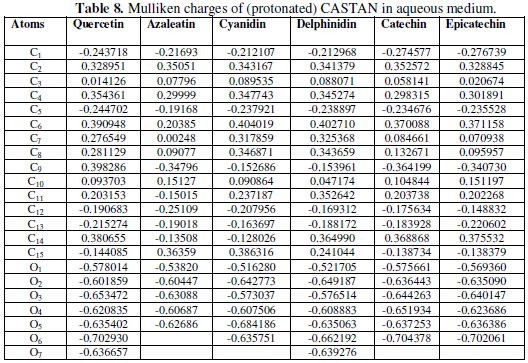
Reports [22, 45, 46] stand that the more the negative charge of the atom, the more the ease for the atom to donate its electrons to the vacant orbitals of the metal, therefore, the most probable adsorption site. For example, Table 8 shows that: C1, C5, C12, C13, C15, O1, O2, O3, O4, O5, O6 and O7 are the atoms with excess negative charges (neutral and protonated quercetin); and C1, C5, C9, C12, C13, O1, O2, O3, O4, O5, O6 and O7 are the atoms with excess negative charges (neutral and protonated delphinidin). These suggest that the availability of electron density and excess negative charges on the atoms are enough/capable of adsorbing on aluminium surface; therefore, adsorption of CASTAN molecules on aluminium most likely took place through the aromatic rings and phenolic functional groups of CASTAN.
Values of quantum chemical parameters (EHOMO, ELUMO, ΔE , and dipole moment) suggest that CASTAN is a good corrosion inhibitor in HCl and this corresponds to experimental inhibition values presented in Fig. 5, 6 and 8.
Conclusion
Infrared spectroscopy reveals the presence of functional groups consistent with structures like quercetin, a component of CASTAN. UV/visible spectrophotometry reveals that the functional groups of CASTAN components, which absorbed on aluminium and resulted to inhibition of aluminium corrosion in HCl are: conjugated aromatic polyphenols, aromatic conjugated C=C and C=O.
CASTAN has been demonstrated to inhibit aluminium corrosion in 0.1 M, 0.5 M and 2.0 M HCl. It is such that CASTAN inhibition efficiency increases as its concentration increased in 0.5 M and 2.0 M HCl, but in 0.1M HCl, it generally decreases as its concentration increased. Increasing corrosion temperature was found to decrease the inhibitive performance of CASTAN and this suggests that inhibitive performance of CASTAN adsorbs on aluminium in HCl by physisorption, hence, a cathodic inhibitor.
Furthermore, adsorption studies show that the Temkin isotherm approximates the adsorption mechanism of CASTAN on aluminium in 0.1 M HCl at 30 °C. The Langmuir isotherm has been discovered to explain the adsorption mechanism of CASTAN on aluminium in 0.5 M and 2.0 M HCl at 30 °C.
Calculated quantum chemical parameters further suggest that CASTAN physisorbed on aluminium through aromatic C=C, C=O and O-H sites of its components in protonated forms.
References
1. Ukoha P O, Ejikeme P M, Maju C C. J Am Leather Chem Asso. 2010;106:242. [ Links ]
2. Jacobson G A. The AMPTIAC Quarterly. 2009;7:39. [ Links ]
3. Fontana M G, Green N D. Corrosion engineering. 2nd. ed. USA:McGraw-Hill; 1978. [ Links ]
4. Oguzie E E. Corros Sci. 2007;49:1527. [ Links ]
5. Mishra A K, Balasubramaniam K. Mater Chem Phys. 2007;103:358. [ Links ]
6. El-Etre A Y. Corros Sci. 2003;45:2485. [ Links ]
7. Leckie H P, Uhlig H H. J Electrochem Soc. 1966;113:1262. [ Links ]
8. James A O, Akaranta O. Afri J Pure Appl Chem. 2009;3:262. [ Links ]
9. Nnaji N J, Obi-Egbedi N O, Nnabugwu M A. Int J Chem Sci. 2012;10:182. [ Links ]
10. Okafor P C, Ikpi M E, Uwah I E, et al. Corros Sci. 2008;50:2310. [ Links ]
11. Umoren S A, Ogbobe O, Ebenso E E. Trans SAEST 2006;41:98. [ Links ]
12. Rahim A A, Rocca E, Steinmetz J, et al. Corros Sci. 2007;49:402. [ Links ]
13. Noor E A. Int J Electrochem Sci. 2007;2:996. [ Links ]
14. Obi-Egbedi N O, Essien K E, Obot I B. J Comput Method Mol Design. 2011;1:26. [ Links ]
15. Obot I B, Obi-Egbedi NO , Umoren S A. Int J Electrochem Sci. 2009;4:863. [ Links ]
16. Nnaji N J N, Okoye C O B, Obi-Egbedi N O, et al. Int J Electrochem Sci. 2013;8:1735. [ Links ]
17. Arora P, Kumar S, Sharma M K, et al. E-J Chem. 2007;4:450. [ Links ]
18. Umoren S A, Obot I B, Ebenso E E, et al. Port Electrochim Acta. 2008;26:199. [ Links ]
19. Elawady G Y, El-Said I A, Fouda A S. Int J Electrochem Sci. 2008;3:177. [ Links ]
20. Ju H, Li Y. Corr Sci. 2007:49:4185. [ Links ]
21. Li Y, Zhao P, Liang Q, et al. Appl Surf Sci. 2005;252:1245. [ Links ]
22. Ezeoke A U, Adeyemi O G, Akerele O A, et al. Int J Electrochem Sci. 2012;7:534. [ Links ]
23. Atkins P W, de Paula J. Physical chemistry. 9th edition. New York:W.H. Freeman & Company;2010. [ Links ]
24. Shao Y, Molnar L F, Jung Y, et al. Phys Chem Chem Phys. 2006;8:3172. [ Links ]
25. Nworgu B G. Educational research-Basic issues & methodology. 2nd. ed. Nsukka:University Trust Publishers;2006. [ Links ]
26. Nnaji N J N, Ani J U, Aneke L E, et al. J Ind Engr Chem. 2013;20:1930. [ Links ]
27. Ukoha P O, Oparah E N, Maju C C. J Chem Soc Nig. 2005;30:53. [ Links ]
28. Furniss B S, Hannaford A J, Smith P W G, et al. Vogel's Textbook of Practical Organic Chemistry. 5th. ed. Essex:Longman Group;1989. [ Links ]
29. Nakagawa K, Sugita M. J Soc Leather Technol Chem. 1999;83:261. [ Links ]
30. Heneczkowski M, Kopacz M, Nowak D, et al. Acta Pol Pharm. 2001;58:415. [ Links ]
31. Dehghan G, Khoshkam Z. Food Chem. 2012;131:422. [ Links ]
32. Chen J, Gu B, LeBoeuf E J, et al. Chemosphere. 2002;48:59. [ Links ]
33. Zhongqi H, Jingdong M C, Wayne H, et al. Biol Fertil Soils. 2009;45:609. [ Links ]
34. Abboud Y, Abourriche A, Saffaj T, et al. Mater Chem Phys. 2007;105:1. [ Links ]
35. Abboud Y, Abourriche A, Saffaj T, et al. Desalination 2009;237:175. [ Links ]
36. Obi-Egbedi N O, Obot I B. Corros Sci. 2011;53:263. [ Links ]
37. Obi-Egbedi N O, Obot I B, Mohammad I E. J Mol Struct. 2011;1002:86. [ Links ]
38. Cornard J P, Merlin J C. J Inorg Biochem. 2002;92:19. [ Links ]
39. Shaofang S, Weijun C, Wei C, et al. THEOCHEM. 2008;860:40. [ Links ]
40. Anyadike R N C. Statistical methods for the social and environmental sciences. Ibadan:Spectrum Books Limited; 2009. [ Links ]
41. Adhistya E P, Dayang R A R, Dhanapal P D D. IEEE. 2010:941. [ Links ]
42. Subramanyam B, Das A. Int J Environ Sci Tech. 2009;6:635. [ Links ]
43. Sharma K K, Sharma L K. A Textbook of Physical Chemistry. 4th revised edn. New Delhi:Vikas Publishing House PVT Ltd.;1999. [ Links ]
44. Okafor E C. Physical chemistry-Fundamentals. Enugu:Snaap Press Ltd.; 2004. [ Links ]
45. Obi-Egbedi N O, Obot I B, Mohammad I E. J Mol Struct. 2011;1002:86. [ Links ]
46. Gece G. Corros Sci. 2008;50:2981. [ Links ]
47. Abdallah M, Helal E A, Fouda A S. Corros Sci. 2006;48:1639. [ Links ]
48. Lewis D F V, Ioannides C, Parke D V. Xenobiotica. 1994;24:401. [ Links ]
49. Pearson R G. J Org Chem. 1989;54:1423. [ Links ]
50. Kikuchi O. Quant Struct-Act Relat. 1987;6:179. [ Links ]
51. Dwivedi A, Misra N. Der Pharma Chem. 2010;2:58. [ Links ]
*Corresponding author. E-mail address: joemeks4u@yahoo.com
Received 20 December 2013; accepted 17 April 2014

