


Serviços Personalizados
Journal
Artigo
 Inglês (pdf)
 Artigo em XML
 Referências do artigo
 Enviar este artigo por email
Indicadores
-
 Citado por SciELO
 -
 Acessos
Links relacionados
-
 Similares em
SciELO
Similares em
SciELO
Compartilhar

 Permalink
Portugaliae Electrochimica Acta
versão impressa ISSN 0872-1904
Port. Electrochim. Acta vol.31 no.3 Coimbra maio 2013
https://doi.org/10.4152/pea.201303141
Inhibition of Corrosion of Carbon Steel in Sea Water by Sodium Gluconate-Zn2+ System
S. Rajendrana, K. Anuradhab, K. Kavipriyaa,*, A. Krishnavenic, J. Jeyasundarid and V. Sribharathya
a Corrosion Research Center, PG and Research Department of Chemistry, GTN Arts College, Dindigul 624 005, Tamilnadu, India
b Department of Chemistry, KLN College of Information Technology, Pottapalayam 630 611, India
c Department of Chemistry, Yadava Collge, Madurai, India
d Department of Chemistry, SVN College, Madurai, India
Abstract
The inhibition efficiency of sodium gluconate (SG)-Zn2+ system in controlling corrosion of carbon steel in sea water has been evaluated by weight-loss method. The formulation consisting of 250 ppm of SG and 75 ppm of Zn2+ has 98% IE. Influence of duration of immersion on the IE of SG-Zn2+ has been evaluated. The mechanistic aspects of corrosion inhibition have been investigated by polarization study and AC impedance spectra. The protective film has been analysed by FTIR and luminescence spectra. The surface morphology and the roughness of the metal surface have been analysed by atomic force microscopy. The protective film consists of Fe2+-SG complex and Zn(OH)2. It is found to be UV-fluorescent.
Keywords: Carbon steel, sodium gluconate, synergistic effect, Atomic Force Microscopy (AFM), Fourier Transform Infrared Spectroscopy (FTIR), corrosion.
Introduction
Several carboxylic acids have been used as corrosion inhibitors to prevent corrosion of metals [1-35]. Their inhibitive action is due to coordination of the oxygen atom of the carboxylate anion to the metal ions to form metal-inhibitor complexes. They have been used to prevent the corrosion of metals such as mild steel [1, 10, 11, 14, 32, 33], aluminium [7, 9] and copper [19, 23].
The environment includes various media like acidic [6, 12, 23, 33], alkaline [6] and neutral [8, 9, 10, 12]. Thermodynamic studies [19], quantum chemical studies [35], and electrochemical studies [4] have been employed to explain the inhibitive actions of carboxylic acids. Phosphono carboxylic acids [29, 31, 32], tartrates [8, 10], amino acids [19] and citrates [1] have been used as corrosion inhibitors.
The present work is undertaken (i) to evaluate the inhibition efficiencies of sodium gluconate (SG)-Zn2+ system in controlling corrosion of carbon steel in sea water by weight-loss method, (ii) to investigate the mechanistic aspects of corrosion inhibition by electrochemical studies like polarization study and AC impedance spectra, (iii) to analyse the protective film by FTIR and luminescence spectra, (iv) to analyse the surface morphology by AFM, and (v) to propose a suitable mechanism of corrosion inhibition based on the results from the above study.
Experimental
Preparation of specimen
Carbon steel specimens [0.0267 % S, 0.06 % P, 0.4 % Mn, 0.1 % C and the rest iron] of dimensions 1.0 cm × 4.0 cm × 0.2 cm were polished to a mirror finish and degreased with trichloroethylene.
Weight-loss method
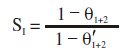
Carbon steel specimens in triplicate were immersed in 100 mL of solutions containing various concentrations of the inhibitor in the presence and absence of Zn2+ for one day. The weight of the specimens before and after immersion was determined using a Shimadzu balance, model AY62. The corrosion products were cleansed with Clarke's solution [36]. The inhibition efficiency (IE) was then calculated using the equation.
where W1 = corrosion rate in the absence of the inhibitor, and W2 = corrosion rate in the presence of the inhibitor.
Biocidal study
Inhibitor - Zn2+ formulations that offered the best corrosion inhibition efficiency were selected for biocidal study. The biocidal efficiency of N-cetyl -N, N, N - trimethylammonium bromide (CTAB) in the presence and absence of these formulations and also the effect of CTAB on the corrosion inhibition efficiency of these systems were determined [37-39].
Various concentrations of CTAB 50 ppm, 100 ppm, 150 ppm, 200 ppm, and 250 ppm were added to the formulation consisting of the inhibitor system. The numbers of colony-forming units (CFU/mL) present in the above formulation were determined by step dilution technique. Synergistic formulations were taken into Petri dishes and mixed with 15 mL of sterile nutrient agar. While mixing, the plate was tilted back and forth, so that the medium and sample travels around the plate several times. Then, the Petri dishes were kept in an incubator at 30 °C in an inverted position for 5 days. Distinct colonies of bacteria were developed. Such colonies may be easily isolated. Each organism grew and reproduced itself. To determine the number of colonies, the plate count technique was applied. One organism gives rise to one colony. Hence, a colony count performed on the plate reveals the viable microbial population. Within the range of 30-300, the count can be accurate. Colonies are usually counted from dark field illumination, so that they are easily visible and a large magnifying lens is often used. Number of colonies counted on plate x dilution of sample = number of bacteria per mL.
Surface examination study
The carbon steel specimens were immersed in various test solutions for a period of one day. After one day, the specimens were taken out and dried. The nature of the film formed on the surface of the metal specimens was analysed for surface analysis technique by FTIR spectra and fluorescence spectra.
FTIR spectra
The film formed on the metal surface was carefully removed and mixed thoroughly with KBr. The FTIR spectra were recorded in a Perkin Elmer 1600 spectrophotometer.
Fluorescence spectra
These spectra were recorded in a Hitachi F-4500 fluorescence spectrophotometer.
Atomic Force Microscopy
Atomic Force Microscopy (AFM) is an exciting new technique that allows surface to be imaged at higher resolutions and accuracies than ever before [4042]. The microscope used for the present study was PicoSPM I Molecular Imaging, USA. Polished specimens prior to the initiation of all corrosion experiments were examined through an optical microscope to find out any surface defects such as pits or noticeable irregularities like cracks, etc. Only those specimens which had a smooth pit-free surface were subjected for AFM examination. The protective films formed on the carbon steel specimens after immersion in the inhibitor systems for different time durations were examined for a scanned area of 30 × 30 μm2 and 15 × 15 μm2. The two-dimensional and three-dimensional topographies of surface films gave various roughness parameters of the film.
Polarization study
Polarization studies were carried out in an H & CH electrochemical workstation impedance analyser, model CHI 660A.
A three-electrode cell assembly was used. The working electrode was carbon steel. A saturated calomel electrode (SCE) was used as the reference electrode and a rectangular platinum foil was used as the counter electrode.
AC impedance measurements
The instrument used for polarization study was used for AC impedance measurements too. The cell set up was the same as that used for polarization measurements. The real part (Z') and the imaginary part (Z'') of the cell impedance were measured in Ohms at various frequencies. The values of charge transfer resistance, Rt, and the double layer capacitance, Cdl, were calculated.
where Rs = solution resistance, and Cdl = 1 / 2 Π RT fmax being fmax = maximum frequency.
Results and discussion
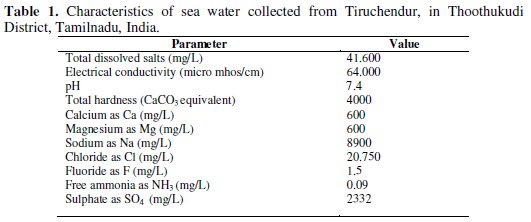
The inhibition efficiency of sodium gluconate (SG)-Zn2+ system in controlling corrosion of carbon steel in sea water (Table 1) has been evaluated by weight-loss method and electrochemical studies such as potentiodynamic polarization study and AC impedance spectra.
Weight-loss method
Inhibition efficiencies (IE %) of SG-Zn2+ systems in controlling corrosion of carbon steel in sea water (immersion period = 5 days) are given in Table 2.
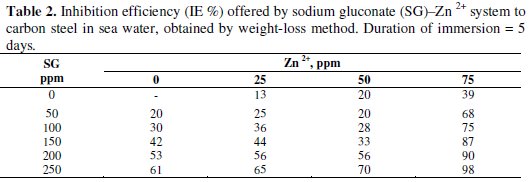
It is observed that SG alone has good inhibition efficiency. As the concentration of SG increases, the IE also increases.
In the presence of various concentrations of Zn2+ (25, 50 and 75 ppm), the IE of SG increases. A synergistic effect exists between SG and Zn2+. For example, 250 ppm of SG have only 61% IE; 75 ppm of Zn2+ have 39% IE. However, their combination has 98% IE. This suggests a synergistic effect existing between SG and Zn2+.
Influence of duration of immersion on the inhibition efficiency of the SG-Zn2+ system
The formulation consisting of 250 ppm SG and 50 ppm of Zn2+ has 98% IE (immersion period = 5 days). The influence of the immersion period on the IE of this system is shown in Fig. 1.
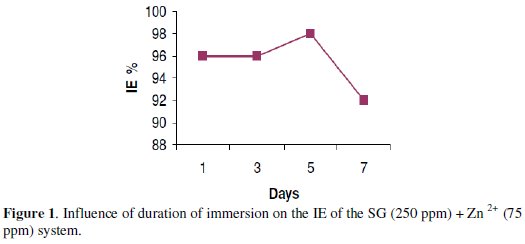
It is observed that the IE almost remains constant up to 5 days. Afterwards, the IE decreases. On the seventh day, the IE decreases from 98% to 92%. This is due to the fact that as the immersion period increases, the protective film formed on the metal surface, namely, Fe2+-SG complex, is broken by the aggressive chloride ions present in sea water and hence the IE decreases. Further, a competition arises between the formation of Fe2+-SG complex and FeCl2/FeCl3. As the immersion period increases, the formation of FeCl2/FeCl3 is favoured to Fe2+-SG complex at the anodic sites of the metal and hence the IE decreases [43].
Synergism parameters
Synergism parameter (SI) has been calculated to know the synergistic effect existing between two inhibitors [44-47]. Synergism parameter is calculated using the relation
where θ1+2 = (θ1 + θ2) - (θ1 * θ2), θ is the surface coverage of inhibitor (=IE%/100), and θ1 and θ2 are the surface coverage of inhibitor 1 and 2, respectively:
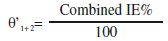
= combined surface coverage in presence of inhibitors 1 and 2.
When a synergistic effect exists between two inhibitors, the synergism parameter will be greater than 1. It is observed from Table 3, that the SI values are greater than 1.
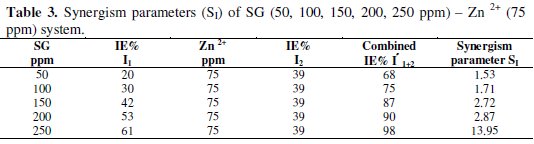
This confirms the synergistic effect existing between SG and Zn2+. As a model, the Zn2+ (75 ppm)-SG (50, 100, 150, 200 and 250 ppm) system has been selected to evaluate the synergism parameters.
Influence of N-cetyl-N, N, N-trimethylammoniam bromide (CTAB) on the corrosion inhibition efficiency of the SG-Zn2+ system
CTAB is a cationic surfactant. It is a biocide [37-39]. The influence of CTAB on the corrosion inhibition efficiency (IE %) of the SG (250 ppm) -Zn2+(75 ppm) system and also the influence of SG-Zn2+ system on the biocidal efficiency (BE) of the CTAB system have been evaluated by weight- loss method and also by calculating the number of colony-forming units. It is observed from Table 4 that the formulation consisting of 250 ppm of SG, 75 ppm of Zn2+ and 250 ppm of CTAB has 91% corrosion inhibition efficiency and 100% biocidal efficiency.
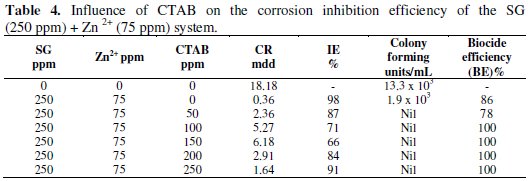
This formulation may find application in cooling water systems, if further research is carried out at high temperature under flow condition.
Potentiodynamic polarization study
Polarization study has been used to confirm the formation of a protective film on the metal surface [48-52]. If a protective film is formed on the metal surface, the linear polarization resistance value (LPR) increases and the corrosion current value (Icorr) decreases.
The polarization curves of carbon steel immersed in sea water in presence of the inhibitor system are shown in Fig. 2.
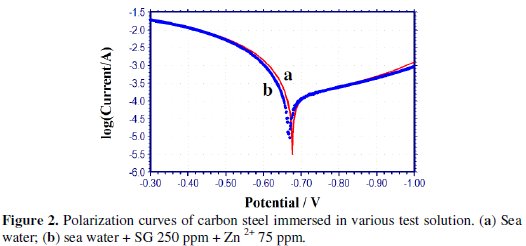
The corrosion parameters, namely corrosion potential (Ecorr), Tafel slopes (bc = cathodic; ba = anodic), LPR values and Icorr values are given in Table 5.
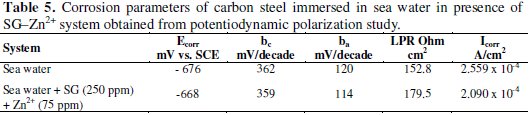
When the inhibitors, namely SG (250 ppm) + Zn2+ (75 ppm), are added to sea water, the corrosion potential of carbon steel shifts to the noble side (-676 to -668 mV vs. SCE). This indicates that a film is formed on the anodic sites of the metal surface. This film controls the anodic reaction of metal dissolution (Fe → Fe + 2 e-) by forming Fe-SG complex on the anodic sites of the metal surface. Formation of Fe3+-SG complex to some extent cannot be ruled out.
The formation of a protective film on the metal surface is further supported by the fact that the LPR value increases from 152.8 to 179.5 Ohm cm2 and the corrosion current decreases from 2.559 × 10⁻⁴ to 2.090 × 10⁻⁴ A/cm2. Thus, polarization study confirms the formation of a protective film on the metal surface.
AC impedance spectra
AC impedance spectra [Electro chemical impedance spectra] have been used to confirm the formation of a protective film on the metal surface [53-55]. If a protective film is formed on the metal surface, the charge transfer resistance (Rt) value increases; double layer capacitance value (Cdl) decreases and the impedance, log (z/Ohm), value increases. The AC impedance spectra of carbon steel immersed in sea water in the presence of the inhibitor system (SG-Zn2+) are shown in Figs. 3 to 5.
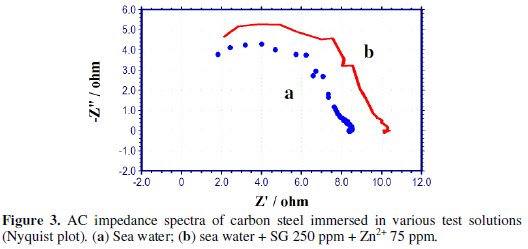
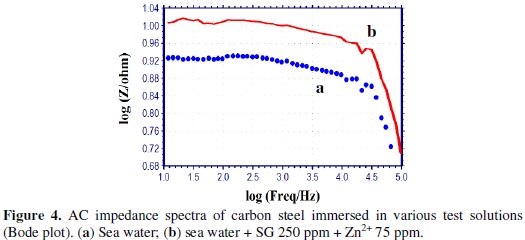
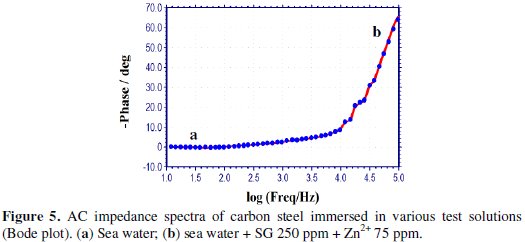
The Nyquist plots are shown in Fig. 3. The Bode plots are shown in Figs. 4 and 5. The corrosion parameters, namely, Rt, Cdl and impedance, log (z/Ohm), values are given in Table 6.
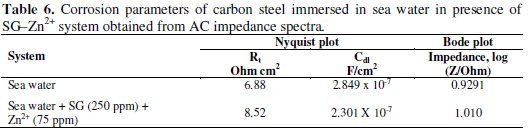
When the inhibitors [SG (250 ppm) + Zn2+(75 ppm)] are added to sea water, the Rt value increases from 6.88 to 8.52 Ohm cm2; the Cdl value decreases from 2.849 × 10⁻⁷ to 2.301 × 10⁻⁷ F/cm2; the impedance value increases from 0.9291 to 1.010.
These results lead to the conclusion that a protective film is formed on the metal surface.
FTIR spectra
FTIR spectra have been used to analyse the protective film formed on the metal surface [50, 56]. The FTIR spectrum (KBr) of pure SG is shown in Fig. 6a.
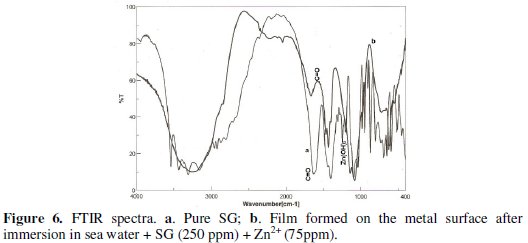
The C=O stretching frequency of the carboxyl group appears at 1631 cm-1.
The FTIR spectrum of the film formed on the metal surface after immersion in sea water containing 250 ppm of SG and 75 ppm of Zn2+ is shown in Fig. 6b.
The C=O stretching frequency has shifted from 1631 to 1564 cm-1. It is inferred that the oxygen atom of the carboxyl group has coordinated with Fe2+, resulting in the formation of Fe2+-SG complex, formed on the anodic sites of the metal surface. The peak at 3350 cm-1 is due to -OH stretching. The band due to Zn-O stretch appears at 1308 cm-1. These results confirm the presence of Zn(OH)2 deposited on the cathodic sites of the metal surface [57].
Thus, FTIR spectral study leads to the conclusion that the protective film consists of Fe2+-SG complex and Zn(OH)2.
Luminescence spectra
Luminescence spectra have been used to detect the presence of Fe2+-inhibitor complex formed on the metal surface [51, 57-59].
The luminescence spectrum (λex = 230 nm) of the Fe2+-SG complex solution, prepared by mixing aqueous solutions of Fe2+ (prepared freshly from FeSO4.7H2O) and SG, is shown in Fig. 7a.
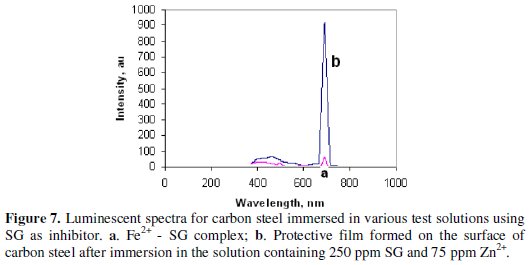
A peak appears at 690 nm.
The luminescence spectrum (λex = 230 nm) of the film formed on the metal surface after immersion in the solution confining 250 ppm of SG and 75 ppm of Zn2+ is shown in Fig. 7b. A peak appears at 691 nm. This indicates that the film present on the metal surface consists of Fe2+-SG complex. The slight variation in the position of the peak is due to the fact that the Fe2+-SG complex is entrailed in Zn(OH)2 present on the metal surface. Further, the increase in intensity of the peak is due to the fact that the metal surface after the formation of the protective film is very bright, and the film is very thin and there is enhancement in the intensity of the peak [59].
Atomic Force Microscopy
Atomic force microscopy is a powerful technique for the gathering of roughness statistics from a variety of surfaces [60]. AFM is becoming an accepted method of roughness investigation [61]. All atomic force microscopy images were obtained on PicoSPM I Molecular Imaging, USA, AFM instrument operating in contact mode in air. The scan size of all the AFM images is 30 μm x 30 μm area at a scan rate of 2.4 lines per second.
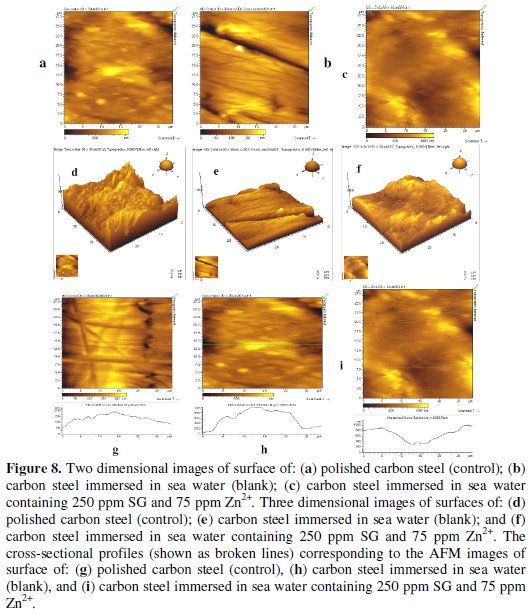
The two-dimensional and three-dimensional AFM morphologies and the AFM cross sectional profile for polished carbon steel surface (reference sample), carbon steel surface immersed in sea water (blank sample) and carbon steel surface immersed in sea water containing 250 ppm SG and 75 ppm Zn2+ are shown in Fig. 8 (a,d,g), (b,e,h), (c,f,i), respectively.
Root mean square roughness, average roughness, and peak to valley value
AFM image analysis was performed to obtain the average roughness, Ra (the average deviation of all points roughness profile from a mean line over the evaluation length), the root-mean-square roughness, Rq (the average of the measured height deviations taken within the evaluation length and measured from the mean line) and the maximum peak to valley (P-V) height values (largest single peak-to-valley height in five adjoining sampling heights) [62]. Rq is much more sensitive than Ra to large and small height deviations from the mean [63]. Table 7 is a summary of the average roughness Ra, rms roughness (Rq), and maximum peak to valley height (P-V) value for carbon steel surface immersed in different environments.

The values of Rq, Ra and P-V height for the polished carbon steel surface (reference sample) are 262 nm, 211 nm and 1200 nm, respectively. This shows that the surface is more homogenous, with some places where the height is lower than the average depth. Fig. 8 (a, d, g) displays the non-corroded metal surface. The slight roughness observed on the polished carbon steel surface is due to atmospheric corrosion. The rms roughness, average roughness and P-V height values for the carbon steel surface immersed in sea water are 765 nm, 645 nm and 3700 nm, respectively. These values suggest that carbon steel surface immersed in sea water has a greater surface roughness than the polished metal surface, indicating that the unprotected carbon steel surface is rougher due to the corrosion of carbon steel in sea water environment. Fig. 8. (b, e, h) displays corroded metal surface with few pits.
The formulation consisting of 250 ppm SG and 75 ppm Zn2+ in sea water shows Rq value of 470 nm and the average roughness is significantly reduced to 386 nm when compared with 645 nm for carbon steel surface immersed in sea water. The maximum peak to valley height was also reduced to 2200 nm. These parameters confirm that the surface appears smoother. The smoothness of the surface is due to the formation of a protective film of Fe2+-SG complex and Zn(OH)2 on the metal surface thereby inhibiting the corrosion of carbon steel. The above parameters are also somewhat greater than the AFM data of polished metal surface, which confirms the formation of a film on the metal surface, which is protective in nature.
Mechanism of corrosion inhibition
Analysis of the results of weight-loss method reveals that the formulation consisting of sea water, 250 ppm of SG and 75 ppm of Zn2+ offers an IE of 98%. Results of polarization study suggest that the formulation functions as cathodic inhibitor. The AC impedance spectral studies indicate that a protective film is formed on the metal surface. FTIR spectra reveal that the protective film consists of Fe2+-SG complex and Zn(OH)2.
In order to explain all these observations in a holistic way, the following mechanism of corrosion inhibition is proposed.
-When carbon steel specimen is immersed in an aqueous solution, the anodic reaction is
and the cathodic reaction is
-When the system containing 250 ppm of SG and 75 ppm of Zn2+ is prepared, there is formation of Zn2+-SG complex
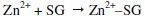
-When carbon steel is immersed in the solution, the Zn2+-SG diffuses from the bulk of the solution to the metal surface.
-On the surface of metal, Zn2+-SG complex is converted into Fe2+-citrate complex at the local anodic regions. The stability of Fe2+-SG complex is higher than the corresponding zinc complex

-The released Zn2+ ions combine with OH- ions to form Zn(OH)2 on the cathodic sites
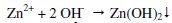
Thus the protective film consists of Fe2+-SG complex and Zn(OH)2.
Conclusions
The present study leads to the following conclusions:
-A synergistic effect exists between SG and Zn2+ in controlling corrosion of carbon steel immersed in sea water.
-The formulation consisting of 250 ppm of SG and 75 ppm offers 98% IE.
-Polarization study suggests that the combination of SG and Zn2+ functions as an anodic inhibitor.
-AC impedance spectra reveal that a protective film is formed on the metal surface.
-FTIR spectra show that the protective film consists of Fe2+-SG complex and Zn(OH)2.
-The IE of inhibitor formulation depends on the ability of the inhibitor to form complex with Zn2+ and ability of Fe2+ to react with Zn2+ to form iron complex.
-This formulation may find applications in cooling water systems.
-AFM images and luminescent spectra confirm the formation of a protective layer on the metal surface.
-The synergistic formulation with 250 ppm of CTAB has 91% corrosion inhibition efficiency and 100% biocidal efficiency.
References
1. Gunasekaran G, Dubey BI, Rangarajan J. Def Sci J. 2005;55:51. [ Links ]
2. Ibrahim MAM, Abd El Rehim SS, Abd El Wahaab SM, et al. Plat Surf Finish. 1999;86:69. [ Links ]
3. Oguzie EE, Akalezi CO, Enenebeaku CK, et al. Chem Eng Commun. 2011;198:46. [ Links ]
4. Gharahcheshmeh MH, Sohi MH. J Appl Electrochem. 2010;40:1563. [ Links ]
5. Abboud Y, Abourriche A, Saffaj T, et al. Desalination. 2009;237:175. [ Links ]
6. Oguzie EE. Chem Eng Commun. 2009;196:591. [ Links ]
7. Demadis KD, Papadaki M, Raptis RG, et al. Chem. Mater. 2008;20:4835. [ Links ]
8. Yazdzad AR, Shahrabi T, Hosseini MG. Mater Chem Phys. 2008;109:199. [ Links ]
9. Shahrabi T, Yazdza A, Hosseini M. J Mater Sci Technol. 2008;24:427. [ Links ]
10. Selvi JA, Rajendran A, Amalraj AJ. Indian J Chem Technol. 2007;14:382. [ Links ]
11. Dhanalakshmi J, Arockiaselvi J, Amalaraj AJ, et al. Trans Soc Adv Electrochem Sci Technol. 2006;41:57. [ Links ]
12. Santos LMM, Lacroix JC, Ching KIC, et al. J Electroanal Chem. 2006;587:67. [ Links ]
13. Sowska AT, Kruszynski R. Pol J Chem. 2005;79:1155. [ Links ]
14. Rashwan SM, El-Maksoud SAA, El-Wahaab SMA, et al. Bull Electrochem. 2005;21:199. [ Links ]
15. Chambers BD, Taylor SR, Kendig MW. Corrosion. 2005;61:480. [ Links ]
16. Holmberg VC, Rasch MR, Korgel BA. Langmuir. 2010;26:14241. [ Links ]
17. Madani A, Nessark B, Brayner R, et al. Polymer. 2010;51:2825. [ Links ]
18. Boisier G, Lamure A, Pebere N, et al. Surf Coat Technol. 2009;203:3420. [ Links ]
19. Spah M, Spah DC, Deshwal B, et al. Corros Sci. 2009;51:1293. [ Links ]
20. Gabr IM, El-Asmy HA, Emmana MS, et al. Transition Met Chem. 2009;34:409. [ Links ]
21. Dudukcu M, Udum YA, Ergun Y, et al. J Appl Polym Sci. 2009;111:1496. [ Links ]
22. Okafor PC, Liu CB, X. Liu X, et al. J Appl Electrochem. 2009;39:2535.
23. Quartarone G, Battilana M, Bonaldo L, et al. Corros Sci. 2008;50:3467. [ Links ]
24. Cao YQ, Zhang Z, Guo YX. J Chem Technol Biotechnol. 2007;83:1441. [ Links ]
25. Xia MZ, Wang FY, Lei W, et al. Acta Petrolei Sinica. 2008;24:460. [ Links ]
26. Romanszki L, Telegdi J, Kalman E. Colloids Surf A. 2008;321:20. [ Links ]
27. Jacques S, Rocca E, Stebe MJ, et al. Surf Coat Technol. 2008;202:3878. [ Links ]
28. Xia M, Wang F, Lei W, et al. J Chem Ind Eng. 2008;59:982. [ Links ]
29. Zhou L, Yan J, Gao X. Petroleum Proc Petrochem. 2008;39:63. [ Links ]
30. Matulkova I, Nemec I, Teubner K, et al. J Mol Struct. 2008;873:46. [ Links ]
31. Abulkibash A, Khaled M, El Ali B, et al. Arab J Sci Eng. 2008;33:29. [ Links ]
32. Ochoa N, Pebere N, Tribollet B. ECS Trans. 2006;1:207. [ Links ]
33. Quartarone G, Bonaldo L, Tortato C. Appl Surf Sci. 2006;252:8251. [ Links ]
34. Ein-Eli Y, Auinat M. Meeting Abstracts MA. 2005;2005-02:584.
35. Yurt A, Bereket G, Ogretir C. J Mol Struct: THEOCHEM. 2005;725:215. [ Links ]
36. Wranglen G. Introduction to corrosion and protection of metals. London, UK: Chapman and Hall; 1985. P.236. [ Links ]
37. Shanthy P, Rengan P, Chelvan AT, et al. I J Chem Tech. 2009;16. [ Links ]
38. Rajendran S, Apparao BV,Palaniswamy N. J Electrochem Soc India. 1999;48:89. [ Links ]
39. Rajendran S, Apparao BV, Palaniswamy N. Bull Electrochem. 1997;13:441. [ Links ]
40. Holness RJ, Williams G, Worsley DA et al. J Electrochem Soc. 2005;152:B73. [ Links ]
41. Telegdi J, Shaglouf MM, Shaban A, et al. Electrochim Acta. 2001;46:3791. [ Links ]
42. Selvi JA, Rajendran S, Jeyasundari J. Zastita Materijala. 2009;50:91. [ Links ]
43. Selvaraj SK, Kennedy AJ, Amalraj AJ, et al. Corros Rev. 2004;22:219. [ Links ]
44. Gomma GK. Mater Chem Phys. 1998;55:241. [ Links ]
45. Aramaki K, Hackerman N. J Electrochem Soc. 1969;116:568. [ Links ]
46. Quraishi MA, Rawat J, Ajmal M. Corrosion 1999;55:919. [ Links ]
47. Kanimozhi SA, Rajendran S. Int J Electrochem Soc. 2009;4:353. [ Links ]
48. Roque JM, Pandiyan T, Cruz J, et al. Corros Sci. 2008;50:614. [ Links ]
49. Benali O, Larabi L, Traisnel M, et al. Appl Surf Sci. 2007;253:6130. [ Links ]
50. Amar H, Braisaz T, Villemin D, et al. Mater Chem Phys. 2008;110:1. [ Links ]
51. J. Arockia Selvi, Susai Rajendran, V. Ganga Sri, A. John Amalraj, B. Narayanasamy, Port Electrochim Acta. 2009;27:1.
52. Rajendran S, Paulraj J, Rengan P, et al. J Dent Oral Hyg. 2009;1:001.
53. Zhang S, Tao Z, Li W, et al. Appl Surf Sci. 2009;255:6757. [ Links ]
54. Heakal FT, Fouda AS, Radwan MS. Mater Chem Phys. 2011;125:26. [ Links ]
55. Rajendran S, Devi MK, Regis APP, et al. Zastita materijala. 2009;50:131. [ Links ]
56. Sathiyabama J, Rajendran S, Selvi JA, et al. Open Corros J. 2009;2:76. [ Links ]
57. Kalaivani R, Narayanaswamy B, Selvi JA, et al. Port Electrochim Acta. 2009;27:177. [ Links ]
58. Rajendran S, Apparao BV, Palaniswamy N. J Electrochem Soc, India. 1998;47:43. [ Links ]
59. Rajendran S., Apparao BV, Palaniswamy N. Anti-Corros Met Mater. 1996;46:23 [ Links ]
60. Vera R, Schrebler R, Cury P, et al. J Appl Electrochem. 2007;37:519. [ Links ]
61. Dumas Ph, Butfffakhreddine B, Am C, et al. Europhys Lett. 1993;22:717. [ Links ]
62. Thomas TR. Rough surfaces. New York: Longman; 1982. [ Links ]
63. Stout KJ, Sullivan PJ, Mc Keown PA. Annals CRIP. 1992;41:621. [ Links ]
*Corresponding author. E-mail address: sennikavi@yahoo.co.in
Received 19 May 2012; accepted 27 June 2013

