


Serviços Personalizados
Journal
Artigo
 Inglês (pdf)
 Artigo em XML
 Referências do artigo
 Enviar este artigo por email
Indicadores
-
 Citado por SciELO
 -
 Acessos
Links relacionados
-
 Similares em
SciELO
Similares em
SciELO
Compartilhar

 Permalink
Portugaliae Electrochimica Acta
versão impressa ISSN 0872-1904
Port. Electrochim. Acta vol.31 no.1 Coimbra jan. 2013
https://doi.org/10.4152/pea.201301011
Corrosion Behavior of Electroless Ni-P-TiO2 Nanocomposite Coatings and Optimization of Process Parameters Using Taguchi Method
J. Hosseini* and A. Bodaghi
Department of Chemistry, Toyserkan Branch, Islamic Azad University, Toyserkan, Iran
Abstract
This paper reports an experimental study of corrosion characteristics of electroless NiP- TiO2 nanocomposite coatings. Coating process parameters are optimized for maximum corrosion resistance based on L9 Taguchi orthogonal design with four process parameters, viz., concentration of nickel source solution, concentration of reducing agent, concentration of TiO2 powder and bath temperature. Corrosion behavior of the electroless Ni-P-TiO2 nanocomposite coatings was evaluated in 3.5 wt.% NaCl aqueous solution by using polarization technique. Scanning electron microscope (SEM) and Energy dispersive X-ray spectroscopy (EDS) analysis were used for studying the surface morphology and chemical composition of the electroless Ni-P-TiO2 nanocomposite coatings. The results showed that incorporation of TiO2 in coating causes increasing of corrosion resistance and improves surface morphology. Finally, optimum conditions were achieved as, concentration of nickel source solution: 50 g L-1 , concentration of reducing agent: 10 g L-1, concentration of TiO2 powder: 10 g L-1, and bath temperature of 85 °C.
Keywords: electroless Ni-P-TiO2; nanocomposite; Taguchi method; corrosion resistance; polarization measurements.
Introduction
Electroless Ni-P coatings, first developed by Brenner and Riddell [1], have found extensive use in mechanical, chemical and electronic industries [2] due to their excellent mechanical, physical, electrical, corrosion, and tribological properties. Another advantage is that Electroless Ni-P coatings can be applied to a variety of substrate materials and uniformly on intricate part geometries. Electroless Ni-P coating is an autocatalytic deposition of a Ni-P alloy from an aqueous solution on a substrate without application of electric current. The electroless bath typically comprises an aqueous solution of metal ions, complexing agents, reducing agents and stabilizers, operating in a specific metal ion concentration, temperature and pH ranges. The rate of deposition and properties of coatings depend on a number of factors such as the type and concentrations of the reducing agent, stabilizer, pH of solution, the temperature of the bath, etc. Electroless Ni-P is a barrier coating that protects the substrate by sealing it from the environment. Because of its amorphous nature and passivity, the corrosion resistances of the coatings are excellent and in many environments are superior to that of pure nickel or chromium alloys [2, 3]. Corrosion resistance of an electroless Ni-P coating is a function of its chemical composition and in particular the phosphorous content [4-8]. Despite a good number of studies on electroless Ni-P coatings particularly on corrosion resistance properties [9-13], an extensive review of the literature reveals that no report is available on optimization of the process parameters of electroless Ni-P-TiO2 coating to have maximum corrosion resistance. This study deals with the application of the Taguchi method to determine the optimum coating process parameters in order to obtain maximum corrosion resistance. Based on the Taguchi orthogonal, experiments were designed with four design parameters, namely, concentration of nickel source solution, concentration of reducing agent, concentration of TiO2 powder and bath temperature. All the parameters were selected in three levels as maximum, minimum and middle levels.
Experimental details
Coating deposition
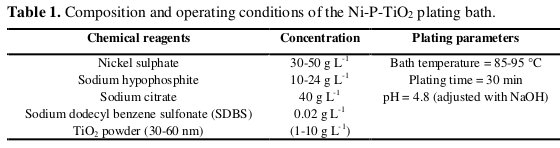
Copper sheets of size 10 mm × 10 mm × 1 mm were used as the substrate material for the deposition of the electroless Ni-P-TiO2 coating. Before electroless plating, the copper substrates were polished mechanically to mirror finish with 3000 grit SiC paper, degreased in a 30% NaOH solution for 10 min, washed with distilled water, and dried in air. All specimens were etched in a 10% sulfuric acid solution for 2 min and then rinsed with deionized water and acetone. The bath composition and operating conditions used for preparing electroless NiP- TiO2 coatings were given in Table 1.
The TiO2 (Merck, 50 nm) particles were used as the composite particles.
All chemicals were of analytical reagent grade (Merck). The surface morphology of the Ni-P-TiO2 coatings was analyzed using a Philips XL30 scanning electron microscope (SEM). The coating compositions were analyzed by an energy dispersive X-ray (EDX) apparatus attached to the SEM. Each sample was measured at different locations to confirm uniformity.
Electrochemical experiments were carried out using a Princeton Applied Research, EG&G PARSTAT 2263 Advanced Electrochemical system run by PowerSuite software. A standard three-electrode cell arrangement was used in all experiments. A platinum sheet of the geometric area of about 20 cm2 was used as counter electrode, while all potentials were measured with respect to a commercial saturated calomel electrode (SCE). After the electrochemical testing system became stable in 3.5% NaCl solution (about 60 min), Tafel polarization tests were recorded in a potential range of E = corrosion potential (Ecorr) ± 200 mV with a scan rate of 0.2 mV s-1.
Taguchi design of experiment
Design of orthogonal array and signal-to-noise analysis
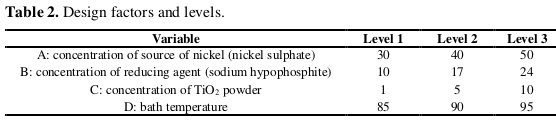
Taguchi technique [14, 15] is a powerful tool for design of high quality systems based on orthogonal array experiments that provide much-reduced variance for the experiments with an optimum setting of process control parameters. It introduces an integrated approach that is simple and efficient to find the best range of designs for quality, performance and computational cost. This method achieves the integration of design of experiments (DOE) with the parametric optimization of the process yielding the desired results. The orthogonal array (OA) requires a set of well-balanced (minimum experimental runs) experiments. Four factors (concentration of nickel source solution, concentration of reducing agent, concentration of TiO2 powder and bath temperature) with three levels were selected and are shown in Table 2.
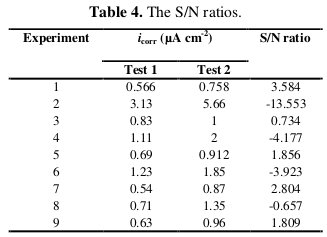
The factors and levels were used to design an orthogonal array L9 (34) for experimentation. The nine Taguchi experiments were conducted twice to ensure the reliability of experimental data for a signal-tonoise (S/N) analysis. The S/N ratio consolidates several repetitions into one value which reflects the amount of variation present. This is because the S/N ratio can reflect both the average and the variation of the quality characteristics. It is defined as the ratio of the mean (signal) to the standard deviation (noise). The ratio depends on the quality characteristics of the product/process to be optimized. The three categories of S/N ratios are used [15]: lower is best (LB), higher is best (HB) and nominal is best (NB). In the present study, corrosion current density (icorr) is treated as a characteristic value. The parameters were optimized with an objective to minimize the icorr. Therefore, the S/N ratio for LB characteristics was selected, which can be calculated as follows:
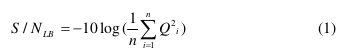
where n is the repetition number of each experiment under the same condition for design parameters, and Qi is the corrosion current density (icorr) of an individual measurement at the ith test. After calculating and plotting the mean S/N ratios at each level for various factors, the optimal level, that is the largest S/N ratio among all levels of the factors, can be determined.
Analysis of variance (ANOVA)
ANOVA is a statistical technique, which can infer some important conclusions based on analysis of the experimental data. The method is very useful for revealing the level of significance of influence of factor(s) or interaction of factors on a particular response. It separates the total variability of the response into contributions of each of the factors and the error [16, 17]. ANOVA table shows the sum of the square (SS), the degree of freedom (D), the variance (V), corrected sum of squares (SSNj) and the percentage contribution of each parameter (P) [15].
Results and discussion
Tafel polarization studies
Tafel extrapolation (linear parts of anodic and cathodic branches) of the curves about ±50 mV versus OCP was used in PowerSuite software for determination of the corrosion current density. The structure of the Taguchi's orthogonal array design and the results of the Tafel polarization measurements for the different coatings on Cu are given in Table 3, which also includes data for the substrate for the purpose of comparison.
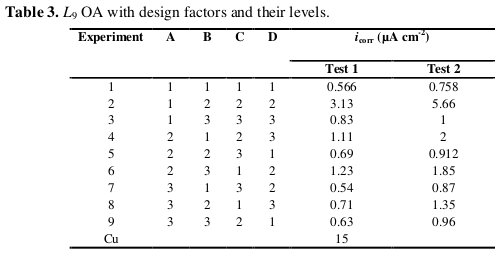
All coated samples have a higher corrosion resistance than the Cu substrate.
Determination of optimal levels
Based on Eq. (1), two corrosion current density measurements for each experiment were converted into an S/N ratio. Table 4 compares the calculated mean S/N ratios with the corrosion current density data.
The mean S/N ratio for each level of the factors A, B, C and D is summarized and called the S/N response table for corrosion current density (Table 5).
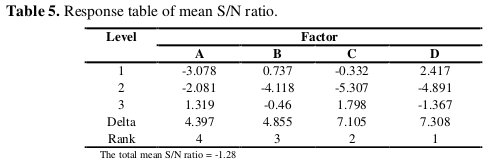
In addition, the total mean S/N ratio for the 9 experiments is also calculated and listed in Table 5. The response table shows the average of the selected characteristic for each level of the factors. The response table includes ranks based on Delta statistics, which compare the relative magnitude of effects. The Delta statistic is the highest average for each factor minus the lowest average for the same. Ranks are assigned based on Delta values; rank 1 is assigned to the highest Delta value, rank 2 to the second highest Delta value, and so on. The corresponding main effect and interaction effect plots between the process parameters are also shown in Fig.s 1 and 2, respectively.
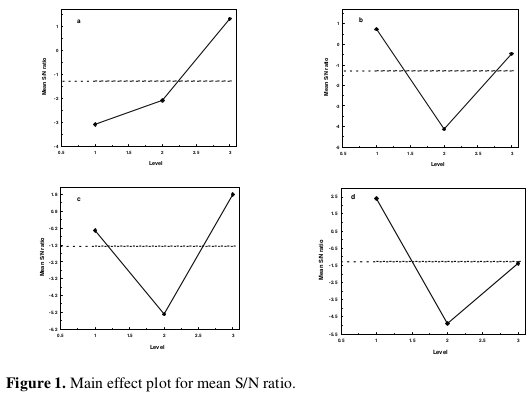
In the main effect plot if the line for a particular parameter is near horizontal, then the parameter has no significant effect.
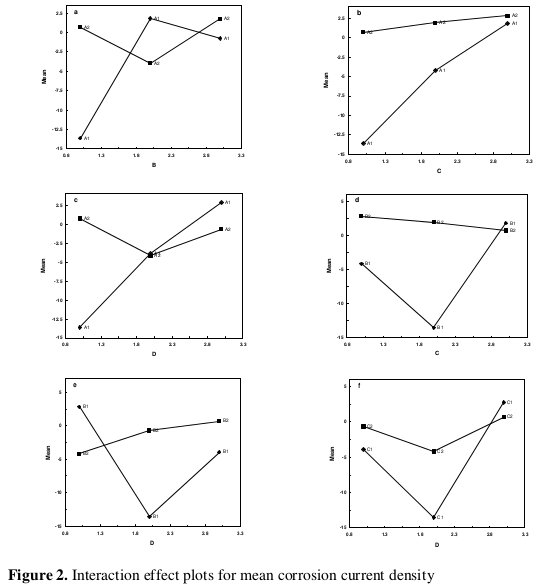
On the other hand, a parameter for which the line has the highest inclination will have the most significant effect. It is very much clear from the main effect plot that parameters C (concentration of TiO2 powder) and D (bath temperature) are the most significant parameters, while parameters A (concentration of nickel source solution) and B (concentration of reducing agent) have relatively less significant influence (Fig. 1). As far as the interaction plots are concerned, estimating an interaction means determining the non-parallelism of parameter effects. Thus, if the lines on the interaction plots are non-parallel, interaction occurs, and if the lines cross, strong interaction occurs between parameters.
From Fig. 2, it can be seen that there is strong interaction between the parameters A and B, while there is moderate interaction between the parameters B and D and weak interaction between B and C. Thus from the present analysis it is clear that D (bath temperature) and C (concentration of TiO2) powder) are the most influencing parameters for corrosion current density (icorr). The optimal process parameter combination for minimum corrosion current density is obtained as A3B1C3D1 (concentration of nickel source solution = 50 g L-1, concentration of reducing agent = 10 g L-1 , concentration of TiO2 powder = 10 g L-1, bath temperature = 85 °C).
Factor contributions
The contribution of each factor to the corrosion current density can be determined by performing analysis of variance (ANOVA). The results of analysis of variance (ANOVA) are summarized in Table 6.
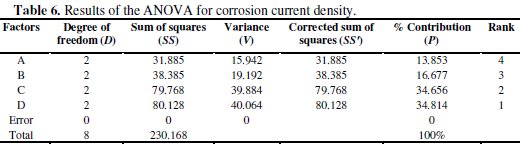
The data given in Table 6 show that the contribution of the four factors, i.e., concentration of nickel source solution, concentration of reducing agent, concentration of TiO2 powder and bath temperature is 13.853%, 16.677%, 34.656% and 34.814%, respectively. It is evident that, among the selected factors, bath temperature has the major influence on the coating parameters for corrosion resistance.
By ranking their relative contributions, the sequence of the four factors affecting the corrosion current density is bath temperature, concentration of TiO2 powder, concentration of reducing agent and concentration of nickel source solution. It is also worthwhile mentioning that, in the ANOVA analysis, if the percentage error (Pe) contribution to the total variance is lower than 15%, no important factor is missing in the experimental design. In contrast, if the percent contribution of the error exceeds 50%, certain significant factors have been overlooked and the experiments must be re-designed [18]. As shown in Table 6, the percentage error (Pe) is 0%. This indicates that no significant factors are missing in the experimental design.
Confirmation run
The confirmation experiment is the final step in verifying the conclusions from the previous round of experimentation. If the results of the confirmation runs are not consistent with the expected conclusions, a new Taguchi method design is required. The confirmation experiment was performed by setting the experimental condition of the four factors as: 85 °C for bath temperature; and 50, 10 and 10 g L-1 for the concentrations of nickel sulphate, sodium hypophosphite and TiO2 powder, respectively.
Fig. 3 shows the Tafel polarization curves of the coated sample from the confirmation run and from the pure copper substrate.
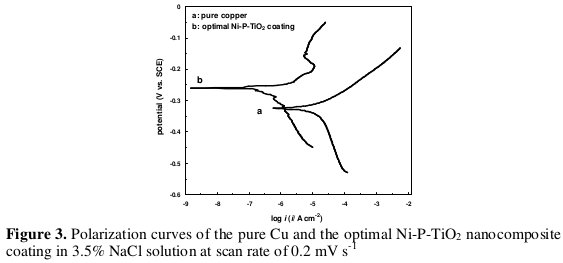
It can be seen from Fig. 3 that the corrosion potential (Ecorr) of the optimized coating is more positive (-0.26 V) than that of the Cu substrate (-0.324 V), and the corrosion current density of the coating (0.34 μA cm-2) is lower than that of the Cu substrate (15 μA cm-2). Thus the coating could be corroded only at a relatively higher potential and with a lower corrosion rate than the Cu substrate.
Table 7 gives the detailed results from the confirmation run on the optimized coating as well as from the substrate.
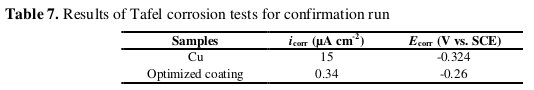
Thus the corrosion resistance of the optimized coating is about 15 times higher than that of the substrate.
Surface morphology and composition
Fig. 4 shows the SEM micrographs of the pure copper substrate and the coating surfaces deposited at optimal combination of the parameters A, B, C and D.
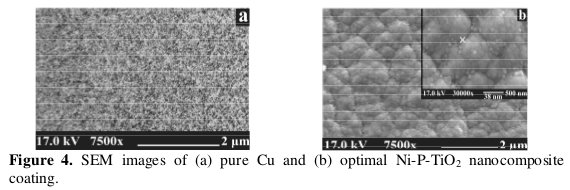
The surface morphology of optimized Ni-P-TiO2 coating is different compared with pure copper. From the SEM micrographs of these surfaces, it is seen that there are many globular particles on the surface of the Ni-P-TiO2 coating. The Ni-P-TiO2 nanocomposite coating shows smoother surface, more uniform and compact in appearance compared to that of pure Cu, which indicates that the codeposited TiO2 nanoparticles were uniformly distributed in the Ni-P matrix of nanocomposite coating (Fig. 4b).
Fig. 5 shows the results of EDX component analysis of the pure Cu substrate and Ni-P-TiO2 nanocomposite coating deposited from optimal condition.
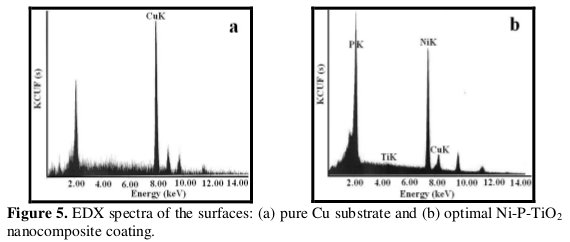
The peaks of nickel, phosphorous and titanium are quite specific (Fig. 5b). The weight percentages of Cu, Ni, P and Ti are listed in Table 8.
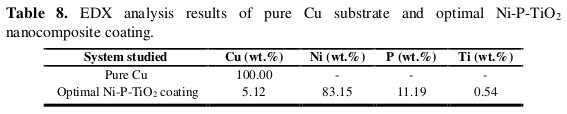
They support the idea that the TiO2 particles have been incorporated into the Ni-P coatings successfully.
Conclusions
Taguchi orthogonal array is employed to optimize the coating process parameters with respect to corrosion behavior of electroless Ni-P-TiO2 nanocomposite coatings against copper. It is seen that bath temperature and concentration of TiO2 powder have the most significant influence in controlling corrosion characteristics of electroless Ni-P-TiO2 coating. The optimal coating parameter combination for minimum corrosion is obtained as A3B1C3D1. SEM study showed that Ni-P-TiO2 coatings are smooth and composed of discrete TiO2 nanoparticles with the crystallite size of about 38 nm. The corrosion resistance of the optimized coating is more than 15 times better than that of the pure copper substrate.
References
1. Brenner A, Riddell GE. Nickel plating by chemical reduction. US Patent: US2532282; 1950. [ Links ]
2. Riedel W. Electroless Plating. Ohio: ASM International; 1991. [ Links ]
3. Baudrand DW. Electroless nickel plating, surface engineering. ASM Hand Book, Vol. 5. Material Park, Ohio: American Society for Materials; 1994. P. 290. [ Links ]
4. Allen RM, Vandersande JB. Scripta Metall. 1982;16:1161. [ Links ]
5. Berkh O, Eskin S, Zahavi J. Met Finish. 1996;94:35. [ Links ]
6. Baudrand D, Bengston J. Met Finish. 1995;93:55. [ Links ]
7. Agarwala RC, Agarwala V. Sadhana. 2003;28:475. [ Links ]
8. Hur KH, Jeong JH, Lee DN. J Mater Sci. 1990;25:2573. [ Links ]
9. Farzaneh A, Ehteshamzadeh M, Mohammadi M. J Appl Electrochem 2010;41:19. [ Links ]
10. Sankara Narayanan TSN, Baskaran I, Krishnaveni K, Parthiban S. Surf Coat Technol. 2006;200:3438. [ Links ]
11. Lu G, Zangari G. Electrochim Acta. 2002;47:2969. [ Links ]
12. Yang Z, Xu H, Shi Y-L et al. Mater Res Bull. 2005;40:1001. [ Links ]
13. Lo P-H, Tsai W-T, Lee J-T, Hung M-P. Surf Coat Technol. 1994;76:27. [ Links ]
14. Taguchi G. Introduction to quality engineering. Tokyo: Asian Productivity Organization; 1990. [ Links ]
15. Ross PJ. Taguchi techniques for quality engineering. 2nd ed. New York: McGraw Hill; 1996. [ Links ]
16. Roy R. A primer on the Taguchi method. New York: Van Nostrand Reinhold; 1990. [ Links ]
17. Park SH. Robust design and analysis for quality engineering. London, UK: Chapman and Hall; 1996. [ Links ]
18. Ma Y, Nie X, Northwood D, Hu H. Thin Solid Films. 2006;494:296. [ Links ]
Acknowledgement
This research was supported by the Islamic Azad University, Toyserkan Branch, Toyserkan, Iran. Also, the authors would like to acknowledge the financial support of the Office in Charge of Research of Iranian Nanotechnology Society and the financial support of the Office of Vice chancellor in charge of research of University of the Islamic Azad of Toyserkan Branch.
*Corresponding author. E-mail address: javadhosseini89@yahoo.com
Received 10 July 2012; accepted 19 January 2013

