


Services on Demand
Journal
Article
 English (pdf)
 Article in xml format
 Article references
 Send this article by e-mail
Indicators
-
 Cited by SciELO
 -
 Access statistics
Related links
-
 Similars in
SciELO
Similars in
SciELO
Share

 Permalink
Portugaliae Electrochimica Acta
Print version ISSN 0872-1904
Port. Electrochim. Acta vol.30 no.3 Coimbra May 2012
https://doi.org/10.4152/pea.201203203
Corrosion Study of Electroless Ni-P-W Coatings Using Electrochemical Impedance Spectroscopy
Supriyo Roy and Prasanta Sahoo*
Department of Mechanical Engineering, Jadavpur University, Kolkata 700032, India
Abstract
The present study investigates the significance of different coating process parameters on the corrosion behaviour of electrolessly deposited Ni-P-W coatings on mild steel substrate. The process parameters considered are concentration of nickel source, concentration of reducing agent, concentration of tungsten source and annealing temperature. The corrosion characteristic is evaluated by electrochemical impedance spectroscopy technique. The responses considered are charge transfer resistance and double layer capacitance. The Taguchi technique coupled with grey analysis is employed to find out the optimum combination of the process parameters for better corrosion resistance. Analysis of variance (ANOVA) reveals the contribution of the process parameters on the corrosion property of Ni-P-W coating. Finally a validation test is performed to justify the experimental result. The microstructure of the surface is studied by scanning electron microscopy (SEM); energy dispersive x-ray analysis (EDX) reveals the chemical composition and the x-ray diffraction analysis (XRD) is used to identify the phase transformation behaviour of the coating.
Keywords: electrochemical impedance spectroscopy, corrosion, Ni-P-W coating, optimization.
Introduction
Different properties of the external surface of any engineering material, like corrosion resistance, hardness, etc., can be enhanced by coatings for a quite long period of time. The coating protects the substrate materials from the environmental hazards by creating a barrier between the material and the environment. Among all the coating processes, the electroless plating process is considered the most convenient one due to its simplicity and enhanced properties like improved friction, wear and anti-corrosion resistance. According to the classic corrosion theory, nanocrystalline materials should have very poor corrosion resistance because their huge quantity of grain boundaries, acting as the preferential corrosion paths, can accelerate corrosion by forming large number of micro electrochemical cells with the matrix. The basic hypophosphite reduced Ni-P and borohydride reduced Ni-B coatings have proved their supremacy in providing improved hardness, corrosion and wear resistance [1-5].
The corrosion resistance of electroless Ni-P coatings is very much dependent on the phosphorous content of the coating. Electroless Ni-high P coating is effective in offering an excellent protection, whereas electroless Ni-low P and Ni-medium P coatings are not recommended for severe environments [6]. It is obvious that increase in coating porosity decreases the corrosion resistance of the coating. The important factor that affects the coating porosity and ultimates resistance to corrosion attack is surface roughness which is influenced by mechanical preparation of the surface and electroless nickel coating process procedure [7]. Advances in the chemical tailorability of composite coatings have lead to create long-lived, corrosion-resistant, composite coatings. Recently, much attention is being paid towards composite electroless nickel plating. The properties of composite electroless nickel coatings are often superior to those of basic Ni-P and Ni-B [2]. The functional composite coatings with specific characteristics such as wear, corrosion resistances and/or high hardness can be produced easily by choosing suitable particulate materials. The traditional electroless composite coatings have been prepared by adding micro-meter particles to an electroless bath such as SiC, BN, PTFE, diamond [8]. Bigdeli and Allahkaram [6] even found the corrosion resistance of Ni-P-SiC coating better than that of plain Ni-P coating. This effect they ascribed to a reduction in the effective metallic area available for corrosion in Ni-P-nano SiC coating. They also observed that heat- treatment at 400 °C for 1 h significantly improved the coating density and structure, giving rise to an enhanced corrosion resistance for the applied binary electroless nickel and electroless nickel composite coatings. Newly developed Ni-P alloy coatings have been recently reported by the introduction of a third element such as tungsten to form ternary Ni-P-W [9-12]. Published data showed that inclusion of tungsten in binary Ni-P deposit positively affects the deposition rate, composition and deposit properties such as hardness, thermal stability, wear, corrosion resistance and melting point [11]. Compared to electroless Ni-P coatings, incorporation of a third element into Ni-P based coating, for instance, electroless Ni-W-P coatings, significantly influence the thermal stability and crystallization behavior of the coatings by suppression of Ni3P nucleation [12]. Ni-W-P coatings also exhibit higher wear resistance [13]. However, the influence of addition of W on corrosion resistance has been reported by various researchers. Palaniappa and Seshadri [14] reported that improved corrosion resistance (non-deaerated condition) was found with increasing the W content in electroless Ni-P matrix. It was also reported that the corrosion behavior of the electroless Ni-P plating in 0.5 M H2SO4 solution was improved by addition of W, due to the formation of protective films of W oxides [15]. In addition, Gao et al. [16] reported a comparative study for electroless Ni-P and Ni-W-P coatings, when the coatings were heat-treated at 300 °C and 350 °C, respectively, to form a single-Ni nanocrystalline structure, the coatings presented different corrosion performances. The binary Ni-P nanostructure itself was harmful to the corrosion resistance. However, the addition of a third passivation element, W, significantly improved the corrosion resistance of the alloys due to the huge amount of grain boundary diffusion paths provided by the nanostructure, which favored the formation of the dense tungsten oxide film on the surface. It was found that the annealed ternary Ni-W-P alloys had corrosion resistance higher than their amorphous counterpart. Corrosion resistance of an electroless Ni-P-W coating is a function of its chemical composition and post deposition heat treatment. As corrosion is a deteriorating phenomenon so it is needed to optimize the chemical composition to have a better corrosive property.
The studies of the corrosion behaviour of electroless nickel coating are mainly conducted through electrochemical tests viz. potentiodynamic polarization studies and electrochemical impedance spectroscopy. The resistance of the coatings towards corrosion is evaluated on the basis of the corrosion parameters obtained from these studies viz. corrosion potential, corrosion current density, charge transfer resistance, double layer capacitance, corrosion rate, etc. [17-19]. The electrochemical impedance spectroscopy (EIS) technique has proven to be a valuable test method for the electrochemical characterization of the protective coating on metals. This method provides very detailed data on the effectiveness of a coating over a relatively small area. The EIS technique can indicate the presence and rate of corrosion, and the moisture content of the coating prior to corrosion [20]. Thus, the EIS technique is chosen to characterize the corrosion behavior of the coatings in the present study. Taguchi method together with Grey relational analysis is employed to optimize the process parameters in order to identify the combination of parameters that induce the maximum corrosion resistant properties in the coating. Analysis of variance is employed to observe the contribution of the main design factors and their interactions. Finally, validation of the result obtained through the analysis is done with the help of confirmation test. The microstructure, chemical composition and phase transformation behaviour of Ni-P-W coatings are studied with the help of scanning electron microscopy, energy dispersed X-ray analysis and X-ray diffraction analysis, respectively.
Taguchi design methodology
Most of the engineering problems deal with the optimization of the design parameters to achieve the desired performance characteristics. The Taguchi technique is the most convenient method used by engineers to optimize any engineering problem. The Taguchi design technique consists of three consecutive stages such as system design, parameter design, and tolerance design. System design is the usage of scientific and engineering information required for producing a part. Parameter design is used to obtain the optimum levels of process parameters for developing the quality characteristics and to determine the product parameter values depending on the optimum process parameter values. Tolerance design is the stage to determine and to analyze tolerances about the optimum combinations suggested by parameter design. The aim of this study is to optimize the corrosion behaviour of chemically deposited Ni-P-W coating using grey based Taguchi method [21]. The concept of the Taguchi method is to optimize process parameters to achieve high quality with low cost. This technique is widely used in the engineering domain to get the desired performance characteristics by optimizing the design parameters. Taguchi recommends the use of the loss function to measure the quality characteristic. The value of the loss function is further transformed into a statistical measure called signal-to-noise (S/N) ratio. S/N ratio, being the ratio of mean to standard deviation, can effectively consider the variation encountered in a set of trials. A larger S/N ratio represents minimization of noise factor, thus a better quality characteristic and the corresponding process parameters are incentive to the variation of environmental conditions and other noise factors. Due to the increasing number of process parameters, a special design of orthogonal arrays (OA) is used in the Taguchi method to reduce large number of experiments that need to be carried out. Based on the objective of the experiment, S/N ratio characteristics can be divided on the basis of three criteria: lower-the-better (LB), higher-the better (HB) and nominal-the best (NB).
Grey relational analysis
The present study aims to evaluate the electrochemical characteristics of electroless Ni-P-W coating with the help of electrochemical impedance spectroscopy (EIS) considering two main response parameters viz. charge transfer resistance and double layer capacitance. The objective is to maximize the corrosion resistance. Thus it becomes a multi-response objective function optimization, which differs from the single response optimization. Grey relational analysis is one of the efficient tools, which can be employed for the overall evaluation of the S/N ratio to optimize the multiple response characteristics. Any system in nature is neither full of precise information (white) nor completely lack of information (black); mostly they consist of partial information (mixture of white and black called grey). The main objective of the grey theory is to supply sufficient information so that one can whiten the greyness. Grey relational analysis is based on the grey system theory and compares and computes the dynamic casualities of the subsystems of a given system. The first step in performing the grey relational generation is to normalized results of the experiments in the range between 0 and 1. Then the second step is to calculate the grey relational coefficient from the normalized data to represent the correlation between the desired and actual experimental data. Finally, the overall grey relational grade is computed by averaging the grey relational coefficient corresponding to each performance characteristics. Considering this grey relational grade the overall evaluation of the multiple response characteristics is done. A statistical analysis of variance (ANOVA) is performed to find the statistically significant parameters of the experiment. With the grey relational analysis and statistical analysis of variance, the optimal combination of the process parameters can be predicted. Finally, a confirmation experiment is conducted to verify the optimal process parameters obtained from the analysis.
Experimental details
Materials and coating method
The Ni-P-W coating is deposited on mild steel (AISI 1040) specimen of size 20 mm × 20 mm × 8 mm. Shaping, parting, milling processes are used accordingly for the preparation of the sample. The sample is then subjected to surface grinding process. The sample is mechanically cleaned from foreign matters and corrosion products. After that the MS sample is cleaned using distilled water followed by a pickling treatment with dilute (50%) hydrochloric acid for one minute to remove any surface layer formed like rust. Then the sample is rinsed in distilled water and methanol cleaning. A large number of trial experiments are performed before deciding the bath composition.
Table 1 indicates the bath composition and the operating conditions for successful coating of Ni-P-W on the mild steel substrate.
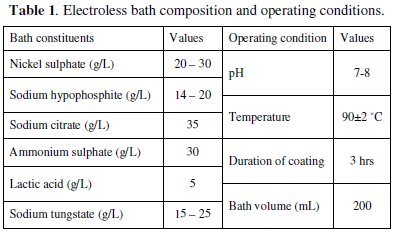
Nickel sulphate is used as the source of nickel, while sodium hypophosphite is the reducing agent which reduces the nickel into its elemental form while itself getting oxidized. Sodium tungstate solution is used as the source of tungsten ion. The bath is prepared by adding the constituents in appropriate sequence. The pH of the solution is maintained around 7-8 by continuous monitoring with a pH meter. The steps for obtaining the Ni-P-W deposit are as follows:
• the samples are cleaned using acetone followed by a pickling treatment using 50% dilute hydrochloric acid;
• the substrates are then activated in palladium chloride solution at a temperature of 55 °C;
• activated samples are then submerged into the chemical bath which is maintained at a temperature between 90-92 °C with the help of a hot plate cum stirrer, attached with a temperature sensor which is also submerged in the solution;
• the deposition is carried out for a period of 3 hours;
• the range of coating thickness is found to lie around 25-30 microns;
• after deposition, the samples are taken out of the bath and cleaned using distilled water;
• after the coating the samples are heat treated at different temperatures (400 °C, 500 °C and 600 °C) according to the design of experiment.
Selection of design parameters
The design parameters are those factors which are varied within a specific range to obtain an optimum combination for desired result of the responses. The corrosion characteristics of electroless coating depend on various coating parameters like, nickel source concentration, reducing agent concentration, tungsten concentration, complexing agent, bath temperature, pH of the solution, substrate, etc. Considering all these parameters for the optimization of the corrosion characteristics make the design of the experiment and analysis more complicated. However, recent literature review revealed that there are three main coating parameters which can affect the corrosion resistance significantly; those are concentration of nickel source (A), concentration of reducing agent (B) and concentration of tungsten source (C). These three coating parameters are considered as main design parameters along with their interactions. Along with these three parameters, the annealing temperature (D) is considered as the fourth design parameter because the phase of the compound deposited depends on the post deposition heat treatment temperature. Table 2 shows the design factors along with their levels.
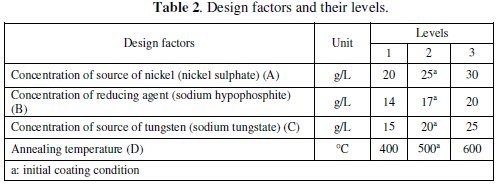
Three levels, having equal spacing, within the operating range of the parameters were selected for each of the factors. By selecting the three levels, the curvature or non-linearity effects could be studied.
Response variables
In the present article, corrosion behaviour of electroless Ni-P-W coatings is studied with the help of electrochemical impedance spectroscopy. Hence, the two popularly evaluated parameters, i.e., charge transfer resistance (Rct) and double layer capacitance (Cdl), are considered as the response variables. A higher value of Rct and a lower value of Cdl indicate that the material under test has a higher resistance against corrosion.
Design of experiments
The design of experiment of the present study includes an OA based on Taguchi method to reduce the number of experiments for the optimization of the coating process parameters for corrosion characteristics. An OA is the shortest possible matrix of combination of process parameters which includes the individual effect as well as the interactions simultaneously. The selection of OA plays a vital role to complete the experiment successfully. According to Taguchi philosophy the choice of the OA should be such that the total DOF of the OA must be greater than the total DOF of the experiment. For any 'p' level experiment the DOF of each factor is (p-1). For this three level experiment the DOF of all the four individual factors is 8 [4 × (3 - 1)], and for the three interactions the DOF is 12 [3 × (3-1) × (3-1)]. So the total DOF required for this experiment is 20. Hence for the present investigation, an L27 OA is chosen which has 27 rows corresponding to the number of tests and 26 degrees of freedom (DOFs) with 13 columns. The assignment of the factors and interactions to the columns of the array is done on the basis of the Triangular Table for 3-level OA [21] as suggested by Taguchi. The L27 OA together with the column assignments are shown in Table 3.
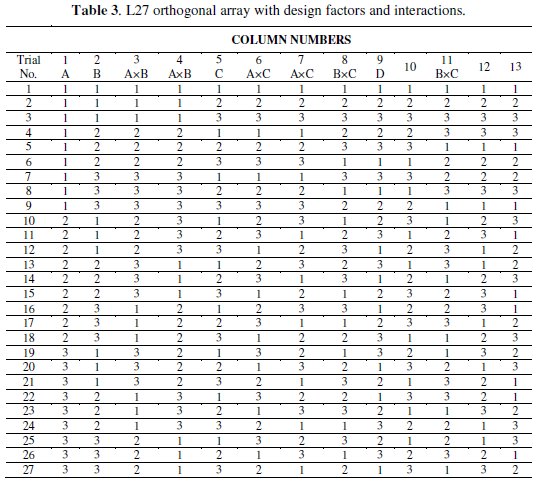
Each row in the table represents a specific combination of experimental run and each column represents a specific factor or interactions. The cell value indicates the level of the corresponding factor or interaction assigned to that column. However, the experimental run is controlled by the settings of the controllable design factors, i.e., A, B, C and D, and not by the interactions.
Characterization and surface morphology
Energy dispersive X-ray (EDX) analysis is done in conjunction with SEM to study the composition of the EN coatings in terms of the weight percentages of nickel, phosphorous and tungsten in the coatings before and after heat treatment at different temperatures. EDX is done in an EDX analyzer (EDAX Corporation). The surface morphology of the coating is observed through scanning electron microscope (SEM) (JEOL, JSM 6360) in order to analyze the effect of heat treatment on the microstructure of the deposits. The phase structures were studied by the X-ray diffractometer (Rigaku, Ultima III) both before and after heat treatment.
Electrochemical impedance spectroscopy (EIS) test
The EIS tests are performed with a potentiostat (Gill AC) of ACM Instruments, UK. A 3.5% sodium chloride solution is taken as the electrolyte and the tests are conducted at a constant ambient temperature of about 25 °C. The electrochemical cell consists of three electrodes. The coated specimen forms the working electrode which is actually the sample being interrogated. A saturated calomel electrode (SCE) forms the reference electrode, which provides a stable reference against which the applied potential may be accurately measured. A platinum electrode serves as the counter electrode, which provides the path for the applied current into the solution. The design of the cell is such that only an area of 1 cm2 of the coated surface is exposed to the electrolyte. A settling time of 15 min is assigned before every experiment in order to stabilize the open circuit potential (OCP). The potentiostat is controlled via a PC which also captures the EIS data. The applied frequency was varied from 10 KHz to 0.01 Hz and the Nyquist plots obtained from the tests in general exhibited a single semicircle in the high frequency region which is quite consistent to that observed by Sankara Narayanan et al. [18]. The electrical model that can be used to simulate this type of electrochemical behaviour is given in Fig. 1.
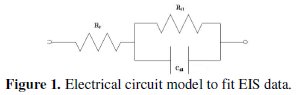
The charge transfer resistance (Rct) is represented by the resistance of electron transfer during electrochemical reaction course. The double layer capacitance (Cdl) can be correlated to the delamination of the coating. Solution resistance (Rs) is referred to the resistance between the work electrode and reference electrode. The values of charge transfer resistance (Rct) and double layer capacitance (Cdl) were determined from the Nyquist plot by fitting a semicircle using the accompanying software.
Results and discussion
Characterization and morphology of the coating
An X-ray diffraction (XRD) analyzer (Rigaku, Miniflex) is used for identification of compounds in the EN coatings both before and after heat treatment. Fig. 2 shows the XRD plots of as deposited and heat treated conditions.
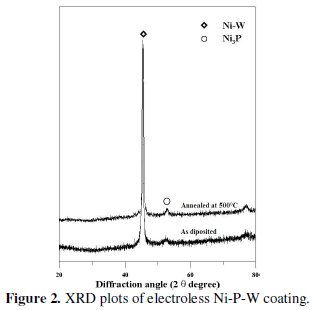
From the figure it is evident that as deposited condition the phase is mostly amorphous but there exist a crystalline peak so it may be attributed that the coated surface has a mixture of amorphous and crystalline phase. After heat treatment, some of the peaks are broaden and produce crystalline phase. After heating at 500 °C for 1 hour the major peaks of Ni-W and Ni3P are obtained. Energy dispersive X-ray analysis (EDAX Corporation) is performed to determine the composition of the coating in terms of the weight percentages of nickel phosphorous and tungsten. Fig. 3 shows the EDX spectra of the coated surface.
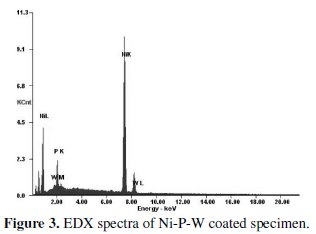
The EDX analysis is done on the coatings developed from the bath consisting of different concentrations of sodium tungstate (tungsten ions) in order to capture the range of tungsten content in the coatings. It is found that the coating consists of 88% nickel, 8% phosphorous and 4% tungsten. Fig 4 shows the SEM micrograph of as deposited and heat treated (400 °C, 500 °C and 600 °C) Ni-P-W coated surface.
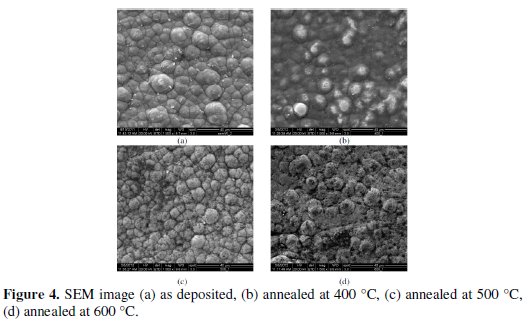
It is clear that the deposit has globular like shape without any porosity in as deposited condition. When it is heat treated at 500 °C the globules become more compact and produce a dense structure resulting harder deposit. With further heating at 600 °C the size of the globule increases and transforms into coarse grained structure.
Grey analysis
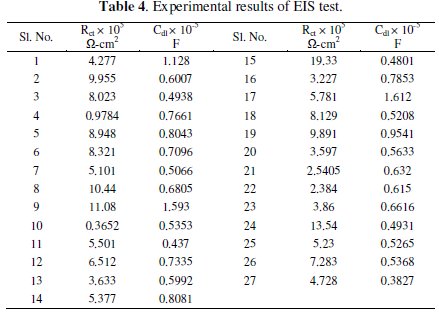
Grey analysis is a method which converts the multivariate problem into a single response problem. As the present investigation deals with two responses, viz., charge transfer resistance and double layer capacitance, grey analysis is employed to make it a single response. The experimental values of charge transfer resistance (Rct) and double layer capacitance (Cdl) obtained from the EIS tests are given in Table 4.
To convert the multiple responses into a single performance index called grey relational grade, the following steps have been performed.
Step 1: Normalization of responses
The first step for generating the grey relational coefficient involves the linear normalization of the experimental results (Rct and Cdl) in the range between 0 and 1. A material will have lower tendency to corrode if the Rct value tends to higher with a lower value of Cdl. So higher the better criterion for Rct and lower the better criterion for Cdl are used for normalization.
Expression for higher the better:
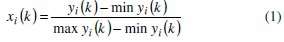
Expression for lower the better:
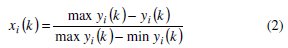
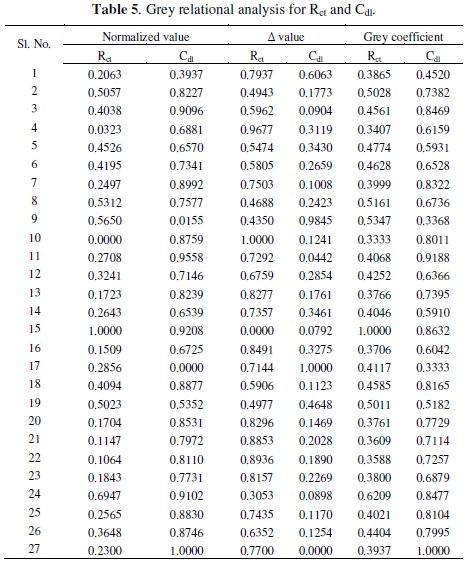
where, xi(k) is the value after grey relational generation, while min yi(k) and max yi(k) are respectively the smallest and largest values of yi(k) for the kth response. The data after grey relational generation are shown in Table 5.
Step 2: Generation of grey relational coefficient
From the normalized value the grey relational coefficient is calculated by applying the equation

where, Δ = || x0(k) - xi(k) || is the difference of the absolute value between x0(k) and xi(k), Δmin and Δmax are respectively the minimum and maximum values of the absolute differences (Δ0i) of all comparing sequences. The grey relational coefficients are calculated for the experimental data using ξ = 0.5. The values are shown in Table 5.
Step 3: Generation of grey relational grade
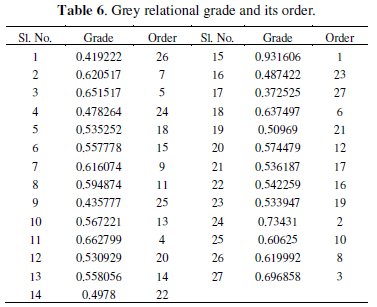
The overall multiple response characteristics evaluation is based on grey relational grade which is calculated as follows:

where, n is the number of process responses. Finally, the grades are considered for the optimization of multi-response parameter design problem. The value of grey relational grade and its order is shown in Table 6.
Analysis of signal to noise (S/N) ratio
Taguchi method uses S/N ratio to convert the experimental results into a value for the evaluation characteristic in the optimum parameter analysis. Where signal means desirable value (mean) and the noise is the undesirable value (S.D.). A larger S/N ratio represents a better quality characteristic because of the minimization of noise and the corresponding process parameters are incentive to the variation of environmental conditions and other noise factors. The variability can be easily captured if S/N ratio is used to convert the experimental results into a value for the evaluation characteristic in the optimum parameter analysis, instead of the mean. The idea is to maximize the S/N ratio, thereby minimizing the effect of random noise factors, which have a significant impact on the process performance. As the grey relational grade has to be maximized so higher the better criterion is used to calculate the S/N ratio, expressed as:

where y is the observed data and n is the number of observations. Since the experimental design is orthogonal, it is then possible to separate out the effect of each coating parameter at different levels. As an example, the mean grey relational grade for factor A at each level (1, 2 and 3) can be calculated by averaging the grey relational grades of the experiments 1-9 for level 1, experiments 10-18 for level 2 and experiments 19-27 for level 3, respectively. The mean grey relational grade for each level of the other factors can be computed in the similar manner. The mean grey relational grade for each level of the factors A-D is summarized and called the response table for mean grey relational grade (Table 7). In addition, the total mean S/N ratio for the 27 experiments is also calculated and listed in Table 7.
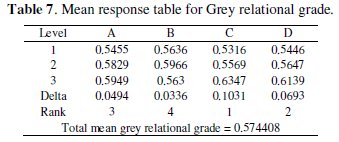
All the calculations are performed using Minitab [25].
The response table shows the average of the selected characteristic for each level of the factors. The response table includes ranks based on Delta statistics, which compare the relative magnitude of effects. The Delta statistic is the highest average for each factor minus the lowest average for the same. Ranks are assigned based on Delta values; rank 1 is assigned to the highest Delta value, rank 2 to the second highest Delta value, and so on.
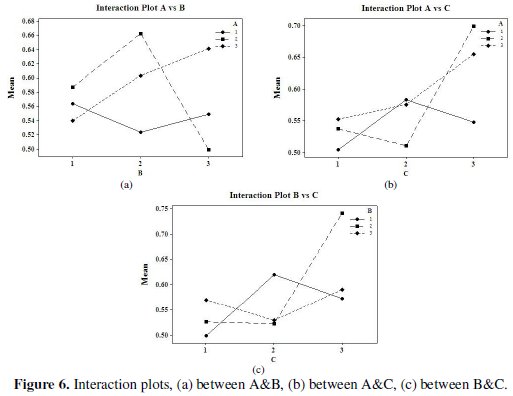
Fig. 5 and 6 show the corresponding main effects and interaction effects plots between the process parameters respectively.
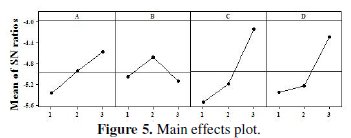
In the main effects plot if the line for particular parameter is near horizontal, then the parameter has no significant effect. On the other hand, a parameter for which the line has the highest inclination will have the most significant effect. It is very much clear from the main effects plot that parameter C (concentration of tungsten source solution) is the most significant parameter, while parameter D (annealing temperature) also has some significant effect.
So far as the interaction plots are concerned, estimating an interaction means determining the non-parallelism of parameter effects. Thus, if the lines on the interaction plots are non-parallel, interaction occurs, and if the lines cross, strong interactions occur between parameters. From Fig. 6 it can be seen that there is strong interaction between the parameters B and C. Thus, from the present analysis it is clear that the concentration of tungsten source solution (C) is the most significant parameter for corrosion characteristics of Ni-P-W coatings. The optimal process parameter combination that yields maximum mean S/N ratio is found to be A3B2C3D3.
Analysis of variance (ANOVA)
ANOVA is a statistical technique which can provide some important conclusions based on analysis of the experimental data. This method is very useful for revealing the level of significance of the influencing factor(s) or interaction of factors on a particular response. It separates the total variability of the response into contributions of each of the factors and the error. The Taguchi experimental method could not judge the effect of individual parameters on the entire process, thus the percentage of contribution using ANOVA is used to compensate for this effect. Results from ANOVA can determine very clearly the impact of each factor on the process results. Using Minitab [25] ANOVA is performed to determine which parameter and interaction significantly affect the performance characteristics. Table 8 shows the ANOVA result for electrochemical behaviour of EN coatings.
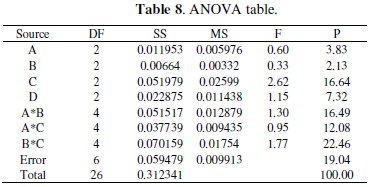
The ANOVA table shows the percentage contribution of each parameter. It is seen that parameter C, i.e., concentration of tungsten source solution and parameter D, i.e., annealing temperature, have the major contribution on electrochemical behaviour of Ni-P-W coating within the specific test range. Among the interactions, the interaction of parameters between B and C has significant contribution. This type of analysis is not available in the literature and will be useful for Ni-P-W coating deposition with an objective of optimum corrosion behaviour within the particular range of process parameters.
Validation test
After obtaining the optimal level of coating process parameters, the final step is to predict and verify the improvement of the performance characteristic using the optimal level of the process parameters. The estimated grey relational grade, η̂, using the optimal level of the process parameters can be calculated as:
where, ηm is the total mean grey relational grade, η̄ is the mean grey relational grade at the optimal process parameter level and o is the number of the main design process parameters that significantly affect the electrochemical characteristics of Ni-P-W coating. Table 9 shows the comparison of the estimated grey relational grade with the actual grey relational grade using the optimal parameters.
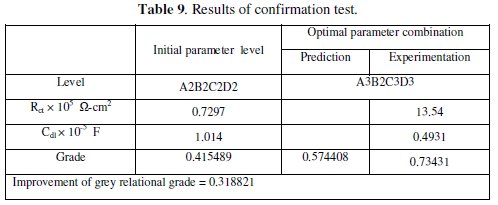
The improvement of grey relational grade from initial to optimal condition is 0.318821, which is about 56% of the mean grey relational grade and is a significant improvement. The impedance plot for the coatings developed at initial condition and at optimal condition is shown in Fig. 7.
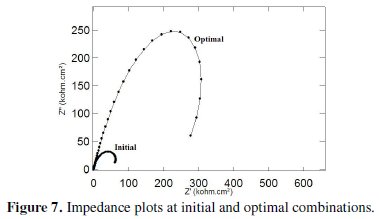
It can be seen that both the plots exhibit a semicircular nature in the higher frequency region but the semicircles have different sizes. This indicates that the same corrosion phenomenon is occurring but over a larger area. Also their corrosion properties are different and enhanced with the annealing temperature above 500 °C for the optimum combination of coating parameters obtained from this analysis.
Conclusion
Ni-P-W alloy films are deposited on mild steel substrate from the electroless bath and the corrosion behaviour (electrochemical impedance spectroscopy) in 3.5% sodium chloride solution are studied. Here the Taguchi orthogonal array coupled with grey relational analysis is employed to optimize the coating process parameters for maximum corrosion resistance. The optimum parameter combination is found to be A3B2C3D3, i.e., nickel concentration 30 g/L, reducing agent concentration 17 g/L, tungsten concentration 25 g/L and annealing temperature 600 °C. ANOVA result indicates that concentration of tungsten source (C) is the most important parameter that significantly affects the corrosion characteristics. Also, the interaction between the reducing agent and the tungsten source is significant. The improvement of the grey relational grade from the initial condition to the optimal condition is found to about 56%. From the EDX analysis it is clear that the coating is pure ternary and consists of nickel, phosphorous and tungsten. The XRD plots reveal that the coating is a mixture of amorphous and crystalline structure in the as deposited condition and produces Ni-W and Ni3P as major compounds after heat treatment at 500 °C for 1 hour. From the surface morphology captured by SEM it is seen that there are many globular particles on the surface of the substrate with no surface damage.
References
1. Narayanan TSNS, Krishnaveni K, Seshadri SK. Mater Chem Phys. 2003;82:771-779. [ Links ]
2. Sahoo P, Das SK. Mater Design. 2011;32:1760-1775. [ Links ]
3. Agarwala RC, Agarwala V, Sadhana. 2003;28:475-493. [ Links ]
4. Das SK, Sahoo P. Port Electrochim Acta. 2011;29:211-231. [ Links ]
5. Riedel W. Electroless nickel plating. Hertfordshire (UK): Stevenage, Finishing Publications Ltd; 1991. [ Links ]
6. Bigdeli F, Allahkaram SR. Mater Design. 2009;30:4450-4453. [ Links ]
7. Farzaneh A, Ehteshamzadeh M, Mohammadi M. J Appl Electrochem. 2011;41:19-27. [ Links ]
8. Hamdy AS, Shoeib MA, Hady H, Abdel Salam OF. Surf Coatings Tech. 2007;202:162-171. [ Links ]
9. Nash P. Phase diagrams of binary nickel alloys. ASM International; 1991. [ Links ]
10. Tsai Y, Wu FB, Chen Y, Peng P, Duh JG, Tsai S. Surf Coatings Tech. 2001;146-147:502-507.
11. Zhao Q, Liu Y, Muller-Steinhagen H, Liu G. Surf Coatings Tech. 2002;155:279-284. [ Links ]
12. Wu FB, Chen I, Peng P, Tsai Y, Duh JG. Surf Coatings Tech. 2002;150:232-238.
13. Palaniappa M, Seshadri SK. Wear. 2008;26:735-740. [ Links ]
14. Liu H, Viejo F, Guo RX, Glenday S, Liu Z. Surf Coatings Tech. 2010;204:1549-1555.
15. Lu G, Zangari G. Electrochim Acta. 2002;47:2969-2979. [ Links ]
16. Gao Y, Zheng ZJ, Zhu M, Luo CP. Mater Sci Eng A. 2004;381:98-103. [ Links ]
17. Srinivasan KN, Meenakshi R, Santhi A, Thangavelu PR, John S. Surf Eng. 2010;26:153-158.
18. Narayanan TSNS, Seshadri SK. J Alloys Compounds. 2004;365:197-205. [ Links ]
19. Dervos CT, Novakovic J, Vassiliou P. Mater Letters. 2004;58:619-623. [ Links ]
20. Baskaran I, Narayanan TSNS, Stephen A. Trans Inst Metal Finishing. 2009;87:221-224. [ Links ]
21. Roy RK. A primer on the Taguchi method. Dearborn: Mich, Society of Manufacturing Engineers; 1990. [ Links ]v
22. Deng J. J Grey System. 1989;1:1-24. [ Links ]
23. Mallory GO, Hadju JB. Electroless plating: fundamentals and applications. Orlando: AESF; 1991. [ Links ]
24. Montgomery DC. Design and analysis of experiments. New York: Wiley; 2001. [ Links ]
25. Minitab User Manual, Making data analysis easier. PA (USA): MINITAB Inc, State College; 2001. [ Links ]
*Corresponding author. E-mail address: psjume@gmail.com
Received 23 July 2012; accepted 26 November 2012

