


Serviços Personalizados
Journal
Artigo
 Inglês (pdf)
 Artigo em XML
 Referências do artigo
 Enviar este artigo por email
Indicadores
-
 Citado por SciELO
 -
 Acessos
Links relacionados
-
 Similares em
SciELO
Similares em
SciELO
Compartilhar

 Permalink
Portugaliae Electrochimica Acta
versão impressa ISSN 0872-1904
Port. Electrochim. Acta vol.29 no.3 Coimbra jul. 2011
Determination of Mercury by Anodic Stripping Voltammetry in Aqua Regia Extracts
Juan Sánchez, Elianna Castillo, Piedad Corredor, Jesús Ágreda*
Universidad Nacional de Colombia, Departamento de Química, Cra 30 No. 45-03 - Bogotá, Colombia
Abstract
This work presents the optimization process of mercury determination by Anodic Stripping Voltammetry (ASV), using a glassy carbon modified with a gold film as working electrode, in samples extracted by aqua regia. The samples may contain Cu, Fe or Pb in high concentrations. In these conditions the usual Hg determination by ASV is almost impossible. The effects of the supporting electrolyte on the sensitivity of the method and chloride and nitrate ions concentration were studied. Supporting electrolyte was selected between: HCl, HNO3, HClO4 and CH3COOH. Our results show that the best sensibility is obtained with HClO4 0.10 M. High chloride concentration decreases the useful potential window and the peak current. However, small chloride additions are required to obtain high peak currents because chloride prevents Au film poisoning. Another interference studied was that of Cu and Fe. This kind of interference can be avoided if the sample in the electrochemical cell is exchanged for fresh electrolytic solution (HCl 0.01 M -HClO4 0.10 M) before the stripping step.
Keywords: mercury, anodic stripping voltammetry (ASV), glassy carbon, gold film electrode, aqua regia.
Introduction
Mercury is considered to be one of the most toxic heavy metals for humans due to its methylation, bioaccumulation and biomagnification [1-2]. Its affinity with amino and sulphur groups in several proteins, enzymes and other chemical structures found in the human body allows it to modify the functions of these molecules and hence cause health problems; that is why several studies assess the toxic power of mercury and the risks of this pollutant [3-5]. There is a considerable amount of research on analytical techniques for mercury determination, including cold vapor atomic absorption spectrophotometry [6], cold vapor atomic fluorescence spectroscopy, chromatographic methods [7-9] and electrochemical techniques [10-11]. Although these techniques are very reliable, some of them may also be out of reach for developing countries because their cost. One of the techniques being most widely used due to its benefits and low cost is the Anodic Stripping Voltammetry (ASV) [12-14], which uses a gold electrode or gold film on a glassy carbon electrode, as reported in method 7472 of the Environmental Protection Agency US-EPA. This method is based on the high affinity existing between gold and mercury, and it makes it possible to determine very low mercury concentrations (≈0.4 μg L-1). Some researchers have studied the optimization of several parameters affecting mercury quantification by ASV, such as the chemisorption of oxyanions and halogens [15-17], the interference of copper ions in the presence of high chloride concentrations [18], the stripping voltammetric impulse parameters and the optimization in reproducibility of the measures by means of mechanical and electrochemical cleaning of the electrode surface [19]. Although this method is applied directly to liquid samples like drinking and surface waters, the method is not adequate when the extraction is done in complex solid samples because the components of the matrix or the extraction procedure cause interference. On the other hand, in common samples extracted with aqua regia, such sediments and fluorescent lamps, it is usual to find high concentrations of copper, iron and lead. Giacomino [20] showed that the Hg determination by ASV is linear if the ratio of mercury to the other elements is maximum 1:100; however, in some environmental significant samples, the ratio could be higher, which increases the interference.
This work presents the optimization of mercury determination by means of ASV in complex samples (sediments and fluorescence lamps as examples) extracted with aqua regia, using a glassy carbon electrode modified with a gold film. The effects of the electrolyte, the chloride and nitrate concentration, and the interference of copper, iron and lead were also studied.
Experimental
Chemical reagents and instruments
Mercury and copper solutions were prepared by dilution of Merck standards 1000 ± 2 mg L-1. All acid solutions were made using Merck R.A reagents. Iron solutions were prepared from FeCl3.6H2O and (NH4)2Fe(SO4)2.6H2O R.A. Merck at concentrations of 0.50 ± 0.04 M and 0.10 ± 0.008 M, respectively. The gold stock is prepared with 1.000 g of auric salt ([AuCl3.HCl].4H2O) J.T. Baker, diluted in a 500 mL volume of 0.10 M HCl, yielding a concentration of 956 ± 8 mg L-1 of Au. The ferrocyanide 0.010 ± 0.0007 M used in the working electrode area determination was prepared with K4Fe(CN)6.3H20 R.A. J.T. Baker; this solution was protected from light to prevent photochemical degradation.
Voltamperometric measures were taken by using a BAS CV50W potentiostat model (2-1995, USA). The working electrode was obtained by the electrochemical deposition of a gold film on a glassy carbon electrode. The reference electrode was Ag/AgCl (3 M KCl) and all potentials in this work are relative to this electrode. A platinum wire was used as auxiliary electrode. Additionally, a peristaltic pump Watson Marlon 323 England was used to change the sample solution in the electrochemical cell by fresh supporting electrolyte. The synthetic samples extraction in aqua regia was made using a graphite extraction block (SCP Science Digi Prep, Canada) heating to 120 °C for 2 hours.
Preparation of the gold film
The gold film was obtained through the electrochemical reduction of a 96.0 ± 3 mg L-1 Au (III) in 0.100 M HCl on the surface of a glassy carbon electrode. The technique used was the deposition at constant potential (-500 mV vs. Ag/AgCl) for 10 minutes with stirring at 800 rpm. The surface of the glassy carbon electrode was previously treated following the process described by S. S. Ermakov [21]: polishing of the surface by means of alumina, washing with ethanol, ultrasound for 5 minutes, and electrochemical cleaning at 1000 mV vs. Ag/AgCl for a period of 60 seconds.
Determination of the effective electrode area
The area of the Au film working electrode was measured by cyclic voltammetry of potassium ferrocyanide in two different supporting electrolytes, KCl 1.00 ± 0.06 M and NaClO4 0.10 ± 0.006 M and, using the Randles-Sevcik equation [22].
Anodic stripping voltammetry (ASV)
The preconcentration phase was carried out at 0 mV vs. Ag/AgCl for 120 seconds, an equilibrium time of 40 seconds and, the stripping step was performed by means of Square Wave Voltammetry (SW) with a potential amplitude of 25 mV, 15 Hz wave frequency, reading interval of 4 mV and a potential scan from 0 to 850 mV.
Results and discussion
The anodic stripping voltammetry of mercury on a gold film electrode is a well known experiment [19]. However, the use of this analytical method is not possible when solid samples like soils, sediments, and fluorescence lamps are tested. For these kind of samples it is necessary an aqua regia extraction which, unfortunately, introduces Cl- and NO3- in such high concentration that the Hg signal disappears.
In order to have clear ideas about the source of the problem, we have made a study of the system, investigating the effect of: gold film's area reproducibility, supporting electrolyte, chloride and nitrate concentration and, aqua regia matrix used as a blank. Additionally, interference from Cu, Fe and Pb was studied. The high concentration of chloride (2.5 M) was the main interference and two ways were proposed to remove it: first, oxidation with persulfate and second, change of the sample by fresh electrolyte before the stripping step. Finally, gold film's life time under the best conditions found was tested. Now, we will present the results, as stated before.
Reproducibility of the Au film: determination of the effective electrode area
The determination of the effective area of the gold film used in the analysis is very important, due to the superficial nature of the phenomena. That is why the variability in area value might be an indicator of the precision of the results [19]. In our particular case, the experimental area value found (0.0495 cm2) was smaller than the geometrical one (0.0707 cm2), which may be due to the process of manufacturing the film and to the possible adsorption of perchlorate and chloride ions on the electrode surface. The repeatability of the area measurements in sodium perchlorate 0.100 M, is good (Coefficient of Variation in percentage, %CV < 6, replicates number, n = 12), which indicates that Au film preparation is under control. However, these changes in Au film area must be considered in the final quantitative Hg results. Therefore, to obtain better reproducibility in the determination of Hg in one sample, it is recommended to use a unique Au film for the calibration curve and sample, because if a second film is used, an additional source of error appears.
Effect of the supporting electrolyte
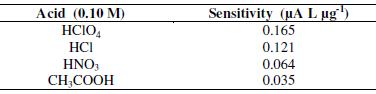
The electrochemical deposition of mercury on the gold surface is strongly influenced by the supporting electrolyte used [23]. Particularly, chloride and nitrate (aqua regia components), can be adsorbed over the Au film and interact with Hg, preventing the formation of solid solutions between Au and Hg and diminishing the preconcentration effect of the Anodic Stripping Voltammetry (ASV). Additionally, the supporting electrolyte could avoid the complete analyte's oxidation process during the stripping step. In this work, the effects of four supporting electrolytes, HCl, HClO4, HNO3 and CH3COOH at 0.10 M, were tested to clarify their repercussion on the quantitative results. It was found that all the ions in these acids show interactions on the Au surface, originating a base line with several peaks; fortunately those peaks are little defined and they have low current magnitudes when compared to the signal of Hg (II) 50 μg L-1. The source of those signals is the adsorption of the anions in the potential interval of 200-400 mV as reported in the literature [24]. Since all the acids in this study showed interaction on the Au surface, it was necessary to test sensitivity for the detection of Hg (II) in each acid. The best sensitivity was reached with HClO4 followed by HCl (Table 1).
Table 1. Effect of supporting electrolytes on the sensitivity of calibration curves of Hg(II). Concentration range 5 - 50 μg L-1.
Effect of the chloride ions
Samples extracted with aqua regia lead to high concentrations of chlorides and nitrates in the matrix, affecting the analytical results; then it is necessary to carry out a study on the effect of those ions. Firstly, the interaction between chloride and Au surface was studied by cyclic and square wave voltammetry. Adsorption peaks are observed as the electrode is polarized to more positive values, and desorption phenomenon is observed, as the electrode is polarized to more negative values. Also, the current and potential of these processes vary in function of the concentration of chlorides found in solution, Fig. 1A. These interactions, may be due to two phenomena: first, a process of rearrangement or reconstruction of the surface in the presence of chlorides at a potential around 300 mV which produce low peak currents and; second, an adsorption at higher potential near the formation zone of gold oxides (800-1200 mV), Fig. 1B, causing that the accessible potential window of the electrolyte diminishes, as reported in [25]. It was found that these interactions produce higher background values as the concentration of chlorides increases.
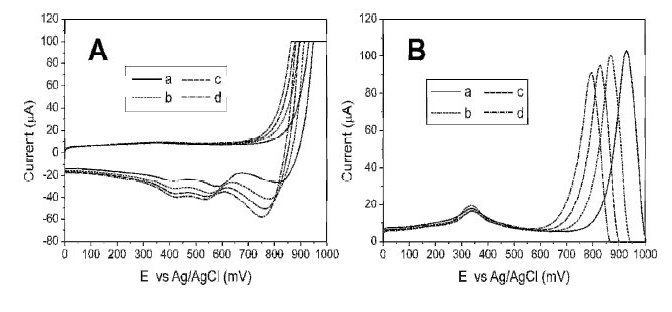
Figure 1. Effect of chlorides on the baseline voltammograms. A) Cyclic Voltammetry, desorption process: a) 0.120 M HCl, b) 0.240 M HCl, c) 0.350 M HCl and d) 0.460 M HCl. B) Square Wave Anodic Stripping Voltammetry for a solution containing a) 0.060 M HCl, b) 0.24 HCl, c) 0.60 HCl, d) 1.10 M HCl.
Another important effect of chlorides is the change in the Hg oxidation potential during the stripping step. Table 2, column 5, shows how the Hg peak potential moves to lower values as a consequence of mercury chlorocomplex formation.
Table 2. Effect of mercury chlorocomplex on Hg(II) anodic Square Wave Anodic Stripping Voltammetry determination.

The more probable explanation to the peak shift is given by the following possible reactions (we do not pretend to be rigorous about the species and steps in the mechanism, instead we want to show the general process involved):
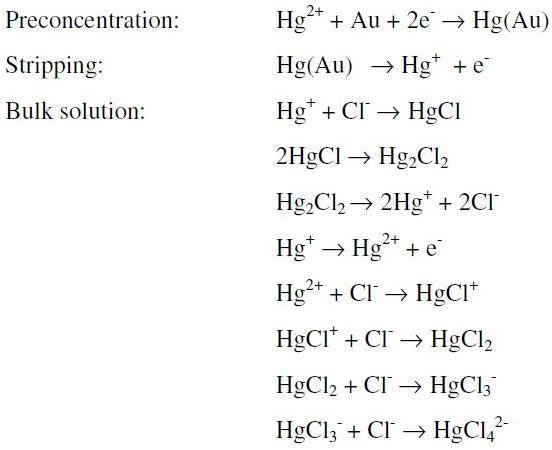
Two global oxidation processes with similar potentials are possible in the above scheme:
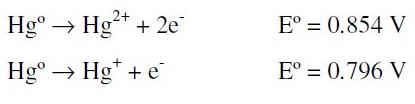
but only one signal is observable because they are overlapped [26].
On the other hand, changes in peak currents for the same concentration of mercury as a function of the chloride concentration, with and without HClO4 are observed in the Fig. 2. This can be explained mainly by the processes in the preconcentration step, because as the chlorides concentration increases, the fraction of the mercury chlorocomplexes increases too and hence the proportion of free mercury available for reduction is lower. Moreover, these peak current changes were verified when there is no HClO4 in solution (Fig. 2a) and compared when HClO4 is 0.10 M (Fig. 2b), finding that the magnitude of the current between experiments changes, but the qualitative behavior is the same, Fig. 2. Now, the maximum in the current around [Cl-] = 0.008 mol L-1, is due to the fact that a certain amount of chlorides is necessary to stabilize the film's surface [27] and to produce the maximum Hg signal. Therefore, in order to obtain high Hg signals and acceptable reproducibility, a mixture of HCl 0.010 M with 0.100 M HClO4 was our best supporting electrolyte.
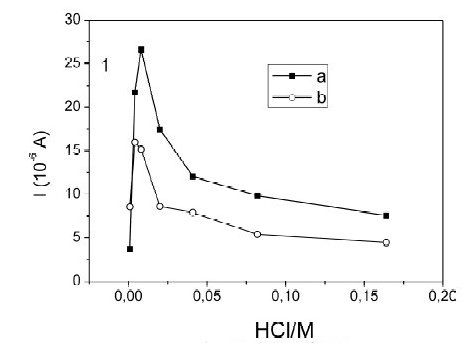
Figure 2. Effect of chloride on the peak current of the Square Wave Anodic Stripping Voltammetry of Hg(II) 50 μg L-1. Current as a function of the chloride concentration: a) without HClO4 and b) with 0.100 M HClO4.
Effect of the nitrate ions
In order to study the effect of the nitrate ions over the baseline, a set of voltammograms were obtained with several solutions of HNO3 from 0.070 to 1.070 M, Fig. 3. It is clearly observed that the peak current near 300 mV increases as the concentration of nitric acid was higher, indicating adsorption processes; also, the peak potential due to that process moves to lower values with higher concentrations of nitrate, away from the mercury peak, Fig. 3i. This response indicated that the nitrate had low negative effects in our determinations.
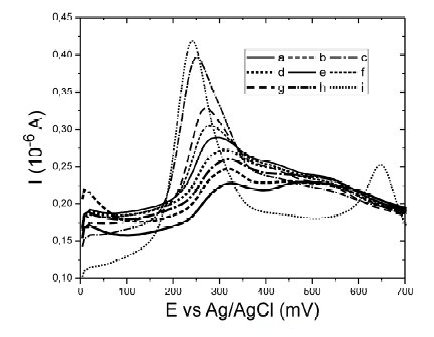
Figure 3. Square Wave Anodic Stripping Voltammetry for baseline at different concentrations of nitric acid. a) 0.07 M HNO3, b) 0.12 M HNO3, c) 0.16 M HNO3, d) 0.23 M HNO3, e) 0.34 M HNO3, f) 0.45 M HNO3, g) 0.66 M HNO3, h) 1.07 M HNO3 and i) 1.17 M HNO3 with 70 μg L-1 of Hg(II).
Aqua regia matrix as a blank in the Square Wave-Anodic Stripping Voltammetry (SW-ASV) and chloride elimination
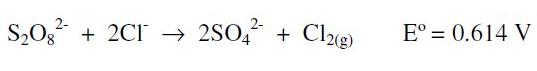
The effect of aqua regia (HCl-HNO3; 3:1), over the final quantification signal, was tested by simulation of the whole extraction process. As a blank, aqua regia which produces a baseline with currents higher than those obtained with the highest concentrations of chloride or nitrate alone was used. On this matrix, the peak corresponding to Hg is not well defined, and it is only possible to observe a significant signal for concentrations higher than 60 μg L-1; a fact indicating that the signal-to-noise ratio of the aqua regia matrix is smaller than the previous experiments (each acid alone), making difficult to detect lower concentrations. To improve this fact, as one of the options, we tested the oxidation of chloride by adding 2 g of potassium persulphate to the sample in the electrochemical cell [27]:
In order to prevent the corrosive action of the gaseous chlorine produced during the oxidation, over the film electrode surface, it was necessary to bubble nitrogen to remove the chlorine; this also preserves the film. However, when this protocol was applied to synthetic samples extracted with aqua regia, the 2 g of potassium persulfate added were not enough to oxidize the high concentrations of chloride found in the matrix (HCl about 3.6 M). Therefore, it would be necessary to use a larger quantity of persulphate, involving more costs, time and a higher probability of analyte losses; then, this led us to look for other alternatives. Out of several possibilities, we assessed the one proposed in reference [29], where the interference of chloride ions during stripping step is prevented changing the sample by a solution containing a lower concentration of chlorides which also avoids the overlapping of signals between Cu and Hg.
Change of the sample by fresh supporting electrolyte before the stripping step
The change of the sample in the electrochemical cell by fresh supporting electrolyte, before the stripping step, was carried out by means of a peristaltic pump and the effect of this change was evaluated using two different matrixes during the preconcentration step. The first one was aqua regia, which is the object of the present study, and the second one was a solution of 0.100 M HClO4 - 1.00 M HCl used to have a point of comparison. On the other hand, during the stripping step the experimental conditions were maintained constant, in both matrixes, using the previously chosen supporting electrolyte: 0.10 M HClO4 - 0.010 M HCl. Fig. 4 shows the effect of changing the sample (aqua regia matrix) by fresh supporting electrolyte before the stripping step, on the Hg signal. Results showed lower current values for baseline when the change is made, Fig. 4c, obtaining a defined mercury signal nearing 700 mV, Fig. 4d, where no interference is reported and the adsorption processes are minimal.
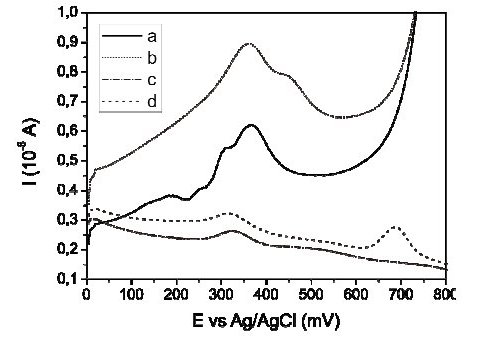
Figure 4. Effect of exchange of sample by fresh electrolyte before the stripping step in the quantification of Hg(II) by Square Wave Anodic Stripping Voltammetry. a) Aqua regia blank, b) the same as a) but added with 50 μg L-1 of Hg(II), c) aqua regia blank, changing sample by fresh supporting electrolyte (0.10 M HClO4 - 0.010 M HCl), before the stripping step, and d) the same as c) but added with 50 μg L-1 of Hg.
In order to quantify, more rigorously, the effect of the sample by fresh electrolyte change procedure, five different calibration curves of Hg(II), from 10 to 70 μg L-1 were made, finding a coefficient of variation in percentage (% CV), lower than 5 for the signal of each concentration level when the matrix was the mixture HCl-HClO4, and higher than 10 for the procedure with aqua regia. Also, a large variation in the % CV was found in slopes, (9 for HCl-HClO4, and 30 for aqua regia). One of the most important factors to produce this low reproducibility is the surface changes of the film due to the strong acid and highly oxidizing environment that modified the active sites, the thickness and the effective area of the Au film. As a consequence of this low reproducibility and the high concentration of chlorides in the matrix, the Limit of Detection (LOD) increases. The LOD was estimated as the intercept of the calibration curve [30], for the Hg linear interval 10 â 70 μg L-1 finding LOD = 1.1 μg L-1 for 0.1 M HClO4 - 1.00 M HCl and 2.9 μg L-1 for aqua regia. To overcome these difficulties, the same film must be used to read all the standards of one calibration curve and before to read the sample, the electrolyte must be changed and the film should be cleaned scanning the potential from 0 to 800 mV until the Hg signal disappears (usually two scans are enough). Under these conditions, a sample test of 50 ± 1 μg L-1 produced a recovery of 96.2 % with a 9.8 % CV (experimental replicates, n=5). Another way to overcome the low reproducibility is the standard addition method, again using one film per curve, which produced a recovery of 86.2 % with 4.3 % CV (n=5). All these results were compared with a reference technique, Cold-Vapor Atomic-Absorption Spectrophotometry (CV-AAS) which shows a recovery of 98.4 % with 3.8 % CV (n = 5), for the same test sample, in acceptable agreement with our data.
Metal interference
In common samples extracted with aqua regia, such as sediments and fluorescent lamps, it is usual to find high concentrations of copper, iron and lead. Among these metals, copper has been reported as a potential interference when the chloride concentration is high [31]. The effect of copper on the mercury signal was studied. First, Cu(II) and Hg(II) concentrations were fixed at constant value of 50 μg L-1 in the presence of different chloride concentrations. Results showed that as the concentration of chloride increases, the resolution between the peaks of both metals is low. Table 3 presents the potentials for mercury and copper at different chloride concentrations, showing the overlapping of peak signals at chloride concentration of 0.810 M.
Table 3. Effect of chlorides on the resolution of the Cu(II) and Hg(II) peaks in Square Wave - Anodic Stripping Voltammetry.
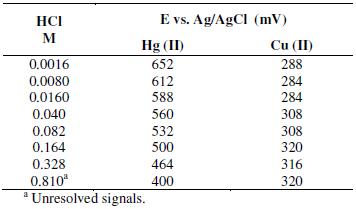
The overlapping of the copper and mercury signals at high chloride concentrations is prevented, when sample-electrolyte solution in the voltammetric cell is changed by fresh supporting electrolyte, before the stripping step. In the fresh electrolyte (HCl 0.010 M - 0.100 M HClO4) the mercury peak signal moves towards 700 mV, where there is no interference by copper. Using the previous experimental conditions, the effect of the copper concentration on the mercury signal was assessed, keeping the concentration of Hg(II) constant at 50 μg L-1 . In the interval of copper concentrations tested, from 50 to 1000 μg L-1 the mercury signal did not vary significantly, showing 8.7 % CV, which means that while the chloride concentration is low (≈0.010 M), Cu(II) is not a significant interference.
Another potential interfering element is iron. Fig. 5 shows the voltammograms obtained for Fe(III) (111 ± 2 mg L-1) and Hg (II) (50 ± 2.9 μg L-1) without changing the sample (Fig. 5a), and replacing the sample for fresh electrolyte (Fig. 5b), before the stripping step. The iron signal appears close to 500 mV, which again at high chloride concentrations could overlapped the mercury signal, Table 3. Thus, under this iron concentration, the lower Hg quantity possible for determination was 50 μg L-1. However, lower concentrations of Hg (≈10 μg L-1) were determined, when the sample was replaced by fresh electrolyte before the stripping step.
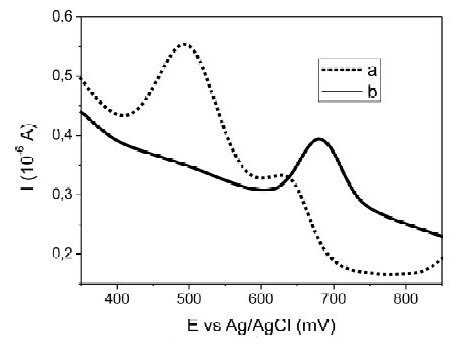
Figure 5. Effect of Fe(III) 111± 2 mg L-1 over Square Wave Anodic Stripping Voltammetry baseline of Hg(II), a) without changing the sample and, b) replacing the sample by fresh electrolyte solution (0.10 M HClO4 - 0.010 M HCl), before the stripping step.
Useful life time of the gold film
The life time of the gold film depends, mainly, on the level of poisoning due to the formation of Hg-Au amalgam on the surface, which decreases the effective area of the electrode. Potential scans (usually two or three) in supporting electrolyte solution (0.1 M HClO4 - 0.010 M HCl) with stirring until the mercury signal is no longer observed after each sample reading can prevent poisoning, but this procedure can be repeated three times at the most, and after that a new film is necessary.
Method verification and analysis of real samples
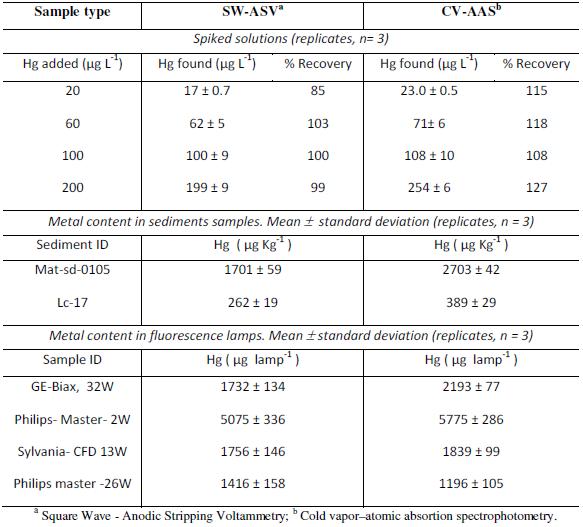
The analytical procedure developed was verified by the spiked method and applied to real samples of sediments and fluorescence lamps (Table 4). In each case, the results were contrasted with Cold Vapor Atomic Absorption Spectrophotometry (CV-AAS), finding good agreement.
Table 4. Verification and application of the developed method in real samples.
Conclusion
The standard method to determine Hg by SW-ASV, method 7472 of the Environmental Protection Agency US-EPA, is not useful when samples need to be extracted by means of aqua regia (as in the case of sediments and fluorescence lamps). The combination of high concentrations of chloride and nitrate ions in aqua regia extracts leads to a reduction in the sensitivity of the method, caused by adsorption processes of these ions. These adverse effects may be greatly reduced by exchanging sample-electrolyte for fresh supporting electrolyte before the stripping step. This also prevents the interference of Cu (II), Fe(II or III) and Pb (II). Although high concentrations of chlorides are a severe problem, small quantities of chlorides are necessary to improve the sensitivity of the method. That is true for even the best electrolyte found in this work, HClO4, because chloride helps to avoid the poisoning of the gold surface with Hg. On the other hand, calibration curves must use one fresh Au film per curve, and the sample must be tested in the same film to obtain adequate reproducibility; new samples require new Au films and a new calibration curve; this is in accordance with the short time life of the Au film; even more if the film is electrochemically cleaned after standards or samples readings. The optimized conditions found to quantify mercury, with LOD = 2.9 μg L-1 are adequate for working with samples such as sediments and fluorescence lamps, when an aqua regia extraction is necessary. The LOD was estimated as the intercept of the calibration curve for Hg linear interval 10 - 70 μg L-1 finding LOD = 1.1 μg L-1 for 0.1 M HClO4 - 1.00 M HCl electrolyte and 2.9 μg L-1 for aqua regia.
References
1. E.M. Nolan, S.J. Lippard, Chem. Rev. 108 (2008) 3443. [ Links ]
2. O. Barbier, G. Jacquillet, M. Tauc, M. Cougnon, P. Poujeol, Nephron Physiol. 99 (2005) 105. [ Links ]
3. US EPA http://www.epa.gov/mercury/eco.html. Last access on July 2009. [ Links ]
4. S.A. Counter, L.H. Buchanan, Toxicol. Appl. Pharm. 198 (2004) 209. [ Links ]
5. UNEP http://www.chem.unep.ch/mercury/partnerships/new_partnership.html. Last access on July 2009. [ Links ]
6. S.C. Hight, J. Cheng, Food Chem. 91 (2005) 557. [ Links ]
7. C.S. Chiou, S.J. Jiang, K.S.K. Danadurai, Spectrochim. Acta B 56 (2001) 1133. [ Links ]
8. L. Carrasco, S. Díez, J.M. Bayona, J. Chromatogr. A 1216 (2009) 8828. [ Links ]
9. E. Bramanti, C. Lomonte, M. Onor, R. Zamboni, A. D'Ulivo, D. Raspi, Talanta 66 (2005) 762. [ Links ]
10. M.S. Çelebi, H. Özyörük, A. Yildiz, S. Abaci, Talanta 78 (2009) 405. [ Links ]
11. M. Morita, J. Yoshinaga, J. Edmonds, Pure & Appl. Chem. 70 (1998) 1585. [ Links ]
12. M.A. Augelli, R.A.A. Muñoz, E.M. Ricther, Food Chem. 101 (2007) 579. [ Links ]
13. P. Ugo, S. Zampieri, L.M. Moretto, D. Paolucci, Anal. Chim. Acta 434 (2001) 291. [ Links ]
14. R.A.A. Munoz, F.S. Felix, M.A. Augelli, T. Pavesi, L. Angnes, Anal. Chim. Acta 571 (2006) 93. [ Links ]
15. C.A. Melendres, F. Hahn, G.A. Bowmaker, Electrochim. Acta 46 (2000) 9. [ Links ]
16. C.A. Melendres, F. Hahn, J. Electroanal. Chem. 463 (1999) 258. [ Links ]
17. E. Herrero, H.D. Abruña, Langmuir 13 (1997) 4446. [ Links ]
18. Y. Bonfil, M. Brand, E. Kirowa-Eisner, Anal. Chim. Acta 424 (2000) 65. [ Links ]
19. G. Jarzabek, Z. Borkoswka, Electrochim. Acta 42 (1997) 2915. [ Links ]
20. A. Giacomino, O. Abollino, M. Malandrino, E. Mantasti, Talanta 75 (2008) 266. [ Links ]
21. S.S. Ermakov, A.V. Borzhitskaya, L.N. Moskvin, J. Anal. Chem. 56 (2001) 542. [ Links ]
22. S. Trasatti, O.A. Petrii, Pure & Appl. Chem. 63 (1991) 711. [ Links ]
23. F. Silva, A. Martins, J. Electroanal. Chem. 467 (1999) 335. [ Links ]
24. J. Li, E. Herrero, H.D. Abruña, Colloid. Surface. A 134 (1998) 113. [ Links ]
25. Z. Shi, J. Lipkowski, J. Electroanal. Chem. 403 (1996) 225. [ Links ]
26. F.J. Black, K.W. Bruland, A.R. Fregal, Anal. Chim. Acta 598 (2007) 318. [ Links ]
27. M. Giesen, D.M. Kolb, Surf. Sci. 468 (2000) 149. [ Links ]
28. A.J. Bard, L.R. Faulkner, Electrochemical methods, John Wiley & Sons, New York, 2001. [ Links ]
29. F. Okçu, F.N. Estaş, H. Estaş, Talanta 75 (2008) 442. 10.1016/j.talanta.2007.11.044
30. J. Mocak, A. Bond, S. Mitchell, G. Scollary, Pure & Appl. Chem. 69 (1997) 297. [ Links ]
31. F. Okçu, F.N. Ertaş, H.I. Gökçel, H. Tural, Turk. J. Chem. 29 (2005) 355.
*Corresponding author. E-mail address jaagredab@unal.edu.co
Received 25 July 2010; accepted 14 April 2011
Acknowledgements
This study was carried out under project QUIPU 202010011557 at Universidad Nacional de Colombia, DIB Bogotá, Colombia.

