


Serviços Personalizados
Journal
Artigo
 Inglês (pdf)
 Artigo em XML
 Referências do artigo
 Enviar este artigo por email
Indicadores
-
 Citado por SciELO
 -
 Acessos
Links relacionados
-
 Similares em
SciELO
Similares em
SciELO
Compartilhar

 Permalink
Portugaliae Electrochimica Acta
versão impressa ISSN 0872-1904
Port. Electrochim. Acta v.28 n.5 Coimbra 2010
Potentiometric Determination of Quetiapine Fumarate in Pharmaceutical Formulations
K.B. Vinay, H.D. Revanasiddappa and N. Rajendraprasad*
Department of Studies in Chemistry, Manasagangothri, University of Mysore, Mysore 570 006, India
DOI: 10.4152/pea.201005299
Abstract
Quetiapine (QTF) is a potent serotonin and dopamine receptor antagonist used to treat major depressive disorders and schizophrenia. A simple, precise, accurate and cost-effective titrimetric method for the determination of QTF in bulk drug and in its dosage forms has been developed and validated. The method is based on the potentiometric titration of QTF in glacial acetic acid with acetous perchloric acid using a modified glass-saturated calomel electrode system. The method is applicable over the range of 2.0 – 20.0 mg of QTF. The proposed method was successfully applied to the determination of QTF in its pharmaceutical dosage forms. The results obtained were favorably compared with those obtained using a reference method. The precision results, expressed by intra-day and inter-day relative standard deviation values, were satisfactory (RSD ≤ 1.2%). The accuracy was satisfactory as well (RE ≤ 1.33%). Excipients used as additives in pharmaceutical formulations did not interfere in the proposed procedures, as shown by the recovery study via standard addition technique with percentage recoveries in the range 98.25-101.0 %, with a standard deviation of ≤ 0.62-1.52%.
Keywords: quetiapine fumarate, determination, dosage form, non-aqueous titrimetry.
Introduction
Quetiapine fumarate (QTF), chemically known as 2-(2-(4-dibenzo[b,f] [1,4]thiazepine-11-yl-1-piperazinyl)ethoxy)ethanol, fumaric acid (1 : 2 salt), is an atypical antipsychotic drug [1] used for the treatment of schizophrenia, acute manic bipolar disorder. Recently, it was approved by the FDA for the treatment of depressive episodes associated with Bipolar I (Bipolar II) disorder as a monotherapeutic agent.
Owing to its use as an antipsychotic drug, it has attracted the attention of many analysts. QTF is not official in any pharmacopoeia. Methods based on several techniques including HPLC [2-10], LC-ESI-MS-MS [11], UPLC [12, 13], GC [14], and voltammetry [15] have been applied for its determination in biological materials. Different methods have been employed for the determination of QTF in pharmaceuticals. These include UV-spectrophotometry [16, 17], polarography [18], capillary zone electrophoresis [17, 19], high-performance liquid chromatography [20-22] and high-performance thin layer chromatography [23, 24].
Although chromatographic methods offer high degree of specificity, yet, sample clean up, sample pre-treatment and the instrument limitations preclude their use in routine analysis of pharmaceutical samples. Potentiometric method with glass electrode can provide very accurate and sharp end points, valuable and straightforward means of assaying drug in pharmaceutical formulations because of the possibility to determine directly the active basic nitrogen containing moiety. The instrument used is low-cost, easy to use and maintenance. Simplicity and speed of assay procedure, and the reliability of the analytical information make the technique very attractive for the assay of pharmaceutical products.
Literature survey revealed that no titrimetric method has ever been reported for the analysis of QTF in pharmaceutical preparations. In the present paper, a validated potentiometric procedure is described for the determination of QTF in pharmaceuticals and its formulations without applying any sample pre-treatment or clean up procedures. The method is based on the basic property of the drug molecule, in which the solution of drug in glacial acetic acid was titrated directly with acetous perchloric acid potentiometrically, using a modified glass-saturated calomel electrode system. The method, in addition to being rapid, sensitive and precise, gave satisfactory results when applied to formulations containing QTF. The reported potentiometric procedure has the distinct advantages over the previously reported methods in terms of simplicity of technique and ease of performance, and does not need expensive and highly sophisticated equipment or high-cost organic solvents which are required for HPLC technique. Therefore, the proposed method can be used in laboratories where modern and expensive instruments are not available.
Experimental
Apparatus
An Elico 120 digital pH meter provided with a combined glass-SCE electrode system was used in the titration. The KCl of the salt bridge was replaced with saturated solution of KCl in glacial acetic acid.
Materials and reagents
All chemicals used were of analytical reagent grade. All solutions have been made in glacial acetic acid (S. D. Fine Chem, Mumbai, India) unless mentioned otherwise.
Materials
QTF pure drug was kindly provided by Cipla Ltd, Bangalore, India, as a gift, and used as received. Qutipin-200 and Qutipin-100 (both from Sun Pharmaceuticals Ltd, India) tablets were purchased from local market.
Reagents
Perchloric acid ( 0.01 M): The stock solution of (~0.1 M) perchloric acid (S. D. Fine Chem, Mumbai, India) was diluted appropriately with glacial acetic acid to get a working concentration of 0.01 M and standardized with pure potassium hydrogen phthalate (S. D. Fine Chem, Mumbai, India) [25].
Crystal violet indicator (0.1 %): Prepared by dissolving 50 mg of dye (S. D. Fine Chem, Mumbai, India) in 50 mL of glacial acetic acid.
Standard drug solution
A stock standard solution containing 2 mg mL-1 QTF was prepared in glacial acetic acid.
Procedure
General analytical procedure
An aliquot of the standard drug solution equivalent to 2.0-20.0 mg of QTF was measured accurately and transferred into a clean and dry 100 mL beaker and the solution was diluted to 25 mL by adding glacial acetic acid. The combined glass-SCE (modified) system was dipped in the solution. The contents were stirred magnetically and the titrant (0.01 M HClO4) was added from a microburette. Near the equivalence point, titrant was added in 0.05 mL increments. After each addition of titrant, the solution was stirred magnetically for 30 s and the steady potential was noted. The addition of titrant was continued until there was no significant change in potential on further addition of titrant. The equivalence point was determined by applying the graphical method. The amount of the drug in the measured aliquot was calculated from
Amount (mg) = VMwR/n
where V = volume of perchloric acid required, mL; Mw = relative molecular mass of the drug (615.66), R = molarity of the perchloric acid and n = number of moles of perchloric acid reacting with each mole of QTF.
Analysis of tablets
Twenty tablets were weighed accurately and pulverised. A weighed quantity of the tablet powder equivalent to 200 mg QTF was transferred into a clean and dried 100 mL volumetric flask. The flask was shaken for 20 min with 60 mL of acetic acid, the volume was brought to 100 mL with the same solvent. After 5 min, the solution was filtered through a Whatman No. 42 filter paper. First 10 mL of the aliquot was discarded. A suitable aliquot was next subjected to analysis as described earlier.
Validation study
The optimized titrimetric methods were completely validated according to the procedures described in ICH guidelines Q2(R1) for the validation of analytical methods [26].
Linear regression
A standard calibration curve was obtained with six QTF solutions, 2, 4, 8, 12, 16 and 20 mg. Volumes of 1, 2, 4, 6, 8 and 10 mL of the standard QTF stock solution (2 mg mL-1) were transferred to 100 mL beakers and total volume was brought to 25 mL by adding glacial acetic acid. Each sample was titrated to a potentiometric end point as described earlier, and each calibration point was performed in triplicate. The linearity between the amount of QTF in mg versus volume of titrant (0.01 M HClO4) consumed was estimated by linear regression analysis by the method of least square regression.
Precision
The intra-day precision was evaluated by analyzing pure QTF solution at three different levels (6, 12 and 18 mg) using the described procedure. Similarly the inter-day precision was evaluated on five consecutive days (n=15). QTF content and the relative standard deviations (RSD) were calculated in each case.
Accuracy
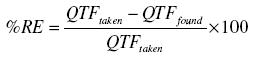
The accuracy of the method was checked by calculating the found QTF in each case and for each level of QTF found, the percentage relative error was calculated by using the following formula:
Discussion
The present method is based on the neutralization reaction involving the basic property of QTF and employs a potentiometric based procedure.
Acetic acid displays acidic properties in dissociating to produce protons [27]:
![]()
But in the presence of perchloric acid, a far stronger acid, it will accept a proton:
![]()
![]()
The CH3COOH2+ can very readily give up its proton to react with a base, so basic properties of a base are enhanced and hence, titration between weak base and perchloric acid can often be accurately carried out using acetic acid as solvent.
Since, QTF is having 3 basic nitrogen atoms in its molecular structure, the enhanced basicity of QTF in acetic acid medium is due to non-lavelling effect of acetic acid and the determination of QTF is much easier. The procedure involves the titration of QTF with perchloric acid with potentiometric end point detection. A steep rise in the potential was observed at the equivalence point (Fig. 1).

Figure 1. Typical potentiometric titration curves for 10 mg of QTF vs. 0.01 M HClO4.
A reaction stoichiometry of 1:3 (drug:titrant) was obtained, serving as the basis for calculation. Using 0.01 M perchloric acid, 2.0-20.0 mg of QTF were conveniently determined. The relationship between the drug amount and the titration end point was examined. The linearity between both the parameters is apparent from the correlation coefficient of 0.9985 obtained by the method of least squares. From this it is implied that the reaction between QTF and perchloric acid proceeds stoichiometrically in the ratio 1:3 in the range studied. Based on the above study the following reaction pathway is postulated.
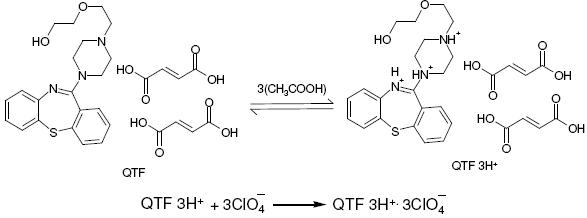
Scheme 1. Possible reaction for the neutralization.
Results
Validation of the proposed analytical procedure
Linearity
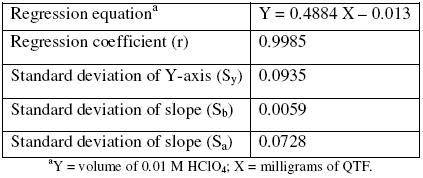
A linear curve was constructed by plotting the volume of perchloric acid in each concentration and the milligrams of QTF taken (n = 3). The linear regression analysis showed good linearity for the QTF range of 2.0 to 20.0 mg, with a regression coefficient over 0.9985 (Table 1).
Table 1. Linear regression analysis result for standard QTF solutions
Intra-day and inter-day accuracy and precision
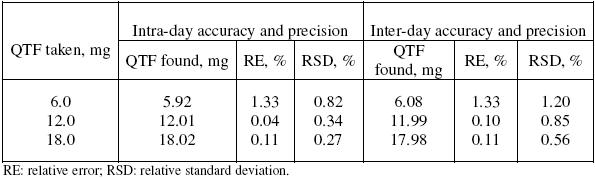
The precision of the methods was evaluated in terms of intermediate precision (intra-day and inter-day). Three different amounts of QTF within the range of this study were analysed in seven and five replicates during the same day (intra-day precision), and five consecutive days (inter-day precision). For inter-day precision, each day analysis was performed in triplicate and a pooled-standard deviation was calculated. The RSD values of intra-day and inter-day studies for QTF showed that the precision of the method was good (Table 2). The accuracy of the method was determined by the percent mean deviation from known concentration, and results are presented in Table 2.
Table 2. Intra-day and inter-day accuracy and precision data.
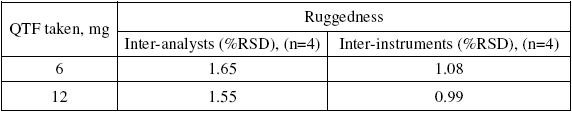
Ruggedness of the method
Method ruggedness was expressed as the RSD of the same procedure applied by four different analysts as well as using four different burettes. The inter-analysts RSD were within 1.65% whereas the inter-buretts RSD for the same QTF amounts was less than about 1.08% suggesting that the developed method was rugged. The results are shown in Table 3.
Table 3. Method ruggedness expressed as intermediate precision (% RSD).
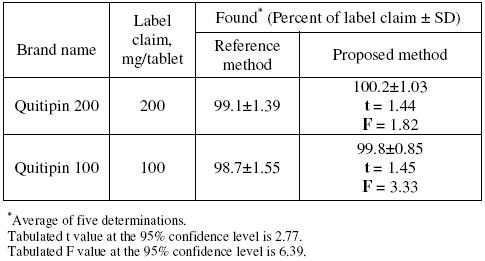
Application
The described potentiometric procedure was applied to the determination of QTF in its pharmaceutical formulations (Quitipin tablets of 200 and 100 mg QTF/tablet). The results obtained (Table 4) were statistically compared with those obtained using a conventional UV spectrophotometric method [17], where the absorbance of the methanolic solution of QTF was measured at 246 nm. The results obtained by the proposed method agreed well with those of the reference method and with the label claim. The results were also compared statistically by Students t-test for accuracy and by variance F-test for precision [28] with those of the reference method at 95 % confidence level, as summarized in Table 4. The results showed that the calculated t-and F-values did not exceed the tabulated values inferring that proposed method is as accurate and precise as the reference method.
Table 4. Results of assay in tablets and comparison with official method.
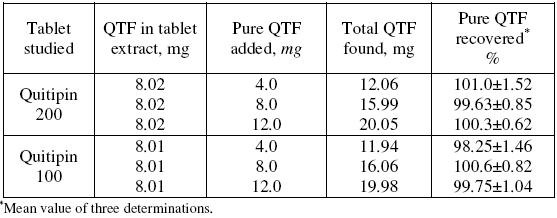
Recovery study
Accuracy and the reliability of the method were further ascertained by performing recovery experiments. To a fixed amount of drug in formulation (pre-analysed): pure drug at three different levels was added, and the total was found by the proposed method. Each test was repeated three times. The results compiled in Table 5 show that recoveries were in the range from 98.25 to 101.0% indicating that commonly added excipients to tablets did not interfere in the determination.
Table 5. Results of recovery study using standard addition method.
Conclusion
A simple, rapid, cost-effective and rugged method was developed and validated for the determination of QTF in bulk drug and in tablets. The proposed potentiometric method could be successfully applied to the determination over 2-20 mg of QTF. Considering the results obtained, it is possible to affirm that the method is rapid, selective, both accurate and precise and hence suitable for the determination of QTF in tablets. The proposed method has the distinct advantages over the existing methods in terms of simplicity of technique and ease of performance and does not need expensive and highly sophisticated equipment or high-cost organic solvents which are required for HPLC technique. Hence, the method can be used in routine analysis in pharmaceutical quality control laboratories.
Acknowledgements
Authors are heartily thankful to Cipla Ltd, Bangalore, India, for providing pure QTF sample. Authors also thank the University of Mysore, Mysore, India, for providing facilities to carry out this work. One of the authors (NRP) is grateful to thank the University Grants Commission, New Delhi, India, for awarding Meritorious Research Fellowship.
References
1. M.A. Raggi, R. Mandrioli, V. Pucci, C. Sabbioni, Medicinal Chem. Rev. 1 (2004) 299-316. [10.2174/1567203043401761]
2. F. Belal, A. Elbrashy, M. Eid, J. J. Nasr, J. Liquid Chromatogr. Rel. Technol. 31 (2008) 1283-1298. [10.1080/10826070802019681]
3. K.Y. Li, Z.N. Cheng, X. Li, X.L. Bai, B.K. Zhang, F. Wang, H.D. Acta Pharmacol. Sin. 25 (2004)110-114.
4. B. Barrett, M. Holcapek, J.Huclova, V.Borek-Dohalsky, P. Fejt, B.Nemec, I. Jelinek, J. Pharm. Biomed. Anal. 44 (2007) 498-505. [10.1016/j.jpba.2007.03.034]
5. R. Nirogi, G. Bhyrapuneni, V. Kandikere, K. Mudigonda, D. Ajjala, K. Mukkanti, Biomed. Chromatogr. 22 (2008) 1043-1055. [10.1002/bmc.1012]
6. J. Sachse, J. Köller, S. Härtter, C. Hiemke, J. Chromatogr. B 830 (2006) 342-348. [10.1016/j.jchromb.2005.11.032]
7. M.A. Saracino, L. Mercolini, G. Flotta, L.J. Albers, R. Merli, M.A. Raggi, J. Chromatogr. B 843 (2006) 227-233. [10.1016/j.jchromb.2006.06.001]
8. S.A. Bellomarino, A.J. Brown, X.A. Conlan, N.W. Barnett, Talanta 77 (2009) 1873-1876. [10.1016/j.talanta.2008.10.023]
9. Z. Li, Z.R. Tan, D.S. Ouyang, G. Wang, L.S. Wang, G. Zhou, D. Guo, Y. Chen, H.H. Zhou, Yaowu Fenxi Zazhi 28 (2008) 706-708.
10. W.B. Li, Y.Z. Xue, Y.M. Zhai, J. Zhang, G.X. Guo, C.Y. Wang, Z.J. Cai, Yaowu Fenxi Zazhi 23 (2003) 247-251.
11. S.N. Lin, Y. Chang, D.E. Moody, R.L. Foltz, J. Anal. Tox. 28 (2004) 443-448.
12. K-Y. Li, Y-G. Zhou, H-Y. Ren, F. Wang, B-K. Zhang, H-D. Li, J. Chromatogr. B 850 (2007) 581-585. [10.1016/j.jchromb.2006.12.051]
13. J.Y. Tu, P. Xu, D.H. Xu, H.D Li, Chromatographia 68 (2008) 525-532. [10.1365/s10337-008-0770-8]
14. V.N. Atanasov, K.P. Kanev, M.I. Mitewa, Central Eur. J. Med. 3 (2008) 327-331. [10.2478/s11536-008-0015-0]
15. S.A. Ozkan, B. Dogan, B. Uslu, Microchim. Acta 153 (2006) 27-35. [10.1007/s00604-005-0457-x]
16. R.A. Fursule, D.K. Rupala, Md. Mujeeb Gulzar Khan, A.A. Shirkhedkar, S.J. Surana, Biosci. Biotechnol. Res. Asia 5 (2008). [www.biotech-asia.org/display.asp?id=429].
17. V. Pucci, R. Mandrioli, A. Ferranti, S. Furlanetto, M.A. Raggi, J. Pharm. Biomed. Anal. 32 (2003) 1037-1044. [10.1016/S0731-7085(03)00206-1]
18. N. El-Enany, A. El-Brashy, F. Belal, N. El-Bahay, Port. Electrochim. Acta 27 (2009) 113-125. [10.4152/pea.200902113] [ Links ]
19. S. Hillaert, L. Snoeck, W. van den Bossche, J. Chromatogr. 1033 (2004) 357-362.
20. S. Radha Krishna, B.M. Rao,N. Someswara Rao, Rasayan J. Chem. 1 (2008) 466-474.
21. C.H. Bharathi, K.J. Prabahar, C.H.S. Prasad, M. Srinivasa Rao, G.N. Trinadhachary, V. K. Handa, R. Dandala, A. Naidu, Pharmazie 63 (2008) 14-19. [10.1691/ph.2008.7174]
22. C.M. Fu, R.Z. Wang, Zhongguo Xinyao Zazhi 11 (2002) 144-146.
23. B. Dhandapani, A. Somasundaram, S. H. Raseed, M. Raja, K. Dhanabal, Int. J. Pharm. Tech. Res. 1 (2009) 139-141.
24. R. Skibiński, Ł. Komsta, I. Kosztyła, J. Planar Chromatogr. Modern TLC 21 (2008) 289-294. [10.1556/JPC.21.2008.4.12]
25. R.N. Jiri Kucharski, L.A. Safarik, Text Book of Titrations In Non-Aqueous Solvents, Elsevier Publishing Company, Amsterdam-London-New York, 1965, p.94.
26. International Conference on Harmonisation of Technical Requirements for Registration of Pharmaceuticals for Human Use, ICH Harmonised Tripartite Guideline, Validation of Analytical Procedures: Text and Methodology Q2(R 1): Complementary Guideline on Methodology dated 06 November 1996, incorporated in November 2005, London.
27. Ashutosh Kar, Pharmaceutical Drug Analysis, 2nd ed., New Age International Publisher, New Delhi, 2005. pp. 111-115.
28. J. Inczedy, T. Lengyel, A.M. Ure, IUPAC Compendium of Analytical Nomenclature: Definitive Rules, Blackwell Science Inc, Boston 1998.
Received 9 December 2009; accepted 9 November 2010
*Corresponding author
E-mail address: prasadtnpur@yahoo.co.in

