Serviços Personalizados
Journal
Artigo
Indicadores
-
 Citado por SciELO
 -
 Acessos
Links relacionados
-
 Similares em
SciELO
Compartilhar
Portugaliae Electrochimica Acta
versão impressa ISSN 0872-1904
Port. Electrochim. Acta v.28 n.1 Coimbra 2010
M. Yadav,* Dipti Sharma
Department of Applied Chemistry, Indian School of Mines University, Dhanbad-826004, India
Abstract
The inhibition of copper corrosion in 3.5% NaCl solution has been studied at 25 oC using three inhibitors: 1-phenyl-2,4-dithiobiuret(Inh I), 1-p-methoxyphenyl-2,4-dithiobiuret(Inh II) and 1-p-chlorophenyl-2,4-dithiobiuret(Inh III). The inhibition efficiencies of these compounds have been evaluated by weight loss and electrochemical methods (impedance spectroscopy and polarisation curves). The surface study was done by using SEM and ESCA techniques. The inhibition efficiencies of the inhibitors follow the sequence Inh II > Inh I > Inh III. The inhibitors Inh I, Inh II and Inh III appear to inhibit corrosion process through the formation of a protective film which was found to consist of Cu(I)-inhibitor complex, cuprous chloride CuCl or CuCl2- complex ions or both on the surface.
Keywords: dithiobiurets, copper, 3.5% NaCl, corrosion inhibition.
Introduction
Due to its high electrical and thermal conductivity and good mechanical workability, copper is a material widely used in pipelines for domestic and industrial water utilities, including sea water, heat conductors, and heat exchangers [1]. In spite of the relatively noble potential of copper, its corrosion takes place at a significant rate in sea water and chloride environments [1-13]. It is generally accepted that the anodic dissolution of copper in chloride environments is influenced by the chloride ions concentration. At chloride concentrations lower than 1 M, the dissolution of copper occurs through the formation of CuCl, which is not protective enough and is converted to the soluble by reacting with excess chloride [5]. On the other hand, at concentrations higher than 1 M, higher cuprous complexes such as are formed, in addition to the ones with fewer chlorides, such as CuCl and [14].
It is generally believed that corrosion inhibitors effectively eliminate the undesirable destructive effects of aggressive media and prevent copper dissolution. Organic compounds containing polar groups including nitrogen, sulphur, and oxygen [15-17] and heterocyclic compounds with polar functional groups and/or conjugated double bonds [18-19] have been reported to inhibit copper corrosion. The inhibiting action of these compounds is usually attributed to their interactions with the copper surface via their adsorption. Polar functional groups are usually regarded as being a reaction center by establishing the adsorption process [20]. However, the adsorption of an inhibitor on a metal surface depends on several factors [21], such as the nature and surface charge of the metal, the adsorption mode, the inhibitor’s chemical structure, and the type of the electrolyte solution.
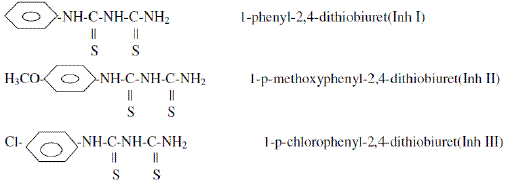
In the present investigation, experiments have been performed to assess the inhibitive action of 1-phenyl-2,4-dithiobiuret(Inh I), 1-p-methoxyphenyl-2,4-dithiobiuret (Inh II) and 1-p-chlorophenyl-2,4-dithiobiuret(Inh III towards the corrosion inhibition of copper in 3.5% NaCl solution at 25 oC.
Experimental
Copper specimens taken for experiments were supplied by M/s Good Fellow Metals Ltd England(99.99% pure Cu). Ammonium thiocyanate (from Sigma-Aldrich, 95%), sodium chloride (NaCl, Merck 99%), and absolute ethanol (C2H5OH, Merck, 99.9%) were used as received. The samples for the weight loss and electrochemical polarization studies were of the size 3 cm × 2 cm × 0.1 cm and 2 cm × 1 cm × 0.1 cm, respectively. The samples were polished successively with 1/0 – 4/0 grade emery papers, washed with benzene followed by hot soap solution and finally with distilled water. They were degreased by immersing in acetone for 1-2 min, dried and stored in vacuum desiccator. The weight loss experiments were carried out in 500 mL corning glass beakers with lid containing 300 mL of electrolyte (3.5% NaCl by weight) in static condition. The inhibition efficiencies were evaluated after a period of 120 h using 20, 50, 100 and 150 ppm of compounds Inh I, Inh II and Inh III, through the formula
% IE = θ × 100
where θ is the fraction of surface area covered by inhibitor, and θ=(a-b)/a, where a is weight loss of the sample in absence of the inhibitor, and b is the weight loss of the sample in presence of inhibitor. After removing the specimens from the electrolytes, they were washed thoroughly with distilled water, dried and then weighed. Mean of weight loss values of three identical experiments were used to calculate the inhibition efficiencies of the inhibitors. The electrochemical experiments were performed using a VoltaLab-10 electrochemical analyser containing Voltamaster 4.0 software. Polarization curves were recorded using a three electrode electrochemical cell consisting of a 2 x 1 x 1 cm sized copper specimen with 1 cm2 exposed area, a platinum foil, and a saturated calomel electrode, as working, auxiliary and reference electrodes, respectively. For potentiodynamic polarization experiments, the potential was scanned from -600 to 500 mV at a scan rate of 1 mV/s. Electrochemical Impedance Spectroscopy (EIS) measurements were performed between 100 kHz and 0.05 Hz frequency range. The working copper electrode was clamped in a glass rod and the temperature was maintained constant by using an electronically controlled air thermostat.
The compounds Inh I, Inh II and Inh III were synthesized in the laboratory by refluxing arylamines and isoperthionic acid in ethanol for half an hour. The reaction is described as

Isoperthionic acid was synthesised by mixing ammonium thiocyanate (50 gm), water (50 mL) and conc. HCl (50 mL) and allowing the reaction mixture to stand for 4 days. The precipitated isoperthionic acid was filtered and washed with dilute HCl followed by water. The dark yellow product was dried, m.p. 320 ºC. This compound was directly used for the synthesis of 1-aryl-2,4-dithiobiurets.
A representative experiment for the synthesis of 1-phenyl-2,4-dithiobiuret is given as follows :
Isoperthionic acid (0.1 mol) and aniline (0.1 mol) were heated together on a water bath with occasional stirring for one hour. A pasty mass was obtained which was extracted with ethanol (25 mL) under reflux for half an hour. After addition of more ethanol (25 mL) the refluxing was continued for another 15 minutes when most of the product went into solution leaving behind elemental sulphur. It was then filtered under hot conditions. On cooling, light yellow crystals of 1-phenyl-2,4-dithiobiuret were obtained, m.p. 184 ºC yield (64%).
The structural formulae of Inh I, Inh II and Inh III used in this study are shown below:
For calculating %IE by electrochemical polarization method we use the formula

where I0 = corrosion current in absence of the inhibitor; Iinh = corrosion current in presence of inhibitor.
% IE by impedance measurements were calculated by using the formula

where Rct is the charge transfer resistance of the metal in absence of the inhibitor and Rct(Inh) is the charge transfer resistance in presence of the inhibitor.
Results and discussion
The inhibition efficiency values of all the inhibitors at various concentrations at 25 oC calculated by weight loss and polarisation techniques have been mentioned in Table I.
Table 1. Percentage inhibition efficiency (% IE) values calculated by weight loss and polarization techniques for Inh I, Inh II and Inh III at 25 oC.

It is evident from the data in the table that inhibition efficiencies (IEs) of all the inhibitors increase with increasing the concentration and become more or less constant at 150 ppm. The IEs of these inhibitors follow the sequence:
Inh II > Inh I > Inh III
Considering the potential dependent adsorption of these molecules, the effectiveness of these inhibitors can be correlated with the structure and size of inhibitors’ molecules.
Most of the organic compounds and metal complexes used as inhibitors have been found to inhibit corrosion process following the mechanism of adsorption [22]. Assuming that this mechanism is valid for present molecules as well, IE of these inhibitors can be explained in terms of the number of active centres for the adsorption, delocalized electron density and the projected surface area covered as a result of their adsorption. The inhibitors Inh I, Inh II and Inh III have nearly the same size and number of active centres, but Inh II shows higher IE than the Inh I, due to higher delocalised p-electron density at benzene ring. The delocalised p-electron density at benzene ring in case of Inh II is more than the Inh I due to electron donating nature of methoxy (-OCH3) group. The delocalized p-electron density at benzene ring in case of Inh III is less than that of Inh I, due to electron withdrawing nature of chloro (-Cl) group. It may be noted that it does not exist any direct correlation between magnitude in increase in IE values and the number of expected sites of adsorption and size. This may be due to the fact that the number of active centres actually involved in adsorption may be different than the number of active centres present in the molecules owing to their geometry.
The electrochemical polarization behaviour of copper was studied in 3.5% NaCl solution containing different concentrations of inhibitors, Inh I, Inh II and Inh III at 25 oC. Fig. 1(a,b,c) represent the electrochemical polarization behaviour of copper in 3.5% NaCl solution at 25 oC in absence and presence of different concentrations of inhibitors I, II and III, respectively.
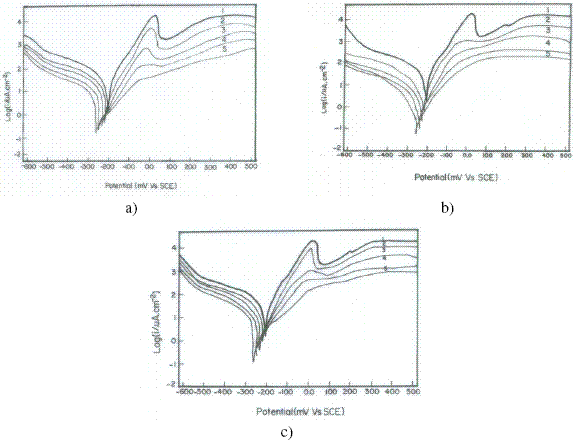
Figure 1. Electrochemical polarisation of Cu in 3.5% NaCl solution in presence of (a) Inh I, (b) Inh II and (c) Inh III at 25 oC.
As reported earlier [20], the anodic polarisation curve in absence of inhibitor exhibits Tafel region at lower applied potential, extending to a peak current density (Ipeak) due to the dissolution of copper into Cu+, a region of decreasing current until a minimum (Imin ) is reached due to formation of CuCl, and a region of sudden increase in current density leading to a limiting value (Ilim.) as a result of the formation of soluble CuCl2-. The nature of polarization curve in case of Inh I , Inh II and Inh III (Fig.1a,b,c) resembles the curves in its absence with slight gradual shift towards lower current density at all the concentrations.
Thus, Inh I ,Inh II and Inh III may be considered to inhibit corrosion of copper by blanketing a part of the electrode surface, due to the formation of a protective film of Cu(I)-inhibitor complex, and it polarizes the anode without affecting the basic mechanism of corrosion. In case of Inh I and Inh II (Fig.1.a,b), although the nature of polarisation curves remains unaltered, the magnitude of shift towards lower current density is much larger than that for Inh III (Fig.1c). The shift toward lower current density is higher for Inh II as compared to Inh I, which is higher as compared to Inh III.
The decrease in Icorr, Ipeak, and Imin values in presence of inhibitors is mainly due to the decrease in the chloride ion attack on the copper surface, due to the adsorption of the inhibitors. The negative shift in the Ecorr in presence of inhibitors on increasing the concentration of the inhibitors is due to the decrease in the rate of cathodic reaction. Moreover, the increase in the cathodic and anodic Tafel slopes (βc and βa)are related to the decrease in both the cathodic and anodic currents. This indicates that all the inhibitors are good corrosion ones for copper in seawater, and their inhibition efficiency increases on increasing their concentrations. At higher concentrations, the Tafel region almost vanishes completely and the peak current density disappears for all inhibitors. Therefore, Inh I, Inh II and Inh III may be considered to inhibit the corrosion process, both through chemical adsorption via formation of complex at the surface of the copper.
Fig. 1(a-c) show that addition of inhibitors Inh I, Inh II and Inh III significantly decreases the cathodic and anodic currents, with the corrosion potential (Ecorr.) values slightly shifted in the negative direction. Corrosion parameters such as Ecorr, Icorr, cathodic slope (bc), anodic slope (ba) and kcorr. obtained from Fig. 1(a-c) are given in Tables (2,3,4).The values of Ecorr and Icorr were calculated by using software Volta master4.0 version.
Table 2. Corrosion parameters obtained from potentiodynamic polarisation curves shown in Fig. 1a for copper electrode in 3.5% NaCI solution in the absence and presence of inhibitor Inh I.
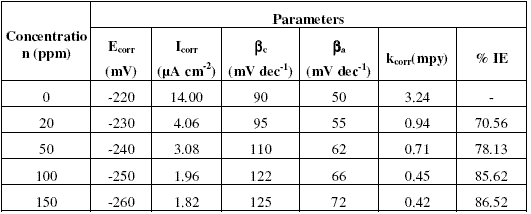
Table 3. Corrosion parameters obtained from potentiodynamic polarisation curves shown in Fig. 1b for copper electrode in 3.5% NaCl solution in the absence and presence of inhibitor Inh II.
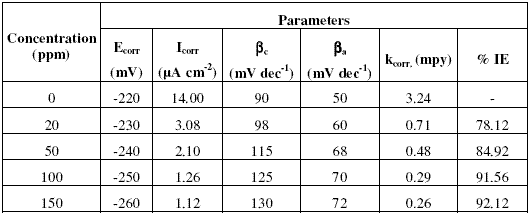
Table 4. Corrosion parameters obtained from potentiodynamic polarisation curves shown in Fig. 1c for copper electrode in 3.5% NaCl solution in the absence and presence of inhibitor Inh III.
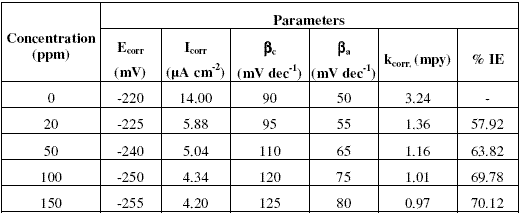
The decrease in corrosion current (Icorr), peak current (Ipeak), minimum current (Imin) and rate of corrosion (kcorr) values is mainly due to the decrease in the chloride ions attack on the copper surface, which causes the decrease in Cu dissolution by absorption of the inhibitor molecules. Furthermore, the increase in anodic and cathodic Tafel slopes (ba and bc ) values is related to the decrease in the anodic and cathodic currents, which in turn limits the electrodissolution of copper.
To get further information concerning the inhibition process and to confirm the potentiodynamic polarization experiments, electrochemical impedance spectroscopic investigations of Cu in absence and presence of inhibitors in 3.5% NaCl solution were carried out. Electrochemical impedance is a powerful tool in the investigation of the corrosion and adsorption phenomenon. The impedance data of Cu, recorded in presence of 150 ppm of Inh I, Inh II and Inh III in 3.5% NaCl solution at 25 oC as Nyquist plots are shown in Fig. 2.
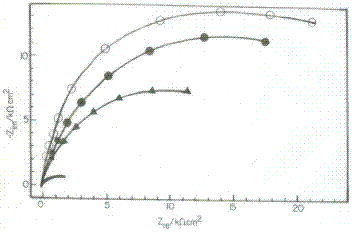
Figure 2. Nyquist plot for Cu in 3.5% NaCl solution in presence of 150 ppm of blank at 25 oC.
For a simple equivalent circuit consisting of parallel combination of a capacitor Cdl, and a charge transfer resister Rct, in series with a solution resister Rs, the electrode impedance (Z) in this case is represented by the mathematical formula

where a denotes an empirical parameter (0 £ a £ 1) and f is the frequency in Hz.
The impedance spectra obtained experimentally were analyzed using software provided with the electrochemical analyzer. The impedance data of the copper electrode in presence of 150 ppm of Inh I, Inh II and Inh III were analyzed using the equivalent circuit shown in Fig. 3.
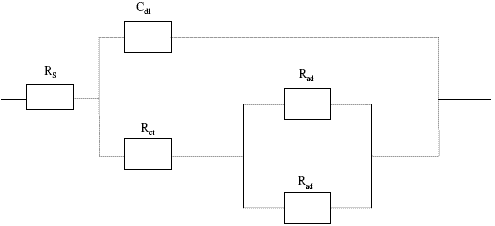
Figure 3. Equivalent circuit model used in the fitting of the impedance data of Cu in 3.5%NaCl solution at 25 oC.
where, Rs = sodium resistance; Rct = charge transfer resistance; Cdl = constant phase element of the double layer; Cad = constant phase element of the adsorbed layer; Rad = adsorbed layer resistance.
The calculated equivalent circuit parameters for Cu in 3.5% NaCl solution at 25 oC in presence of 150 ppm of Inh I, Inh II and Inh III are presented in Table 5.
Table 5. Equivalent circuit parameters and inhibition efficiency for Cu in 3.5% NaCl solution in presence of 150 ppm of Inh I, Inh II and Inh III at 25 oC.

From the data in Table 5, it is clear that the value of Rct increases on addition of the inhibitors, indicating that the corrosion rate decreases in presence of the inhibitors. It is also clear that the value of Cdl decreases on addition of inhibitors, indicating a decrease in the local dielectric constant and/or an increase in the thickness of the electrical double layer, suggesting that all the inhibitor molecules function by formation of the protective layer at the metal surface.
In order to confirm the potentiodynamic results, the corrosion inhibition efficiency (IE) in presence of 150 ppm concentration of Inh I, Inh II and Inh III in 3.5% NaCl solution at 25 oC was also calculated from the corresponding electrochemical impedance data according to

where Rct is the charge transfer resistance of the metal in absence of inhibitor and Rct(Inh) is the charge transfer resistance in presence of the inhibitor.
The values of IEs are included in Table 5 and represented graphically in fig.2. The inhibition efficiencies calculated from impedance data are very close to those obtained from potentiodynamic polarisation measurement. The results show the good agreement between measurements obtained from both techniques.
Analysis of ESCA spectra
The ESCA patterns of the protective films formed on copper surface immersed in 3.5% NaCl solution in the absence and presence of the inhibitor is shown in Figure 4. This ESCA pattern is interpreted with the help of data obtained from the literature [16] and experimental data taken from the Regional Sophisticated Instrumentation Centre, IIT Chenai, India, for various elements exhibiting peaks at characteristic binding energy values.
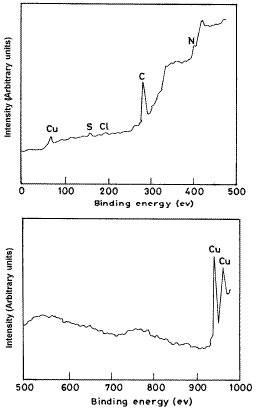
Figure 4: ESCA pattern of the surface film formed on copper immersed in 3.5%NaCl solution in the presence of 150 ppm of the inhibitor Inh II at 25 oC.
From Fig. 4, it is observed that in the presence of the inhibitor, the peak at 72 eV corresponds to 3p electrons of copper, and the peaks at 934 eV and 950 eV are due to 2p electrons of copper. The peak at 198 eV is due to 2p electrons of chlorine. The peak at 286 eV is due to 1s electron of carbon atom. The observed peak at 162 eV is due to 2p electrons of sulphur atom. The peak at 401 eV is due to 1s electron of nitrogen atom. The presence of all the elements present in the inhibitor at the surface of the metal suggests the adsorption of the inhibitor and formation of Cu(I)-inhibitor protective layer at the surface of the metal.
SEM study
Fig. 5(a, b, c) show the micrographs for copper in 3.5%NaCl solution in absence and presence of 150 ppm of Inh II at 200X magnification. On comparing these micrographs, it appears that in the presence of inhibitor the surface of the test material has improved remarkably with respect to its smoothness. Smoothening of the surface would have been caused by the deposition of inhibitor molecules on it and thus, the surface is fully covered.
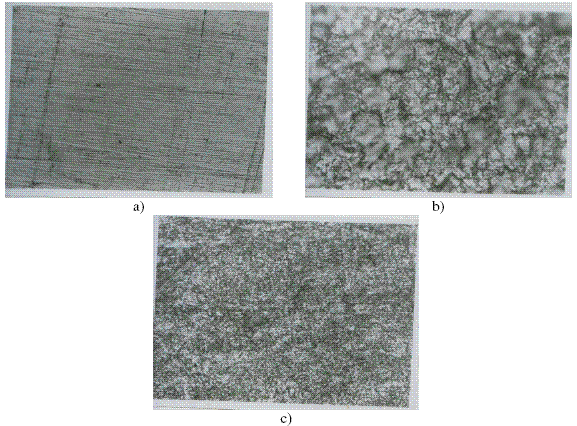
Figure 5. SEM image of copper: (a) polished sample; (b) exposed to 3.5% NaCl solution; (c) in presence of 150 ppm of Inh II.
Conclusions
(i) All the three compounds Inh I, Inh II and Inh III act as efficient mixed corrosion inhibitor for copper in 3.5% NaCl solution and % IE of Inh I can be increased or decreased by a suitable substitution.
(ii) Inh II shows appreciably higher efficiency than the Inh I and Inh III due to the presence of electron donating methoxy(–OCH3 ) group. Inh III shows least inhibition efficiency due to the presence of electron withdrawing chloro( –Cl ) group.
(iii) The percentage inhibition efficiencies of these inhibitors follow the order Inh II > Inh I > Inh III.
(iv) EIS measurements show that charge transfer resistance increases in presence of the inhibitors. SEM and ESCA experiments suggest that the copper corrosion is inhibited by the formation of a protective layer of Cu(I)-inhibitor complex on the copper surface.
Acknowledgement
Financial assistance from Department of Science and Technology, New Delhi, India, under the Fast Track Young Scientist Scheme to M. Yadav is gratefully acknowledged.
References
1. E. Nunez, F. Reguera, E. Corvo, E. Gonzalez, C. Vazquez, Corros. Sci. 47 (2005) 561.
2. H. Otmacic, J. Telegdi, K. Papp, E. Stupnisek-Usac, J. Appl. Electrochem. 34 (2004) 545. 10.1023/B:JACH.0000021873.30314.eb
3. E.M. Sherif, S.-M. Park, J. Electrochem. Soc. B 152 (2005) 428. 10.1149/1.2018254
4. A. Hamelin, In: B.E. White, J.O.M. Bockris, Editors, Modern Aspects of Electrochemistry (No. 16), Plenum, New York/London (1980).
5. A. El-Warraky, H.A. El-Shayeb, E.M. Sherif, Anti-Corros. Meth. Meter. 51 (2004) 52. 10.1108/00035590410512735
6. E.M. Sherif, S.M. Park, J. Electrochem. Soc. 152 (2005) 428. 10.1149/1.2018254
7. E.M. Sherif, S.M. Park, Corros. Sci. 48 (2006) 4065. 10.1016/j.corsci.2006.03.011
8. G.P. Cicileo, B.M. Rosales, F.E. Varela, J.R. Vilche, Corros. Sci. 11 (1998) 1915. 10.1016/S0010-938X(98)00090-0
9. M. Finsgar, I. Milosev, B. Pihlar, Acta Chim. Slov. 54 (2007) 591.
10. M.A. Amin, J. Appl. Electrochem. 36 (2006) 215. 10.1007/s10800-005-9055-1
11. K.M. Ismail, Electrochim. Acta 52 (2007) 7811. 10.1016/j.electacta.2006.11.004 [ Links ]
12. M.M. Singh, R.B. Rastogi, B.N. Upadhyay, Corrosion 50 (1994) 620.
13. M.M. Singh, R.B. Rastogi, B.N. Upadhyay, Bull. Electrochem. 12 (1996) 26.
14. H.P. Lee, K. Nobe, J. Electrochem. Soc. 133 (1986) 2035. 10.1149/1.2108335
15. A.G. Christy, A. Lowe, V. Otieno-Alego, M. Stoll, R.D. Webster, J. Appl. Electrochem. 34 (2004) 225. 10.1023/B:JACH.0000009923.35223.f8
16. S. Chen Wang, S. Zhao, J. Electrochem. Soc. B. 151 (2004) 11.
17. M. Kendig, S. Jeanjaquet, J. Electrochem. Soc. B. 149 (2002) 47.
18. M.A. Elmorsi, A.M. Hassanein, Corros. Sci. 41 (1999) 2337. 10.1016/S0010-938X(99)00061-X
19. F.H. Al-Hajjar, F.M. Al-Kharafi, Corros. Sci. 28 (1888) 163. 10.1016/0010-938X(88)90093-5
20. M.G. Fontana, K.W. Sleaehie, Advances in Corrosion Science and Technology, Vol.1, Plenum, New York (1970).
21. O.L. Riggs Jr., Corrosion Inhibitors (second ed.), NACE, Houston, TX (1973).
22. M.M. Singh, R.B. Rastogi, M. Yadav, Mater. Chem. Phys. 80 (2003) 283. 10.1016/S0254-0584(02)00513-8
Received 21 July 2009; accepted 27 November 2009
* Corresponding author: yadav_drmahendra@yahoo.co.in


