


Serviços Personalizados
Journal
Artigo
 Inglês (pdf)
 Artigo em XML
 Referências do artigo
 Enviar este artigo por email
Indicadores
-
 Citado por SciELO
 -
 Acessos
Links relacionados
-
 Similares em
SciELO
Similares em
SciELO
Compartilhar

 Permalink
Portuguese Journal of Nephrology & Hypertension
versão impressa ISSN 0872-0169
Port J Nephrol Hypert vol.32 no.2 Lisboa jun. 2018
ORIGINAL ARTICLE
Nutritional assessment of patients with chronic kidney disease under treatment with peritoneal dialysis
Lívia Almeida Alvarenga1, Michelle Andrade Moreira2, Beatriz Cristina Pereira2, Ana Paula Carlos Cândido2, Aline Silva de Aguiar2
1 Ouro Preto Federal University. Nutrition School. Post Graduate Programme in Health and Nutrition. Nutrition School. Ouro Preto, Minas Gerais, Brazil.
2 Juiz de Fora Federal University. Institute of Biological Sciences. Department of Nutrition. Juiz de Fora, Minas Gerais, Brazil.
ABSTRACT
Introduction: Peritoneal dialysis is a renal replacement therapy that allows the patient to live with a certain degree of autonomy and flexibility. Nutritional diagnosis is crucial, considering the high prevalence of nutritional disorders amongst this population and its correlation with the clinical prognosis. The aim of the current study is to evaluate the nutritional state of patients receiving peritoneal dialysis.
Methodology: This is a cross‑sectional study realized with 30 patients undergoing peritoneal dialysis. Data collection was undertaken by scheduling appointments for nutritional assessment in which the following data were collected: anthropometric data, body composition, subjective global assessment, assessment of food consumption by means of 24‑hour dietary recall and food frequency questionnaire. Biochemical tests and clinical history were obtained from the patients records.
Results: Most patients were in good nutritional state, euvolemic. A positive statistical association was observed regarding phase angle and lean mass. The biochemical examinations showed that albumin, HDL‑c and vitamin D levels were below reference values, whilst phosphorus and parathyroid hormone were above the ideal values. While glucose in the dialysate did not present any statistical association with regard to serum glucose, glycated hemoglobin or triglycerides, it demonstrated statistical association in relation to the preservation of somatic muscle mass. Food consumption assessment showed inadequate protein intake. Conclusion: Patients had good nutritional state and statistical association for a satisfactory prognosis, but nutritional follow‑up was important in order to avoid complications.
Keywords: anthropometry, body composition, chronic renal insufficiency, food consumption, peritoneal dialysis.
INTRODUCTION
Chronic kidney disease (CKD) develops due to progressive and irreversible kidney functionality loss, which results in homeostatic imbalance in the organism because of adjustments that occur to supplant the worsening in renal function. Thus, renal replacement therapy is necessary in the final stage of the disease1. According to the National Institutes of Health, in 2013 117,162 people were undergoing renal replacement therapy in the USA, 9% of which were under peritoneal dialysis (PD)2. In Latin America, PD was more frequent in El Salvador and in Mexico, representing 67.6% and 55.9%, respectively3. In Brazil, the estimated number of patients receiving dialysis in 2014 is 112,004, 9% of which under PD4.
PD is a renal replacement therapy that allows the patient to overcome difficulties imposed by the geographical conditions, providing a certain degree of autonomy and flexibility in lifestyle3‑5.
According to Ellam Wikie (2011), the most common complication related to PD is peritonitis, but other problems may also arise, e.g. catheter problems and insufficient removal of water or solute5. Patients undergoing PD also have a greater risk of having carbohydrate‑and fat‑related metabolic disorders, especially due to glucose absorption during dialysis, which might cause hyperglycemia, resistance to insulin, dyslipidemia and cardiovascular disorders6.
With regard to nutritional state, patients under treatment with PD have augmented risk of protein‑energy wasting (PEW) due to underlying diseases, associated comorbidities, psychosocial factors and symptoms such as anorexia, abdominal fullness and delayed gastric emptying, being thus associated with major risk factors for morbidity and mortality7. Nevertheless, those patients are also exposed to the risk of developing overweight and obesity due to the involuntary absorption of glucose from the dialysis fluid. Unlike PEW, however, this weight gain is not linked to rise in the risks of morbidity and mortality8.
In this context, the type of criteria used to evaluate the patients body composition in PD becomes important, since depending on the method used, the prevalence of muscle wasting (sarcopenia) can be altered.
In addition, particular characteristics of the population studied may also influence the results. Sarcopenia in CKD patients is called uremic sarcopenia, and is defined as the presence of low skeletal muscle mass, low muscle strength, poor physical performance, or both. However, there is no universal definition for muscle wasting39‑41.
In the study of Ashabi et al. (2018) the prevalence of uremic sarcopenia was evaluated in 79 patients in PD. For this, the authors used the bioelectrical bioimpedance method and manual pressure force to assess skeletal muscle mass and muscle strength was evaluated.
In addition, the physical performance of the patients was evaluated for 4 minutes with the walking speed test. It was seen that 11.5% of patients in PD had uremic sarcopenia. There was an association between the patients age, sex, physical activity level and the presence of diabetes mellitus39. In another study, with 434 patients in PD, the evaluation criterion used was the segmental appendicitis lean mass index (ALMI) by segmental bioimpedance. The authors showed by this method that the prevalence of uremic sarcopenia varied between 6.5 and 26.3%, with this prevalence different according to the ethnicity of the patients. Asian patients had a higher prevalence of uremic sarcopenia40. Another study showed the prevalence of uremic sarcopenia in 325 patients in PD. The methods used were the indices of lean mass and appendicular lean mass indices through dual‑energy x‑ray absorptiometry. In this study it was found that depending on the cut‑off criteria used, the prevalence of muscle loss was 2.2% – 31.3% for women and 25.1% – 75.6% for men41.
Due to these factors, nutritional follow‑up is crucial to the prevention of both PEW and obesity. Anthropometric measurements, biochemical tests, food consumption records and other tools utilized for nutritional assessment are essential to monitor the patient and determine its nutritional state in order to improve its quality of life9.
Few studies evaluated the nutritional state of patients undergoing PD in relation to body composition and there is no study that has investigated those patients food consumption10,11. Our hypothesis is that patients under PD have increase in body weight, augmented serum glucose, triglyceride and hemoglobin levels and inadequate food consumption, as a result of their clinical conditions. The aim of this study is to evaluate the nutritional state of patients with CKD receiving treatment with PD.
METHODS
This is a cross‑sectional study comprising patients undergoing automated peritoneal dialysis in the peritoneal dialysis unit of a public hospital treatment facility for patients with chronic kidney disease. The inclusion criteria were met by patients from both genders who were over 18 years of age and who had been undergoing PD for longer than 30 days. Exclusion criteria were the occurrence of infectious diseases, hepatopathies and cardiopathies, as these diseases might have an impact on the patients nutritional profile and thus become confounding factors for the results. Thirty of the 32 patients of the peritoneal dialysis unit of a treatment facility for patients with chronic kidney disease were selected, in accordance with the above‑mentioned inclusion and exclusion criteria.
All patients included in the study were on automated peritoneal dialysis. These patients performed the dialysis session every day for 8 hours at night. The dialysis solutions had a concentration of 1.5% to 4.5% glucose in each bag. Patients used 4 liters per day of dialysis solution for the dialysis procedure.
The research was approved by the Ethics Committee of the Juiz de Fora Federal University under n° 1.762.852.
The collection of data was undertaken by scheduling appointments for nutritional assessment and by means of patients records. The subjects signed informed consent forms.
All patients had medication routinely prescribed by the doctor in charge, e.g. antihypertensive and cholesterol‑lowering drugs, B vitamins, erythropoietin, vitamin D, folic acid and phosphorus.
The seven‑point subjective global assessment (SGA) was applied by means of the SGA validated by Fetter et al. (2014) that classified patients into three groups: patients being well‑nourished to being with mild malnutrition; patients with mild to moderate malnutrition; and patients with severe malnutrition12.
Body weight was assessed while patients were barefoot and wearing light clothes with a Welmy@ digital scale of maximum capacity of 200 kg, whilst patients height was measured by means of an Alturaexata@ stadiometer of 2.0‑meter maximum height. The body mass index (BMI) was calculated by the relation of the weight with the height squared and classified in accordance with the World Health Organization‑WHO (1998)13.
The anthropometric measurements used were arm circumference (AC), triceps skinfold thickness (TSF) and biceps skinfold thickness (BSF). AC was assessed with an inextensible measuring tape, while TSF and BSF were assessed by means of a Lange® skinfold caliper. Arm muscle circumference (AMC) and arm muscle area (AMA) were assessed by means of the following formulae, respectively: AMC (cm) = AC (cm) – [3.14 x TSF (mm)] (man) and AMA (cm²) = (AC (cm) – 3.14 x TSF (mm)/10)²/ 4 x 3.14 – 10 (men); AMA (cm²) = AC (cm) – 3.14 x TSF (mm)/10²/ 4 x 3.14 – 6.5 (women). They were then classified according to the nutritional state14.
Body composition was measured by two‑dimension tetrapolar bioelectrical impedance (BIA) with a Quantum II RJL Systems body composition analyzer when the patient was lying horizontally, had the abdomen empty of dialysis fluid and electrodes positioned in accordance to manufacturers instructions. There were no confounding factors for precise impedance measurement for any of the patients, and all of them followed the protocol for the realization of the TBI. The variables assessed by means of the TBI were percentage body hydration, cellular mass and phase angle15.
Dietary intake assessment was made by analyzing the 24‑hour dietary recall and food frequency questionnaire, which were applied by the previously trained research team.
Total calorie intake (kcal/kg/day), percentage carbohydrate, fats, daily intake of proteins (g/kg/day) and the ingestion of macronutrients, e.g. phosphorus, potassium and calcium, were assessed with recourse to the 24‑hour recall, in accordance with the recommendations by K/DOQI (2002) for patients that have CKD undergoing PD. Glucose absorbed from the dialysate was also regarded as dietary intake in the assessment of total calorie intake (dialysate calculated in kcal/kg/day) and percentage carbohydrate (1). Glucose estimates were calculated with the equation proposed by Grodstein et al. (1981)16, considering a glucose absorption rate between 30% and 50%17.
By means of the 24‑hour dietary recall, food intake was also classified in relation to its degree of processing18‑19.
Thus, consumables were classified into three groups: unprocessed or minimally processed food; processed food; ultra‑processed food.
Food intake‑related analyses were made by means of the DietWin® dietary analysis software.
The qualitative analysis of the patients dietary intake was made by means of data from the food frequency questionnaire, drawn up based on the questionnaire validated by Sichieri & Everhart (1998)20. Individual food intake frequencies were assigned the following labels: once a day; more than twice a day; 5 to 6 times a week; 2 to 4 times a week; once a week; once to thrice a week; rarely; never.
Patients records permitted the collection of data related to age, gender, education, dialysis type, start of treatment with automated peritoneal dialysis, underlying disease, percentage glucose concentration in the dialysate and amount of dialysis fluid infused measured in liters, besides the biochemical parameters.
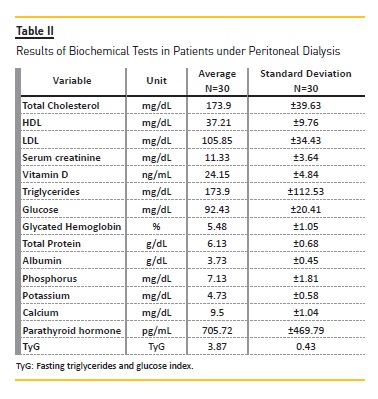
In order to analyze the biochemical tests, reference values for patients undergoing PD were used, i.e., parathyroid hormone (PTH) (<300 pg/mL); phosphorus (3 – 6 mg/dL); potassium (3.5 – 5.5 mEg/L); serum creatinine (<15 mg/dL); serum albumin (>3.8 g/dL); total cholesterol (150 – 180 mg/dL); LDL cholesterol (100 – 159 mg/dL); HDL cholesterol (>60 mg/dL); triglycerides (150 – 200 mg/dL); total protein (6.1 – 7.9 mg/dL); glycated hemoglobin (4.8 – 5.9%); glucose (<100 mg/dL); vitamin D [deficiency (<20 ng/ml) and insufficiency (< 30 ng/ml)]; ferritin (between 200 and 500 ng / ml); iron (50 a 150 mcg/100 mL); hemoglobin (11 – 13 g/dL) 1,42. Fasting triglycerides and glucose index (TyG) was calculated as the Ln[fasting triglycerides (mg/dL) × fasting glucose (mg/dL)]/221.
Statistical analyses were made by means of the SPSS 23.0 software. For the description of the variables utilized in this study, central tendency measures (average and median) and dispersion median (standard deviation and maximum and minimum values) were used for quantitative variables, whilst frequency and percentage were used for the qualitative values.
The test for normality was undergone by means of Shapiro and Wilks test in order to assess the distribution of such variables amongst the population. To assess the gaps between average values, Students T test was utilized for variables with symmetric distribution, whilst for those with asymmetric distribution the U‑Mann
Whitney test was used. Finally, the Pearson test was used for variables with normal distribution, and the Spearman test for those with non‑normal distribution. Significance level was fixed at lower than 5% (p < 0.05).
RESULTS
The sample was comprised mainly of females (76.7% of the total). Average age of the patients was 52.43±14.39 years, and the median of the dialysis treatment length was 31 (2 – 136) months. Schooling levels showed predominance of patients who had completed up to high school (47.8%), followed by those who finished college (8.7%) and, in a smaller proportion, illiterate patients (4.3%). In relation to the underlying diseases, regarded as main causes of CKD, the most prevalent were chronic glomerulonephritis (15.5%), allograft nephropathy (10.3%) and diabetic nephropathy (5.2%).
Table I shows SGA and anthropometric data. None of the subjects had severe malnutrition, whilst 43.3% were in a state of mild to moderate malnutrition and 56.7% at mild risk for malnutrition or well‑nourished.
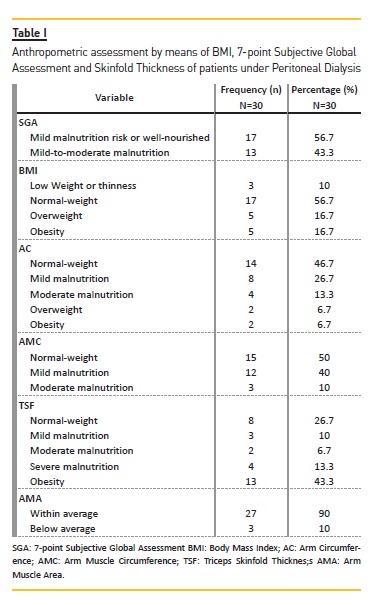
Analysis of BMI revealed an average of 24.64±4.84 kg/m², and 56.7% of the patients were classified as being well‑nourished, 16.7% as overweight, 16.7% as obese and 10% underweight or showing thinness. Subcutaneous fat persisted, as assessed by skinfold thickness and AC, as well as muscular mass, assessed by AMC and AMA.
The patients body water volume was assessed by the BIA. 53.3% of the patients were euvolemic and 23.3% hypovolemic, whilst 23.3% had hypervolemia.
There was a negative correlation between body water volume and AMC, i.e., the greater the blood volume in the body, the less the somatic muscular mass (r= 0.522, p<0.01).
The phase angle showed it was noticeable that the patients had good nutritional status (PA: Average 5.07±1.27º). The correlation between the patients age and the phase angle (r= – 0.505, p<0.01) was also negative, whilst in relation to serum albumin the correlation was negative (r= 0.366, p<0.05). Cellular mass was assessed as a sensitive indicator of lean tissue loss, with an average of 19.03±5.06 kg. Cellular mass was found to have a positive correlation with the AMC (r= 0.521, p<0.01) and the AMA (r=0.522, p<0.01).
Patients included in the present study had normal levels of ferritin and iron, with a mean of 276.6± 185.7 ng / ml and 60.5± 25.8 mcg / 100 mL, respectively. However, hemoglobin was below the reference values, with a mean of 10.2± 1.5 g / dL. Regarding vitamin D, it was observed that 16.7% of the patients presented vitamin D deficiency and 73.3% vitamin D insufficiency.
Table II shows the results of the biochemical tests.Patients had HDL cholesterol below the recommended serum levels. There were no changes in serum glucose and glycated hemoglobin concentrations. Serum albumin levels were below the ideal ones. Calcium and potassium were within the estimated reference values, whereas phosphorus levels were elevated. Patients had insufficient levels of serum vitamin D and high parathyroid hormone levels. According to the TyG index, the average is 3.87±0.43, and 76.7% of the subjects showed values below the75th percentile (TyG< 4.07), which did not indicate the occurrence of insulin resistance.
Analyzing the biochemical parameters in relation to the time of dialysis, it was observed that after 2 years of treatment there was a significant increase in relation to the serum calcium: in the first 2 years the mean was 9 ± 1.1 mg / Dl and after this period the mean was 9.8 ± 0.9 mg / dL (p‑value = 0.043). Despite this increase, calcium concentrations remained normal. In addition, after 5 years of treatment, a significant increase of serum glucose and glycated hemoglobin was observed, in which, in the first 5 years, the mean value was 87.9 ± 17.4 mg / dL and 5.3 ± 0.6% and after that period 108.3 ± 25.9 mg / dL and 6.3 ± 1.8%, respectively, with p‑value <0.05.
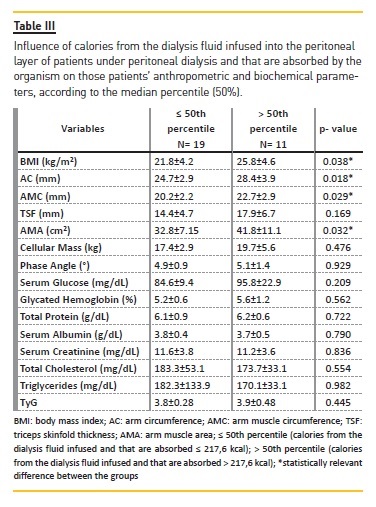
When the sample is divided into groups according to the absorption of calories from the dialysis fluid glucose, it is observable that patients who received more calories from the glucose infused during the PD process had higher anthropometric measurements than the group which received less glucose by infusion. In analyzing the connection between dialysis fluid glucose, anthropometric measurements and cellular mass, the correlations are positive between glucose and AMC (r=0.458, p<0.05); AMA (r=0.424, p<0.05); and cellular mass (r=0.471, p<0.01) (Table III).
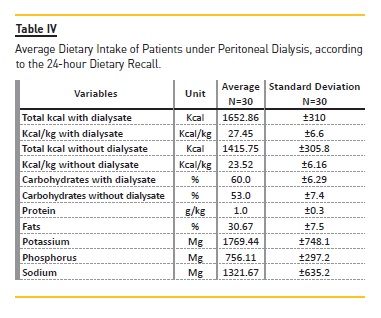
Patients food intake was also evaluated (Table IV).The presence of glucose from the dialysis fluid, partially absorbed by the organism, was a positive factor for the adequacy of calorie and carbohydrate intakes. The level of carbohydrates was adequate irrespectively of the occurrence of glucose from the dialysis fluid, whereas the inadequacy of protein consumption was noticeable, since the intake was below prescribed for high‑protein diets. Levels of body fat percentage, milligrams of phosphorus and sodium potassium were all in accordance with the recommended intake for patients undergoing PD.
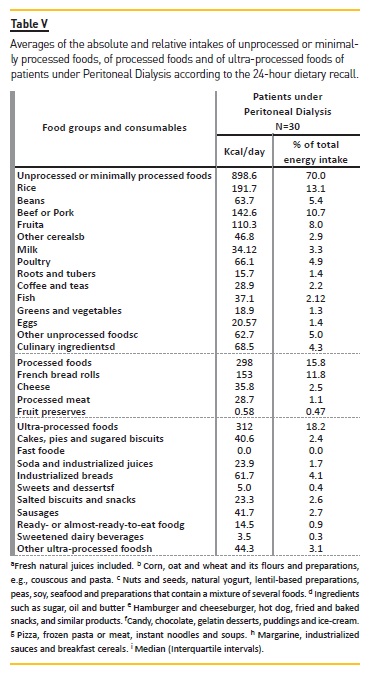
By assessing the intake of unprocessed or minimally processed; processed; or ultra‑processed food by patients under DP (Table V), it was found that 43% of them had taken at least one type of ultra‑processed food, and the average energy intake stemming from this category is 312 kcal (18.2% of the daily calorie intake). About 80% of them consumed processed foods, which corresponds to 298 kcal of the total daily energy intake (15.8%). All of the subjects consumed unprocessed or minimally processed food, which relates to 898.6 kcal of the total energy intake, or 70%.
By analyzing the consumption frequency of the main food groups, the ingestion of foods from the groups of milk and derivates; flesh and eggs; oils and fats; and cereals and legumes at least once a day was observable.
Among the foods in the dietetics group, only sweetener was consumed daily in small amounts. The consumption of greenery, vegetables and fruits was also daily, and foods from the tubers group was predominant among foods consumed once a week. Amongst this populations, the intake of snacks, canned goods and desserts was low, and occurred between once to thrice a month or rarely or never.
DISCUSSION
Most patients in the sample had satisfactory nutritional state, with maintenance of somatic muscle mass and subcutaneous fat, according to the anthropometric assessment and the SGA. Those results endorse those from another research conducted with patients under PD, that by means of SGA classified 56.66% of the patients as being in good nutritional state, having a TSF representative of a higher proportion of obesity, and the AC and AMC showed the predominance of a good nutritional state10.
By means of the BIA, good nutritional status related to the phase angle and cellular mass results were observable. The results are similar to those found in a cross‑sectional study realized with 28 patients under PD, with satisfactory nutritional status. Their average BMI was 26.7±5.4 kg/m², being indicative of overweight; phase angle was 5.1±1.2 degrees and cellular mass 5.1±1.2 kg11. In exposing relations between phase angle, patients age and serum albumin and between cellular mass, AMC and AMA, our results also endorse those found by another researcher22.
Most patients were euvolemic and had a statistically significant relationship with phase angle and cellular mass. A cross‑sectional study with 58 patients undergoing
PD did not find significant changes in patients body hydration, which was assessed by BIA, pointing to a good control over this parameter; 40% of patients were euvolemic23. Hypervolemia is an independent risk factor for cardiovascular diseases and death among patients under PD. Therefore, keeping the patients hydrated is crucial and their states should be monitored frequently23,24.
Biochemical tests showed that albumin was below the reference values, which may be due to the great loss for the dialysate. The same results were found in other studies performed with patients undergoing PD, in which the average values of albumin found were lower than the reference values 10‑25.
However, the total protein and the relationship between albumin and globulins are within the prescribed values, indicating good nutritional status of the patients. In the study of Mutsert et al. (2009) it was shown that albumin may not be a marker of risk of efficient mortality, since in addition to the loss of proteins for the dialysate, an inflammatory state could alter its concentration. In this study, it was shown that patients on dialysis can decrease up to 1 g / dL in serum albumin.
This was associated with an increase in 38% of PD patients. However, it is important to note that the risk of death was not associated with nutritional status variables, indicating that nutritional status cannot be measured by serum albumin in patients with PD43.
In analyzing cholesterol fractions it is observable that HDL‑cholesterol is below ideal, whilst LDL‑cholesterol is within the recommended band. Besides, serum cholesterol in patients with CKD might be a good marker for chronic low food intake or expose the use of lipid‑lowering treatments26. Another important point to be considered is that, like in the overall population, having low cholesterol is a good protecting factor for cardiovascular diseases, as long as it is not related to inflammation or PEW27. It is to be highlighted that low HDL‑cholesterol levels are common in CKD patients, but the mechanisms of this disorder in fat metabolism is yet to be completely explained28.
The current study did not find changes in the counting of triglycerides, serum glucose, glycated hemoglobin and TyG index, which is a sign of good control over those parameters, since this is a major concern of the healthcare team. Due to the absorption of glucose from the dialysis fluid, those patients might develop hyperglycemia, resistance to insulin and worsening in dyslipidemia, which are related to inflammatory processes and cardiovascular disorders6.
The TyG index has been recently regarded as a simple and inexpensive way to insulin resistance assessment, and its performance is as satisfactory as that of the homeostatic model assessment (HOMA)21. One of its advantages is being easily applicable in a clinic environment, since it is based upon routine laboratory tests, e.g. triglycerides and fasting glucose levels, and does not require the assessment of insulin levels29. There are no studies up to now that utilize the TyG index in patients under PD, but some have analyzed insulin resistance in general population by means of this methodology29,30.
Calcium, phosphorus and PTH levels were other assessed parameters. Serum calcium levels were normal, but phosphorus and PTH were elevated. According to literature, elevated phosphorus and PTH levels are associated with cardiovascular‑related mortality among subjects with CKD31,32. According to Melamed et al. (2006), in results found in a cross‑sectional study comprising 1007 subjects under both PD and HD, high phosphorus levels are related to mortality irrespectively of measures of inflammation, schooling, job, time interval considered and other confounding factors. By their turn, elevated calcium and PTH are associated with mortality respectively of renal replacement therapy duration. The data show that the patients follow‑up and control over those parameters is crucial for the patients survival31.
Besides, our study has found that patients undergoing PD have inadequate serum vitamin D levels, characterizing hypovitaminosis D, which is likely to be found in CKD patients, those under renal replacement therapy with PD included25. The deficiency of this vitamin is mostly due to the hyperphosphatemia, which is also shown in this research, and partially caused by the lack of 25‑hydroxyvitamin D‑1‑hydroxylase that occurs because of the renal insufficiency, which might lead to mineral and bone disorders such as secondary hyperparathyroidism, in addition to an increase in the cardiovascular death rate caused by the augmented risk of cardiovascular calcification33.
Thus, vitamin D supplementation in patients with CKD should be considered because of its effectiveness in reducing hypovitaminosis D‑related complications33.
Those measures were adopted by the patients care team in the current study. Yet, patients follow‑up must be evaluated in terms of medication adherence.
The influence of glucose from the dialysis fluid on the nutritional profile of patients under PD was also evaluated. According to the results presented, this ingestion of glucose is associated with the lean mass of the patients without the occurrence of adverse biochemical changes. The results are pursuant to those encountered in a cross‑sectional study with 136 patients under PD, in which no body fat increase nor fat‑free mass loss were observable amongst the subjects, thus leading to the conclusion that the glucose stemming from the dialysis fluid does not disrupt the body composition of patients under PD34.
In contrast, a study that followed 85 patients undergoing PD for one year showed that, after this period, 13% of the patients had dry weight loss, 36% kept stable, and 51% had weight increase. Besides, in relation to muscle mass, whilst 41% of patients had losses, 28% kept it stable and 31% showed an increase. In what concerns body mass, 21% of the patients had losses and 66% increases in this parameter, while 13% kept body mass stable. In this study, a significant difference between albumin, HDL‑cholesterol and triglycerides levels was noticeable after one year of treatment, with decrease in albumin and HDL levels and increase in triglycerides levels35.
In addition, the current study shows that dialysis fluid glucose is associated with total energy intake of patients, and its disregarding causes the patients intake to be labeled as hypocaloric, while their inclusion causes energy intake is normal. According to the nutritional recommendations for PD patients, it is essential that the nutritionist responsible take into account the glucose of the dialysis fluid and add it to the total energy consumption and the amount of carbohydrates in the diet calculations27.
With regard to food intake, patients under PD show satisfactory food consumption, as well as adequate intake of the macronutrients and micronutrients assessed in this study. Only protein intake was observed to be low amongst this population, albeit it is to be highlighted that only a very low protein intake, which did not occur in the current study, is relevant enough to affect the nutritional state36. In clinical practice, it is observable that protein ingestion by patients under PD is considerably lower than prescribed, which makes dietary counselling essential in order to prompt an increase in protein and energy intakes and thus avoid the undermining of patients nutritional profile36.
Concerning the qualitative assessment of food intake amongst this population, it is observable that they make use of an elevated amount of unprocessed or minimally processed food and the consumption of processed or ultra‑processed food is restricted. Other studies that assessed the intake of this kind of food found that an increase in ultra‑processed edibles consumption contributes to the rise in carbohydrates, added sugar and saturated fats in dietary intake, which turns into a risk factor for the development of non‑communicable diseases.
This suggests that an effective reduction in ultra‑processed foods consumption might improve subjects diet quality and thus their quality of life37.
As well as the general population, patients under PD should be instructed to keep their dietary habits healthy, abstaining from excessive consumption of ultra‑processed foods, since they contain high levels of refined sugar, saturated and trans fats, besides being phosphorus‑and potassium‑rich foods, which might lead to increased serum levels of those minerals caused by food intake38.
The methodology utilized in analyzing qualitative aspects of patients food intake represents one of the limitations of the current study, since only the 24‑hour dietary recall was used. In addition, there is no data available regarding the dietary appetite of patients in PD. Another inherent limitation is the cross‑sectional nature of the study, which does not allow for cause‑effect distinction and direct risk measures, once time‑related data are not available in this kind of investigation. Finally, there are no data regarding the peritoneal levels of Ca125, peritoneal transport type, Kt/v and ultrafiltration, which are considered another limitation of the study.
However, the fact that up to now few studies aiming at investigating nutritional state and dietary intake of patients undergoing PD have been conducted is to be emphasized, since it highlights the significance of the current study to the literature concerning the nutritional state of patients under PD.
CONCLUSION
In general, patients with PD had good nutritional status. However, these patients had some important metabolic alterations that require nutritional monitoring, such as hyperphosphatemia, secondary hyperparathyroidism, low levels of HDL‑cholesterol and inadequate protein intake. Finally, our results provide clinical evidence of the association between volume overload and PEW in PD patients.
References
1. K/DOQI. Clinical practice guidelines for chronic kidney disease: evaluation, classification and stratification. Am J Kidney Dis 32 (2002); pp. S1–S241. [ Links ]
2. National Institutes of Health. Kidney Disease Statistics for the United States 2001‑2013. [ Links ]
3. Pecoits‑Filho R. Tratamento substitutivo da função renal na doença renal crônica: uma atualização do Registro Latino‑Americano de Diálise e Transplante. J Bras Nefrol 37 (2015); pp. 9–13. [ Links ]
4. Sesso RC, Lopes AA, Thomé FS, Lugon JR, Martins CT. Inquérito Brasileiro de Diálise Crônica 2014. J Bras Nefrol 38 (2016); 54–61. [ Links ]
5. Ellam T, Wikie M. Peritoneal Dialysis. Medice 2011; 39: 434–437. [ Links ]
6. Zuo X, Ye X, Sun F, Qian K, Xiang S, Liang W, Xu G, Yao Y, Ying C. Glucose absorption in nephropathy patients receiving continuous ambulatory peritoneal dialysis. Asia Pac J Clin Nutr 24 (2015); pp. 394–402. [ Links ]
7. Malgorzewicz W. Nutritional predictors of mortality in prevalent peritoneal dialysis patients. ABP Biochimica Polomica 63 (2016); pp.111–115. [ Links ]
8. Lo, W K. Metabolic Syndrome and Obesity in Peritoneal Dialisys Korean. The Korean Society of Nephology. Kidney Res Clin Pract 35 (2016); pp.10–14. [ Links ]
9. Akbulut G, Sanlıer N, Inal S, Tek NA, Oneç K, Erten Y. Daily Dietary Energy and Macronutrient Intake and Anthropometric Measurements of the Peritoneal Dialysis Patients. Renal Failure 35 (2013); pp. 56–61. [ Links ]
10. Duarte EA, Silva GA, Dias RC, Carvalho CG. Nutricional Evaluantion of Peritoneal Dialysis Patients in Miner Institute of Nephrology of Belo Horizonte (MG). e‑Scientia 5 (2012); pp. 24–32. [ Links ]
11. Garcia‑Lopes MG, Agliussi RG, Avesani CM, Manfredi SR, Bazanelli AP, Kamimura MA, Draibe SA, Cuppari L. Nutritional status and body composition after 6 months of patients switching from continuous ambulatorial peritoneal dialysis to automated peritoneal dialysis. Braz J Med Biol Res 41 (2008); pp. 116–122. [ Links ]
12. Fetter RL, Bigogno FG, Oliveira FG, Avesani CM. Adaptação transcultural para o português de instrumentos de avaliação do estado nutricional de pacientes em diálise. J Bras Nefrol 36 (2014); pp. 176–185. [ Links ]
13. World Health Organization‑WHO. Obesity: preventing and managing the global epidemic. Report of a WHO consultation, Geneva, 3‑5 Jun 1997. Geneva: World Health Organization, 1998. [ Links ]
14. Frisancho A R. Anthropometric Standards for the Assessment of Growth and nutritional Status. University of Michigan Press, 1990. [ Links ]
15. Chow VC, Lee CW, Ho EH, Chan CK, Yong RM et al. Nutritional Assessment of Continuous Ambulatory Peritoneal Dialysis Patients by Bioelectrical Impedance. Perit Dial Int 23 (2003); pp. S55–S57. [ Links ]
16. Grodstein GP, Blumenkrantz MJ, Kopple JD, Moran JK, Coburn JW. Glucose absorption during continuous ambulatory peritoneal dialysis. Kidney International 19 (1981); pp.564–567. [ Links ]
17. Vychytil A, Horl WH. Nutritional and peritoneal dialysis. In: Mitch WE, Klahr S (eds.). Handbook of nutrition and the kidney. 4 ed. Filadelfia: Lippincott Williams & Wilkins, 2002. [ Links ]
18. MINISTÉRIO DA SAÚDE. Guia Alimentar para a População Brasileira. 2ª edição, Brasilia, DF, 2014 [ Links ]
19. FAO. 2015. Guidelines on the collection of information on food processing through food consumption surveys. FAO, Rome. [ Links ]
20. Schieri R, Everhart JE. Validity of a Brazilian food frequency questionnaire against dietary recalls and estimated energy intake. Nutrition 18 (1998); pp.1649–1659. [ Links ]
21. Simental‑Mendia L E, Rodriguez‑Moran M, Gerrero‑Romeo F. The product of fasting glucose and triglycerides as surrogate for identifying insulin resistance in apparently healthy subjects. Metab Syndr Relat Disord 6 (2008); pp. 299–304. [ Links ]
22. Rymarz A, Bartoszewicz Z, Szamotulska K, Niemczyk S. The Associations Between Body Cell Mass and Nutritional and Inflammatory Markers in Patients With Chronic Kidney Disease and in Subjects Without Kidney Disease Crossref. J Ren Nutr. 26 (2016); pp. 87‑92 [ Links ]
23. Aguiar PV, Santosa O, Teixeira L, Silva F, Azevedo P. Overhydration prevalence in peritoneal dialysis – A 2 year longitudinal analysis. Nefrologia 35 (2015); pp.189–196. [ Links ]
24. Woodrow G. Volume status in peritoneal dialysis. Peritonal Dialysis International. 31 (2011); pp. 77–82. [ Links ]
25. Cupisti A, DAlessandro C, Finato V, Del Corso C, Catania B, Caselli GM, Egidi MF. Assessment of physical activity, capacity and nutritional status in elderly peritoneal dialysis patients. BMC Nephrology 18 (2017); p. 180. [ Links ]
26. Liu Y, Coresh J, Eustace JA, Longenecker JC, Jaar B, Fink NE et al. Association between cholesterol level and mortality in dialysis patients: role on inflammation and malnutrition. JAMA 291 (2004); pp. 451–459. [ Links ]
27. Clinical practice guidelines for nutrition in chronic renal failure. K/DOQI, National Kidney Foundation. Am J Kidney Dis 35 (2000); pp. S1–S140. [ Links ]
28. Kujawa‑Szewieczek, Wiecek A, Piecha G. The lipid story in chronic kidney disease: a long story with a happy end? Inter Urol Nephrol 45 (2013); pp. 1273–1287.
29. Guerrero‑Romero F, Villalobos‑Molina R, Jimenez FR. et al. Fasting Triglycerides and Glucose Index as a Diagnostic Test for Insulin Resistance in Young Adults. Archives of Medical Research 47 (2016); pp. 382–387. [ Links ]
30. Vasques AC. TyG index performs better than HOMA in a Brazilian population: A hyperglycemic clamp validated study. Diab Res Clin Pract 93 (2011); pp. e98–e100. [ Links ]
31. Melamed ML, Eustace JA, Plantinga L, Jaar BG, Fink NE, Coresh J, Klag MJ, Powe NR. Changes in serum calcium, phosphate, and PTH and the risk of death in incident dialysis patients: A longitudinal study. Kidney International 70 (2006); pp. 351–537. [ Links ]
32. Wei‑Hao Wang, Li‑Wei Chen, Chin‑Chan Lee, Chiao‑Yin Sun. Association between Parathyroid Hormone, 25 (OH) Vitamin D, and Chronic Kidney Disease: A Population‑Based Study. Biomed Res Int 2017 doi: 10.1155/2017/7435657 [ Links ]
33. Lu RJ, Zhu SM, Tang FL, Zhu XS. Effects of vitamin D or its analogues on the mortality of patients with chronic kidney disease: an updated systematic review and meta‑analysis. Eur J Clin Nutr. 71 (2017); pp. 683–693. [ Links ]
34. Fan S, Davenport A. Does increased glucose exposure lead to increased body fat and reduced lean body mass in anuric peritoneal dialysis patients? Eur J Clin Nutr. 68 (2014); pp.1253–1254. [ Links ]
35. Caron‑Lienert RS, Poli‑de‑Figueiredo CE, Figueiredo AEPL, da Costa BEP, Crepaldi C, Pizzato AC, Ferrari F, Giuliani A, Ronco C.The Influence of Glucose Exposure Load and Peritoneal Membrane Transport on Body Composition and Nutritional Status Changes after 1 Year on Peritoneal Dialysis. Perit Dial Int. 37 (2017); pp. 458–463. [ Links ]
36. Kumano K, Kawaguhi Y. Multicenter cross‑sectional study for dialysisdose physicians subjective judgement in japonese peritoneal dialysis patients. Am J Kid Dis 35 (2000); pp. 515–525. [ Links ]
37. Steele, E M, Popkin B, Swinburn B, Monteiro C. The share of ultra‑processed [ Links ]
38. Galvao F., Rodrigues J. C. D., Britto F. S. B., Avesani, C.M.. Performance of subjective global assessment and malnutrition inflammation score for monitoring the nutritional status of older adults on hemodialysis. Clin. Nutr. 1 (2017); pp. 1–5. [ Links ]
39. Ashabi A., Najafi I., Tabibi H., Hedayati M. Prevalence of Sarcopenia and Dynapenia and Their Determinants in Iranian Peritoneal Dialysis Patients. Iranian Journal of Kidney Diseases. 12 (2018); pp. 53–60. [ Links ]
40. Yoowannakul S., Tangvoraphonkchai K., Davenport A. The prevalence of muscle wasting (sarcopenia) in peritoneal dialysis patients varies with ethnicity due to differences in muscle mass measured by bioimpedance. European Journal of Clinical Nutrition. 72 (2018); pp. 381–387. [ Links ]
41. Hung R., Wong B, Goldet G, Davenport A. Differences in Prevalence of Muscle Wasting in Patients Receiving Peritoneal Dialysis per Dual‑Energy X‑Ray Absorptiometry due to Variation in Guideline Definitions of Sarcopenia. Nutrition in Clinical Practice. 4 (2017) pp. 539–544. [ Links ]
42. Bouillon R. Comparative analysis of nutritional guidelines for vitamin D. Nature Reviews Endrocrinology. 13 (2017) pp. 466–479. [ Links ]
43. Mutsert R, Grootendorst D, Indemans F, Boeschoten E, Krediet R, Dekker F. Association between serum albumin and mortality in dialysis patients is partly explained by inflammation, and not by malnutrition. J Ren Nutr. 2 (2009); pp. 127–135. [ Links ]
Livia de Almeida Alvarenga
Rua Sophia Raphael Zacarias, 365, Parque Guarani. Juiz de Fora‑MG
CEP: 36P47‑280
E‑mail: liviaalvarenga92@gmail.com
Disclosure of potential conflicts of interest: The authors have no conflicts of interest to declare.
Received for publication: Feb 19, 2018
Accepted in revised form: Jun 8, 2018

