


Servicios Personalizados
Revista
Articulo
 Inglés (pdf)
 Articulo en XML
 Referencias del artículo
 Enviar articulo por email
Indicadores
-
 Citado por SciELO
 -
 Accesos
Links relacionados
-
 Similares en
SciELO
Similares en
SciELO
Compartir

 Permalink
Análise Psicológica
versión impresa ISSN 0870-8231versión On-line ISSN 1646-6020
Aná. Psicológica vol.38 no.2 Lisboa dic. 2020
https://doi.org/10.14417/ap.1674
Rushing to the end: Participants’ perceptions of demotivating aspects of online surveys
Pressa para acabar: Percepções de participantes dos aspectos desmotivadores em estudos online
João Martins1, Leonor Lavradio1
1ISPA – Instituto Universitário, Lisboa, Portugal
ABSTRACT
More and more social science studies are now acquiring data through the internet, reaching participants online. Some participants start out engaged and motivated to participate, but progressively slide into «rushing behaviors». We inquired experts in survey responding about when, in online studies, they would feel a desire for rushing (defined as speeding with no concerns about the quality of responses). This qualitative approach uncovered Repetition, Survey length and No interest in topic as the three main features that would motivate these participants to rush in surveys. Subsequent inquiry of the same participants indicated that repetition concerns the type of questions made (more than stimuli or task), the execution of the same task more than 5-6 times, or for more than 6 minutes. Survey length concerns a preference for shorter surveys, as well as the subjective experience in which length exceeds previously set expectations (i.e., longer than announced), contributing to rushing by effectively lowering the hourly pay rate as the survey increases in length. Interest in topic was reported to be consistently low, despite not being the main reason to quit the survey. However, a change in expected level of interest in the middle of the survey is reported as a factor that will promote rushing behaviors. We discuss these data as informative regarding how pre-tests of surveys can benefit from these participants’ expertise.
Key words: Online survey, Rushing, Data validity.
RESUMO
Cada vez mais, estudos na área das ciências sociais são dados adquiridos na internet, chegando a participantes online. Alguns participantes iniciam a sua participação de forma empenhada e motivada, mas desenvolvem, progressivamente, «comportamentos apressados». Inquirimos participantes experientes em participar em estudos online sobre as razões que os levariam a sentir motivação para apressar (definido como acelerar a participação sem preocupação pela sua qualidade). Esta abordagem revelou Repetição, Duração do estudo e Desinteresse no tópico como os três aspectos centrais que levariam os participantes a apressar estudos. Subsequentemente, os mesmos participantes indicaram que a repetição diz respeito ao tipo de questão (mais do que o tipo de estímulo ou tarefa), e à execução da mesma tarefa mais de 5-6 vezes, ou com uma duração superior a 6 minutos. A duração do estudo diz respeito à preferência por estudos mais curtos, bem como a experiência subjectiva da duração exceder expectativas prévias (i.e., duração superior à anunciada), levando a apressar, dada a redução do pagamento por hora à medida que o estudo vai aumentando em duração. Desinteresse no tópico foi reportado como sendo consistentemente elevado, embora não seja uma razção principal para abandonar o estudo – no entanto, havendo uma alteração no esperado nível de interesse a meio do estudo, foi reportado como um factor promotor de apressar a participação. Discutimos estes dados incidindo na sua relevância, e enquanto indicadores de como pré-testes com participantes peritos poderão beneficiar estudos online.
Palavras-chave: Estudos online, Apressar, Validade de dados.
Introduction
In this day and age, the internet has become ubiquitous both in our everyday life and in most forms of human activity. Research is no exception: studies in marketing or in a variety of social sciences now acquire data extensively, if not fully, through the internet, reaching participants on their computers or mobile devices, independently of their location (e.g., Evans & Mathur, 2005; Van Selm & Jankowski, 2006).
In this new paradigm, various platforms have positioned themselves between researchers and their participants – working as mediators, catalyzers, or a meeting point. These services aim to facilitate processes such as recruiting (e.g., Prolific, Amazon Mechanical Turk), or survey building (e.g., Qualtrics, Google Forms, SurveyMonkey).
Recruiting platforms are of particular interest, as one of their integral features is the possibility (or, in some cases, requirement) to pay participants for their time and availability, and the data they provide. This is an ethical and encouraged practice among researchers. It has, however, led to the existence of «professional respondents» (Hillygus, Jackson, & Young, 2014; Matthijsse, de Leeuw, & Hox, 2015), individuals for whom survey-taking has taken the shape of a job: rentability is a priority, and reward-per-minute takes precedence over paying attention to the survey and its requirements. Gadiraju, Kawase, Dietze and Demartini (2015, p. 1631) refer to some of these participants as «malicious workers», having «ulterior motives» and who «sabotage a task or try to quickly attain task completion for monetary gains», also identifying «fast deceivers», «who intend to bypass response validators in order to earn monetary rewards easily» (p. 1634).
But even the well-intended participants in online studies can lead to problematic data. They can start off with the intention to answer every question carefully and then, for a variety of reasons, change their behavior. Fast completion becomes their goal.
We suggest that inquiring of good (high approval rate) and experienced survey responders may offer relevant insight about a surveys’ problematic features. We address when these participants think that rushing may occur in their responses to a survey. Our aim is to understand what they perceive to be the survey features that contribute to a shift from a position of interest and motivation to be thorough and careful, to later see that motivation wane, and slide progressively into rushing behaviors. Although several studies already approach the factors that contribute to a fast completion of surveys, we believe that new insights may rise from asking experts about their own experiences. One advantage would be that the validation of this expertise can offer a pathway to quick pre-test our material before extending the survey to undesirable influences. In order to do this, we first review the literature about likely rushing factors and subsequently summarize results from a two-step inquiry of a sample of experts in survey responding.
Fast completion of surveys
Several factors may contribute to a fast completion of surveys. Each has been addressed with a specific term. «Speeding» (Zhang & Conrad, 2014) is the general term defining the act of very fast survey completion. Specifically, when the time taken to respond exceeds a threshold – the sum of the estimated time taken to read each word of the question. Data show that speedy respondents are likely to straight-line, that is, to give non-differentiated ratings for various different statements. Their reaction times have been found to be significantly related to quality of survey responses (Revilla & Ochoa, 2015). The term «satisficing» defines a response strategy where participants mobilize only the necessary cognitive effort to give a satisfactory response as opposed to an optimal one (Krosnick, 1991). These fast responses per se do not indicate low quality of data (for a review see Zhang & Conrad, 2014), since they can even be associated with lower error rates. In fact, response strategies based on satisficing may even benefit data quality as they reflect the multiple strategies we use as part of our normal cognitive functioning, revealing participants’ typical responses to deal with choice overload or decisions that are too effortful and taxing, opting instead for an alternative that meets a criterion of sufficiency (i.e., being good enough; Simon, 1972). Satisficers are thus responders that believe to have found a heuristic pathway to a valid and good response, in a highly efficient way: one that maximizes their gains.
Thus, satisfying encompasses a speeding attitude that is different from those «fast deceivers», who aim to reach the end of the survey solely to receive payment. But this attitude is different from that of participants that start motivated to think carefully about each response, and then simply start to «rush». Not because of a general attitude to speed, but as a reaction to the features of the survey, these participants see their motivation to respond thoroughly being redirected to reach the end of the survey as fast as possible. Speeding may therefore occur by different reasons: by a need to increase efficiency in responding (and so, satisficing, as a tradeoff between accuracy of response and effort expended in doing so); a proactive motivation to be fast and not care about the survey quality; or a reactive motivation (rushing), directed to finish the survey as fast as possible, sometimes at cost of quality (increasing random responses).
Rushers, contrary to fast deceivers, are not intent on cheating; that is, to intentionally attempt to circumvent rules in order to maximize profit or reward in a situation. Rushers, contrary to satisficers, know that they are not providing good responses. Rushers react to specific features of the survey, and aim solely to reach the end of the task faster by consequence of a motivational decrease and redirection (to survey completion). They are, in some way, sunk cost sensible, since they will not quit the survey after having already started it.
All these surveys respondents have a motivation to speed their responses. Findings from studies on online survey-taking point out that members of online panels, independently of their degree of motivation to have a positive contribution to the study, are all motivated to spend the least amount of time and energy possible (Sparrow, 2007). Online survey takers are impatient, fast readers (Manfreda, Batagelj, & Vehovar, 2002) who «just want to get started» and to quickly finish (Geisen & Bergstrom, 2017, p. 35). Participants aim to perform the survey with little to no effort at all – even when the differences lie in a minor motor action (e.g., a single extra mouse click, as demonstrated by Conrad, Couper, Tourangeau, & Peytchev, 2006). This is what may lead to the two different speeding strategies that characterize the experts in survey responding: satisficing (aiming to offer efficient responses) or simple rushing (find a way to finish independently of injuring the quality of the study).
The speeding strategy applied depends on the maintenance of the same level of motivation throughout the survey. Either a participant continues to aim for a satisfying strategy, or switches to rushing. And this is likely dependent on the design of the survey. Previous studies already suggest that the design of the survey be should such that the effort expended in completing it in good faith is equal or less than completing it randomly (Kittur, Chi, & Suh, 2008). Also, different features of a survey are known to impact the degree of motivation of respondents (see Dillman, 2011) and thus to impact the likelihood of activating a rushing strategy. Size of the survey is one of such features; response rates and participation are lower when tasks are more demanding (Kaye & Johnson, 1999), and the shorter the survey, the more likely participants will agree to do it (Quinn, 2002, cit. Nulty, 2008; Van Selm & Jankowski, 2006). Repetition is also another factor reported to affect data in undesireable ways. Research tells us it is advisable to avoid needless repetition of items, questions and instructions, or at least minimize the use of redundancies as they can result in decreased response rate (Asarch, Chiu, Kimball, & Dellavalle, 2009). Other studies approached the efficiency of grouping multiple items per page, in a gridlike matrix fashion, to avoid repetition of questions, instructions and rating scales (Roβmann, Gummer, & Silber, 2018; Van Selm & Jankowski, 2006).
Current study: Perceived rushing factors
Inquiring online survey expert respondents will allow us to understand if their perceptions regarding the possible sources of their demotivation to provide good responses to a survey match those identified in current literature. We address what they believe to be factors that would lead them to rushing. This will inform us as to whether individuals acknowledge previously identified influences, and employ their own experiences in providing us information regarding what they believe can lead to rush in surveys.
We followed a qualitative approach targeting the opinions of those who frequently respond to surveys and have a high level of approved submissions on Prolific. We inquired them in two different phases: a first phase where, in an open questionnaire, we ask which aspects of the survey individuals believe to be the cause of a loss of motivation to respond, and a consequent rush to the survey’s end; and a second phase, in which a closed-format questionnaire follows-up on the specificity of those aspects.
Method
Participants
Forty-two participants (59.09% male, mean age of 32) who had already participated in 20 or more online studies were recruited through the Prolific platform (11.23% had participated in 20-30 studies; 24.53% in 30-40, 11.32% in 40-50, and a majority of 52.83% in more than 50 studies), with an average approval rate of 98.7%. In the first phase participants were paid 0.3 GBP for an average time of 3 minutes of participation. In the second phase participants were paid 0.4 GBP for an average time of 4 minutes of participation. Payment was always above Prolific’s reward recommendation of 5 GBP/h.
The survey was made available on desktop and also optimized for mobile devices.
Phase 1
Individuals were invited to participate in a study about their own participation in online studies. Instructions referred that their engagement in online surveys may differ since they may be either very motivated to read everything, thinking and answering very carefully, or just want to reach the end of the survey, answering fast and giving questions little thought. Participants were subsequently informed that our interest was in the occurrence of one specific type of engagement: when they start out motivated but lose that motivation during the survey and rush to the end, and that our aim was to try to understand why this transition happens.
We then asked participants to respond to the following question: «What aspects of a survey would cause you to lose motivation and rush to the end?» Eight text fields were shown, in which participants could provide their answers.
Participants were then asked to estimate how many surveys they had previously participated in and were thanked for their participation.
Results
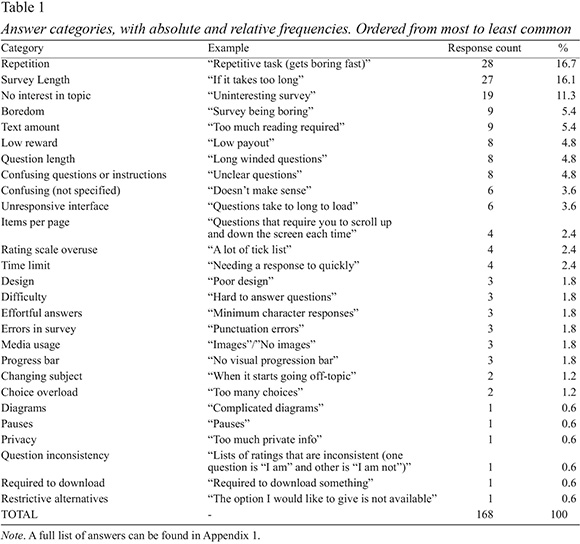
Respondents offered 202 text entries, of which 24 were either completely unrelated and seemingly random, too vague, or unequivocal cheating (e.g., «owning property», «language», or «reason»), and 10 for referring aspects external to the survey. Content analysis (remaining 168 answers were categorized by one of the researchers and three independent raters expressed their agreement or disagreement about which category the responses should belong to) highlighted three factors referred to as the major sources of demotivation; Repetition, Survey length and No interest in topic, which were the focus of our subsequent analysis (Table 1 – A full list can be found in Appendix 1).
Phase 2
We aimed to better understand participants’ responses from the first phase. We targeted how they would operationalize repetition and survey length, and how they incorporate the interest in survey topic as a factor for rushing. In addition, we explored fairness of payment as a relevant factor for rushing, since it can be a source of motivation for finishing the survey, as opposed to quitting it, when participants become demotivated, providing an ideal reason for rushing.
Participants were reminded of the subject matter of the Phase I study and it was expressed that they should respond keeping in mind that the aim of the study was to learn more about aspects that make people lose motivation and rush to the end of surveys.
We addressed operationalization of repetition in two ways. First, by asking participants to report how much repetition of a stimulus, question, or task (a combination of the two) would lead them to feel that a survey was repetitive (1=Not at all; 7=Completely). Secondly, they were asked to define the number of times the same task is required to be completed, and the number of minutes the same task lasts, in order to feel repetitive.
Operationalization of Survey length was explored by asking participants to define, in minutes, how long a short, medium, and long survey should be.
As to the factor of interest in survey topic, we surveyed participants regarding their participation in studies with topics they considered «NOT interesting», and asked how frequently that awareness occurred only halfway through their participation. Participants were asked to estimate how often they found those topics uninteresting at the beginning of the survey (deciding to do it anyway), and in the course of responding (where rushing could be identified). A second question asked how often they quit the study, and how often they engage in random responding. In both cases, estimates were provided in percentages of times they manifested such behaviors in studies they considered to involve non-interesting topics.
Finally, we approached payment (rewards), and the violation of expectations attached to them, assuming as likely that these contribute to participants not abandoning the studies but instead engage in rushing behaviors. We explored the impact of participants’ reward expectations by asking them how often they quit or respond randomly (rush) in two types of situations: when they «expect an inadequate reward from the start of the survey», and when they «find out in the course of responding that the reward will be inadequate». Responses were provided on a seven-point scale (1=Never to 7=Always). Finally, we asked participants to estimate the percentage of times they had participated in studies that had paid fairly. As a control question, we asked what they consider to be a «fair payment».
After offering information concerning age and gender, participants were thanked for their participation, and subsequently rewarded.
Results
Our first analysis addresses what participants mean when identifying repetition and length, as factors that promote rushing.
Repetition. Participants’ responses show that, in their experience, the repetition of the question (M=5.50, SD=1.16; Mode=6) promotes a higher feeling of repetition than the repetition of a stimuli (M=4.90, SD=1.17; Mode=5). This suggests that they perceive more repetition when a question or a rating scale remains on screen, while changing the target stimuli, than when an image remains and the question changes. Participants identify that this occurs when a task is done more than a mean of 5.3 times (SD=3.18; Mode=3) or when it takes longer than approximately 6 minutes (M=6.17; SD=4.30, Mode=5).
Survey length. With length being identified as a relevant factor for rushing, participants clarified that, subjectively, a short survey is one that takes approximately 5 minutes (SM=5.07; SD=2.12); a medium survey would last approximately 12 minutes (M=12.48; SD=5.04); and a long survey as taking around 23 minutes (M=23.14; SD=10.12).
We further explore how participants perceive the impact of the lack of the interest in the topic of a survey, as well as fairness of payment for their participation, in how they comply with the request. Participants report that this is not a relevant factor for them to decide to participate in the study, as even when a survey topic is found to be uninteresting before starting, they decide to do it anyway approximately in 42% of the times. More relevant for understanding rushing behavior, they report that in around 52.26% of their participations they become aware of their lack of interest only «in the course of the responding». In these conditions (where rushing can occur) participants report to react by quitting the study 13.38% of the times. Conversely, in 17.79% of the cases, the reaction is to respond more or less randomly to the posed questions.
Reward as a motivation factor. One motivation that participants report to have for finishing a participation in a survey is the expectation of a reward. Although this factor was not directly reported in phase 1, it is likely contributing to the rushing behavior. Figure 1 shows the payment participants consider adequate when invited to participate in studies with different lengths.
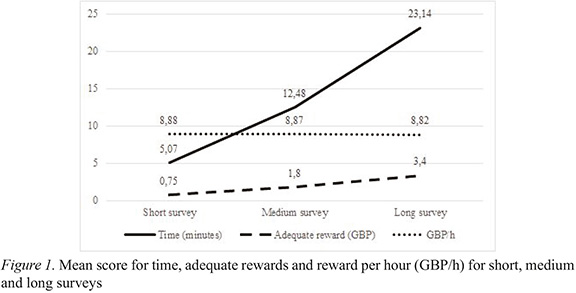
From the indicated length and adequate reward, we calculated the expected hourly pay for short, medium, and long surveys. Hourly pay was consistent across the three lengths, suggesting that on average participants consider 8.86 GBP per hour an adequate reward. However, when asked directly to indicate what would be a «fair hourly payment», the mean response was 7.75 GBP (SD=10.18), which is higher than the 5 GBP/h Prolific’s minimum payment policy or the most frequent payment of 6 GBP/h. Nevertheless, they report that, on average, 70.07% (SD=18.18) of the studies in which they participated were fairly paid.
Attesting to the relevance of this factor to motivate participation, when a low reward is expected beforehand participants report more frequently to «Not to start it» (M=4.21, SD=2.10) than to «explore it, and then quit» (M=3.38; SD=1.96), or to «Respond, more or less randomly» (M=2.81, SD=1.94; all three options were rated between 1=Never to 7=Always).
Thus, when participants notice the inadequacy of the reward in the course of responding, this becomes the relevant factor for either quitting or alternatively rushing. In this scenario, participants report to be as likely to «Quit immediately» (M=3.52, SD=.05), «Respond, ignoring how much it pays» (M=3.69, SD=1.91), or «Respond more or less randomly» (M=3.21, SD=1.86). A total of 30.95% of participants reported a likelihood of responding randomly (above 4 in the scale) if they found out, halfway through a survey, that they would not receive an adequate payment.
Discussion
The respondents in this study are experts in responding to surveys, who are not likely to be «malicious workers» or «fast deceivers», who sabotage the task at hand. They show, however, awareness of the possibility of moving from a position of motivation and careful responding, to one we describe as rushing, and that this can occur due to specific features of the survey design as well as the fairness of payment, given such design. Our qualitative approach allows us to state that these participants identify Repetition, Survey length and No interest in topic as factors that push them to rush to the end of a survey.
These factors match results of previous investigations, which show that repetition of items, questions and instructions, decreased individuals’ response rates (Asarch et al., 2009). What is perceived as «repetition» was further clarified by our participants in phase 2: it is clear that respondents feel that a survey is repetitive especially when the same questions are repeated, more than when there is repetition of stimuli or the entire task. However, the simple repetition of stimuli or of a task is also likely to lead to participants to feel repetition. These data are consistent with studies that show that grouping of multiple items per page reduce decreases in response rate, possibly by avoiding the feeling of repetition of questions, instructions and rating scales (Roβmann et al., 2018; Van Selm & Jankowski, 2006). Moreover, our data clarifies that respondents feel repetition when they find themselves doing the same task 5-6 times, or performing it for more than 6 minutes.
«Long survey», and other similar phrasings, took the place of second most frequently mentioned reason as to why our participants decide to rush to the end of surveys, in detriment of a thoughtful and motivated participation. Survey length has indeed been previously shown to have an important role in survey participation; the shorter surveys being more likely to have participants agreeing to do it (Quinn, 2002, cit. Nulty, 2008; Van Selm & Jankowski, 2006). This match between what was shown to impact individuals’ behaviors and the naïve believes of participants (at least as expert participants) has a highly relevant technical consequence: pre-tests of surveys can ask participants for their subjective experience with the survey with regard those factors, as a way of preventing rushing in further deployments.
But our results further underline the impact of survey length by showing that it is not only the length that counts, but also how it related to payment. Length is perceived as problematic when participants feel that the reward for completing it is inadequate. And the consequences of this are somewhat detrimental, since even these «good participants» report a likelihood to respond randomly to the survey when they find out the reward is inadequate in the course of completing it. Thus, rushing is more likely when rewards do not match the length of the study, than when they do. Nevertheless, the majority of our participants seem to be somewhat resistant to totally disregarding the accuracy of their responses even when they feel to be badly paid. This is evidenced by the fact that «responding, ignoring how much it pays» is reported as the most common behavior to be had when participants find out the pay is inadequate in the course of responding.
Our data may help researchers to carefully consider the relationship between length and payment of their surveys. From our data we learn about participants’ expectations regarding the adequate length of a study presented as a short study (<5 minutes), medium study (around 12 minutes) and long study (around 23 minutes). These estimations are consistent with what is stated by Revilla (2017), that «the median for the ideal length is 10 minutes and for the maximum length is 20 minutes» (p. 563), and from our data we learn the expected payments for each of these survey lengths. According to our sample, the correct amount would be a constant 8.86 GBP per hour (averaged). However, when asked about a «fair hourly pay», participants lower the amount to an average of 7.75 GBP/h.
A final conclusion supported by our study is that participants report that in approximately half of the surveys they participate in (52.26%) they do not find the topic interesting; in approximately 40% of the times, awareness that the topic is not as interesting as previously thought occurs in the course of responding. Despite a lack of interest, participants report that in 13.38% of the times they are likely to continue their attentive participation, not quitting the survey. A bit more worrying is the fact that a larger percentage of the times (17.79%) they admit to responding randomly.
Dealing with rushing
We find a good match between the results of our subjective descriptive study and the conclusions drawn from more objective data. This suggests those with a long experience in survey responding can provide us with relevant feedback about the consequences of a specific survey design. We may gain from relying on participants’ reports of their experiences of repetition, and length estimations in a pre-test of our surveys. These pre-tests will be beneficial if ran by these experts. We can ask them about how much they experienced a sense of repetition of questions, a sense of repetition of stimuli after completing the survey. We can ask them if the survey felt long or short, and if the payment was fair. We can inquire them about the occurrence of rushing behavior at specific moments of the survey.
Platforms such as Qualtrics («Expert Review») and SurveyMonkey («Genius») already offer us some clues about these features, providing feedback about the performance and overall quality of the survey. This feedback is based on known concepts from academic literature such as satisficing, acquiescence response bias, straightlining (Herzog & Bachman, 1981; Krosnick, 1991), and includes recommendations on aspects such as survey length, question format and wording, among others (for an example, see Vannette, n/d). However, as a more specific strategy of validation, we can also rely on the information provided by these experts – both on the information summarized in these inquiries regarding factors to attend to in order to reduce the likelihood of speeding leading to random responding, and on specific inquiries about our own surveys. From a proper pre-test of our surveys, we can target survey features that alter the behavior of respondents; specifically, specific demotivating features lead them to rush.
Nevertheless, it will not always be possible to comply with the pre-test results. It may not be possible to make surveys shorter, or to avoid some level of repetition in questions; nor is there much hope that we can, or want, to promote high levels of interest in the survey’s topic. How then to deal with the likelihood of rushing? A way around this could be to insert additional features in the survey that may capture rushers and aid to filter the «bad data» from the «good» one, such as using «manipulation checks» (trap questions) (e.g., Gummer, Roβmann, & Silber, 2018; Hauser & Schwarz, 2015), or diminishing this behavior, by including messages as a result of responding too fast (e.g., Conrad, Tourangeau, Couper, & Zhang, 2017). Although this prolongs the survey (and long surveys seem to be one factor that leads to rushing), the tradeoff between having a shorter survey (which may have other problematic features that demotivate participants) and controlling for rushers must be weighted. Additionally, some web survey design recommendations are also thoroughly discussed in the literature, and mention the use of certain features which could aid with the demotivating factors we discuss here (e.g., Couper, 2000; Dillman, 2011; Tourangeau, Conrad, & Couper, 2013). An often cited example is the use of a visual progress bar – a graphic or symbol that «convey[s] a sense of where the respondent is in the completion progress» (Dillman, Tortora, & Bowker, 1998, p. 12), increasing respondent motivation in long survey completion (Couper, Traugott, & Lamias, 2001).
As a final proposal, we can consider asking participants regarding when in the survey they started to feel a need to rush, making it clear that their response has no weight on their reward. Because rushing is perceived to be promoted, or caused, by the experimenter, and not derived from a bad attitude on the side of the responders, it is likely that we can obtain highly informative responses. Of course, this is still a question that should be empirically tested in the future.
Limitations and future directions
Our qualitative subjective approach is clear in informing regarding how experts in survey collaboration experience their participation in a study. The subjective results match objective data collected in previous studies. However, one type of data should not be confounded with the other, and a match is not a necessary occurrence in the future with regard to other dimensions. Although we work with a qualitative approach, focusing on an expert sample and aiming for descriptive data, it may be argued that a broader and more representative sample should be used in future studies, in order to consolidate the generality of our conclusions.
The fact that we select an expert sample of participants, as well as the nature of the questions, may lead to some level of social desirability. Because of that, some of our results should be considered optimistic, such as participants demonstrating a certain resistance to avoid participation and to totally disregard the accuracy of their responses. But if all these results seem more positive than they really are, the contrary may be said for rushing behaviors: they might be worse than what our participants report here. Nevertheless, the bias introduced by social desirability in individual responses did not injure their informative value, and allow us to detect relevant factors for rushing and a methodology for future use in pre-testing of surveys.
Future studies may find it relevant to approach satisfying and rushing as two distinctive speeding strategies. In the first, participants are expected to understand speeding as associated with being efficient in their responding, whereas for the second they are aware that quality is at risk.
Repetition, survey length and interest in the topic are features that our expert participants name as having an impact in their own behaviors. These converge with previous empirical research that manipulates such survey aspects and finds consequences in their results. We believe that this convergence of the two methodologies used (a more objective and a subjective one) is relevant to the proposal that we can rely on these expert opinions to offer important feedback about the characteristics of our surveys that need to be revised in order to reduce the likelihood of rushing.
References
Asarch, A., Chiu, A., Kimball, A. B., & Dellavalle, R. P. (2009). Survey research in dermatology: Guidelines for success. Dermatologic Clinics, 27, 121-131. Retrieved from https://doi.org/10.1016/j.det.2008.11.001 [ Links ]
Conrad, F. G., Couper, M. P., Tourangeau, R., & Peytchev, A. (2006). Use and non-use of clarification features in web surveys. Journal of Official Statistics, 22, 245-269. [ Links ]
Conrad, F. G., Tourangeau, R., Couper, M. P., & Zhang, C. (2017). Reducing speeding in web surveys by providing immediate feedback. Survey Research Methods, 11, 45-61. Retrieved from https://doi.org/10.18148/srm/2017.v11i1.6304 [ Links ]
Couper, M. P. (2000). Web surveys: A review of issues and approaches. The Public Opinion Quarterly, 64, 464-494. Retrieved from https://doi.org/10.1086/318641 [ Links ]
Couper, M. P., Traugott, M. W., & Lamias, M. J. (2001). Web survey design and administration. Public Opinion Quarterly, 65, 230-253. Retrieved from https://doi.org/10.1086/322199 [ Links ]
Dillman, D. A. (2011). Mail and internet surveys: The tailored design method (2nd ed.). Hoboken, NJ: John Wiley & Sons. [ Links ]
Dillman, D. A., Tortora, R. D., & Bowker, D. (1998). Principles for Constructing Web Surveys. Joint Meetings of the American Statistical Association, 64, 1-16. [ Links ]
Evans, J. R., & Mathur, A. (2005). The value of online surveys. Internet Research, 15, 195-219. Retrieved from https://doi.org/10.1108/10662240510590360 [ Links ]
Gadiraju, U., Kawase, R., Dietze, S., & Demartini, G. (2015). Understanding malicious behavior in crowdsourcing platforms: The case of online surveys. In B. Begole, J. Kim, K. Inkpen, & W. Woo (Eds.), 33rd Annual ACM Conference on Human Factors in Computing Systems (pp. 1631-1640). Seoul: ACM. [ Links ]
Geisen, E., & Bergstrom, J. R. (2017). Usability testing for survey research. Cambridge: Morgan Kaufmann. [ Links ]
Gummer, T., Roβmann, J., & Silber, H. (2018). Using instructed response items as attention checks in web surveys: Properties and implementation. Sociological Methods and Research. 1-27. Retrieved from https://doi.org/10.1177/0049124118769083
Hauser, D. J., & Schwarz, N. (2015). It’s a trap! Instructional manipulation checks prompt systematic thinking on «tricky» tasks. SAGE Open, 5, 1-5. Retrieved from https://doi.org/10.1177/2158244015584617
Herzog, A. R., & Bachman, J. G. (1981). Effects of questionnaire length on response quality. Public Opinion Quarterly, 73, 349-360. Retrieved from https://doi.org/10.1093/poq/nfp031 [ Links ]
Hillygus, D. S., Jackson, N., & Young, M. (2014). Professional respondents in nonprobability online panels. In M. Callegaro et al. (Eds.), Online panel research: A data quality perspective (1st ed., pp. 219-237). John Wiley & Sons. Retrieved from https://doi.org/10.1002/9781118763520.ch10 [ Links ]
Kaye, B. K., & Johnson, T. J. (1999). Research methodology: Taming the cyber frontier techniques for improving online surveys. Social Science Computer Review, 17, 323-337. Retrieved from https://doi.org/10.1177/089443939901700307 [ Links ]
Kittur, A., Chi, E. H., & Suh, B. (2008). Crowdsourcing user studies with Mechanical Turk. In M. Czerwinski (Ed.), Twenty-sixth annual SIGCHI conference on Human factors in computing systems [April 5-10, 2008, Florence, Italy] (pp. 453-456). New York: ACM Press. Retrieved from https://doi.org/10.1145/1357054.1357127
Krosnick, J. (1991). Response strategies for coping with the cognitive demands of attitude measures in survey. Applied Cognitive Psychology, 5, 213-236. Retrieved from https://doi.org/10.1002/acp.2350050305 [ Links ]
Manfreda, K. L. M., Batagelj, Z., & Vehovar, V. (2002). Design of websurvey questionnaires: Three basic experiments. Jounal of Computer-Mediated Communication, 7. Retrieved from https://doi.org/10.1111/j.1083-6101.2002.tb00149.x [ Links ]
Matthijsse, S. M., de Leeuw, E. D., & Hox, J. J. (2015). Internet panels, professional respondents, and data quality. Methodology, 11, 81-88. Retrieved from https://doi.org/10.1027/1614-2241/a000094 [ Links ]
Nulty, D. D. (2008). The adequacy of response rates to online and paper surveys: What can be done? Assessment and Evaluation in Higher Education, 33, 301-314. Retrieved from https://doi.org/10.1080/02602930701293231 [ Links ]
Revilla, M. (2017). Ideal and maximum length for a web survey. International Journal of Market Research, 59, 557-565. Retrieved from https://doi.org/10.2501/IJMR-2017-039 [ Links ]
Revilla, M., & Ochoa, C. (2015). What are the links in a web survey among response time, quality, and auto-evaluation of the efforts done?. Social Science Computer Review, 33, 97-114. Retrieved from https://doi.org/10.1177/0894439314531214 [ Links ]
Roβmann, J., Gummer, T., & Silber, H. (2018). Mitigating satisficing in cognitively demanding grid questions: Evidence from two web-based experiments. Journal of Survey Statistics and Methodology, 6, 376-400. Retrieved from https://doi.org/10.1093/jssam/smx020
Simon, H. A. (1972). Theories of bounded rationality. Decision and Organization, 1, 161-176. [ Links ]
Sparrow, N. (2007). Quality issues in online research. Journal of Advertising Research, 47, 179-182. Retrieved from https://doi.org/10.2501/S0021849907070201 [ Links ]
Tourangeau, R., Conrad, F. G., & Couper, M. P. (2013). The science of web surveys. New York: Oxford University Press. [ Links ]
Vannette, D. L. (n/d). The qualtrics handbook of question design. Provo, UT: Qualtrics Survey Software. Retrieved from https://www.qualtrics.com/ebooks-guides/qualtrics-handbook-of-question-design [ Links ]
Van Selm, M., & Jankowski, N. W. (2006). Conducting online surveys. Quality and Quantity, 40, 435-456. Retrieved from https://doi.org/10.1007/s11135-005-8081-8 [ Links ]
Zhang, C., & Conrad, F. (2014). Speeding in Web Surveys: The tendency to answer very fast and its association with straightlining. Survey Research Methods, 8, 127-135. Retrieved from https://doi.org/10.18148/srm/2014.v8i2.5453 [ Links ]
Correspondence concerning this article should be addressed to: João Martins, ISPA – Instituto Universitário, Rua Jardim do Tabaco, 34, 1149-041 Lisboa, Portugal. E-mail: joaodavidmartins@gmail.com
Submitted: 27/12/2018 Accepted: 19/07/2019

