Serviços Personalizados
Journal
Artigo
Indicadores
-
 Citado por SciELO
 -
 Acessos
Links relacionados
-
 Similares em
SciELO
Compartilhar
Silva Lusitana
versão impressa ISSN 0870-6352
Silva Lus. vol.20 no.1-2 Lisboa dez. 2012
The Global Yield, and Allometry of Self-Thinned Mixed Forests. A Theoretical and Simulative Inquiry
Produção Total e Alometria de Povoamentos Mistos Auto-Desbastados. Uma Inquirição Teórica e Simulada
Production et Allométrie Globales des Peuplements Mixtes Auto Éclaircis. Une Enquête Théorique et Simulatrice
Luís Soares Barreto
Jubilee Professor of Forestry
Av. do M.F.A., 41-3D, 2825-372 COSTA DA CAPARICA
Abstract
The author uses his theory for mixed stands, and his model BACO2 for tree competition to clarify the global yield, and allometry of self-thinned even-aged mixed stands with two species. He analyses the effects of the competitive hierarchy, initial proportions of the species, and the relative size of the trees of the two competitors. He extends the results to self-thinned uneven-aged mixed stands.
Key words: Allometry; competitive hierarchy; global stand biomass; self-thinned mixed stands
Sumário
O autor recorre à sua teoria para os povoamentos mistos e ao seu modelo BACO2 para clarificar a produção e alometria globais de povoamentos auto-desbastados mistos regulares com duas espécies. Analisa o efeito da hierarquia competitiva, proporções iniciais das duas populações e do tamanho relativo das suas árvores. Estende os resultados obtidos aos povoamentos auto-desbastados mistos irregulares.
Palavras-chave: Alometria; biomassa global; hierarquia competitiva; povoamentos auto-desbastados mistos
Résumé
L'auteur utilise sa théorie pour les peuplements mixtes et son modèle BACO2 pour clarifier la production et la allométrie globales des peuplements mixtes auto éclaircis avec deux espèces. Il analyse les effets de la hiérarchie compétitive, les proportions initiales des populations, et les dimensions relatives des arbres de chaque espèce.
Mots clés: Allométrie; biomasse totale; hiérarchie compétitive; peuplements auto éclaircis mixtes et réguliers
Introduction
This paper continues my previous theoretical and simulative quest on interspecific tree competition, the structure, and dynamics of mixed stands (BARRETO, 1997, 1999, 2001, 2003a,b 2004a,b, 2007, 2010). I already accomplished the following:
• I showed that the total biomass of self-thinned even-aged mixed stands is simultaneously deter-mined by: a) the competitive hierarchy associated to the species present; b) the initial proportions of the species; c) the relative sizes of the trees of the competitors (BARRETO, 2004b, 2010).
• There is empirical evidence that supports my simulations with model BACO2 with trees (BARRETO, 2010), and with flagellates (BARRETO, 2005a).
• The simulations with this model abide the accepted ecological tenets about the life-history strategies of the competitors (BARRETO, 1999, 2010).
• The allometry of each population in mixed stands changes with age, and mirror the existent competitive hierarchy (BARRETO, 2004b, 2007).
• The variability of the coefficients of competition (BARRETO, 1999).
• Self-thinned uneven-aged mixed stands has a blended geometry (BARRETO, 2003a).
Until now, I had been mainly concentrated in the populations of the mixed stands considered each one per se. Now, my purpose is to clarify the global allometry, and yield of self-thinned even-aged mixed stands (sems).
From here on, I consider sems with 2 species, and the initial proportions of the species are defined at age 10, and are relative to the number of trees of each species, unless a change is stated.
A description of my theory for tree competition and model BACO2 can be found, for instance, in BARRETO (1997, 2004a, 2010).
The best way to achieve my purpose is to consider the following allometric equation:
![]() (1)
(1)
where: yT0.6666=total biomass of SEMS per area unit; c= constant; yT-0.2= total density of the SEMS; a=allometric power
In pure stands, this power is equal to -0.33333 (a=0.66666/-2; BARRETO, 2003c).
For the elaboration of this paper, I used Scilab 5.2.2 (CONSORTIUM SCILAB, 2009) as a simulation platform. All graphics are pasted from Scilab.
The Characterization of the Species
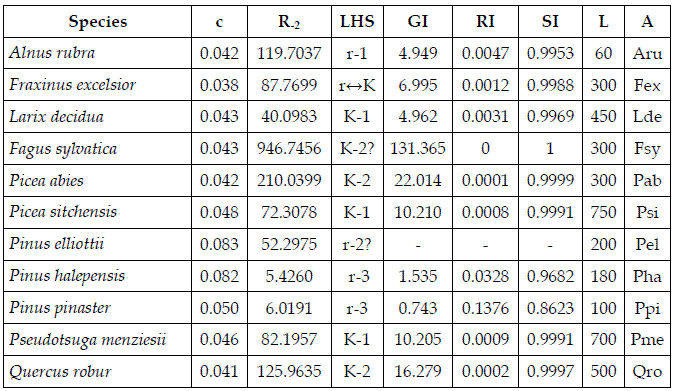
Given the unified structure of my theory for pure, and mixed stands, and its agreement with the main concepts of ecology, for a better understanding of the elaborations here presented, I characterize the species used, in Table 1. I had already established the growth patterns of all species here simulated, but Pinus elliottii. To complement the displayed information see BARRETO (2008, 2009).
Table 1 - Characterization of the species here considered. LHS=life-history strategy; GI= growth index; RI=regeneration index; SI=survival index; L=longevity, years; A=acronym; R-2=density at age 10/final or asymptotic density
A Procedure of Analysis
My aim is to clarify the effects of the competitive hierarchy, the relative size of the final biomass of the average trees of the competitors, and of the proportion of the species at initial age 10, upon the power of eq. (1), and the global yield of the stand, comparing the sum of the yields of both species, in pure stands, in the same site. I will use a simulative approach, with model BACO2.
To characterize the relative size of the trees I define the ratio Rt as follows:
Rt=(Final or asymptotic total biomass of the mean tree of the dominant species)/(Final total biomass of the mean tree of the dominated species)
For instance, in a SEMS of Q. robur, and P. pinaster the former is the dominant species.
For comparative purposes, given the different longevities of the species used, the simulations are from age 10 to 90 years. Exceptionally, the longevity of Aru can attain this age.
The relative yield is described as:
RY=(Global biomass of the SEMS, at age 90)/(Sum of the biomasses of self-thinned even-aged pure stands of the same species, at age 90)
To characterize the initial proportions of the species, I will refer the one of the dominant species (Pi), at age 10 years.
The values used in the simulations are: Pi=0.1, 0.2, 0.3,...0.9; Rt=0.5, 1.0, 1.5, ....5.0.
I will consider the six competitive hierarchies related do the types of tree interaction depicted in BARRETO (1999). The sems are: Qro+Pi; Fsy+Lde; Pel+Pha; Ppi+Pha; Aru+Pme; Pme+Psi. I will also simulate the sems Fsy+Pab, and Pab+Lde. The first species is the dominant, in the mixture.
For each one of the 90 simulations, of each mixture, I fitted eq. (1), to estimate the power e.
Also, for each one of these simulations, I calculated RY. I present the results in graphical form. Thus, for each mixture I present two graphics. For easier comparison with the graphic of RY, instead of plotting a, I plotted its absolute value m (m=│a│).
In the graphics of m, and RY, I inserted the two planes related to pure stands, respectively, m=0.3333, and RY=1.
To isolate the effects of Rt, and Pi, I consider stands with the total density of 10000 trees, at age 10, and variable area.
The Global Yield, and Allometry of SEMS
The values of m>0.333 suggests that the global production of the sems is greater than the sum of the production of the two separated populations in pure stands. The same occurs when RY>1. Below, it will be seen that there is a consistent coherence between the two graphics of each mixture, although a perfect isomorphism between them is highly unexpected.
First, I will present the results for the sems Fsy+Pab, and Pab+Lde.
Figure 1 is consistent with the empirical results presented in PRETZSCH (2009: figure 9.9(a)). Manipulating the perspective of the graphic for m, I estimate the value of Rt in the measured stands as close to 1.5.
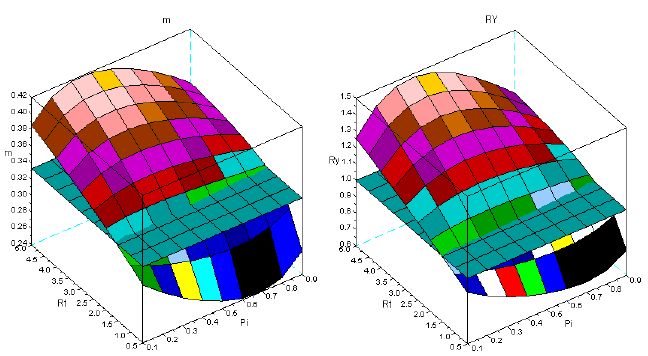
Figure 1 - Sems Fsy+Pab. For the symbols see the text
Figure 2 is supported by figure 9.9(b) in PRETZSCH (2009), and confirms the overyielding depicted in the measured stands, in Germany (PRETZSCH, 2009:352).
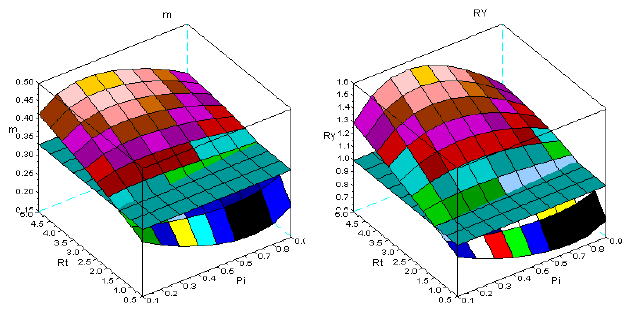
Figure 2 - Sems Pab+Lde. For the symbols see the text
The description of the six patterns of competitive interactions between two tree species was first described in BARRETO (1999). In Figures 3 to 8, I present the results of my simulations for the six sems.
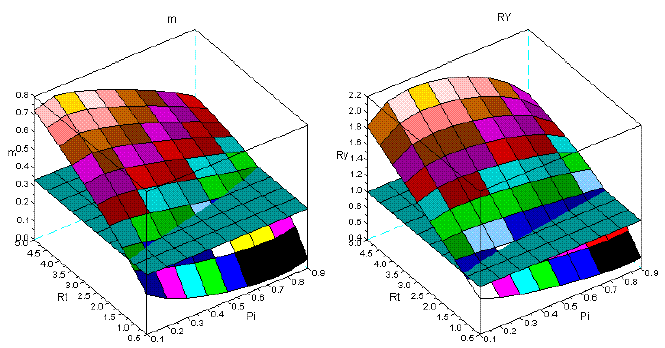
Figure 3 - Tree interaction of type I: sems Qro+Ppi. For the symbols see the text
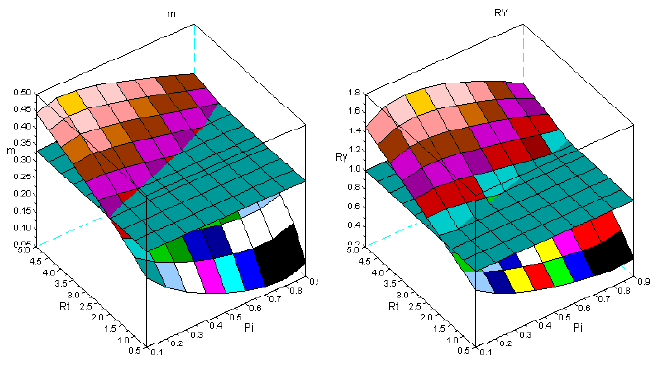
Figure 4 - Tree interaction of type II: sems Fsy+Lde. For the symbols see the text
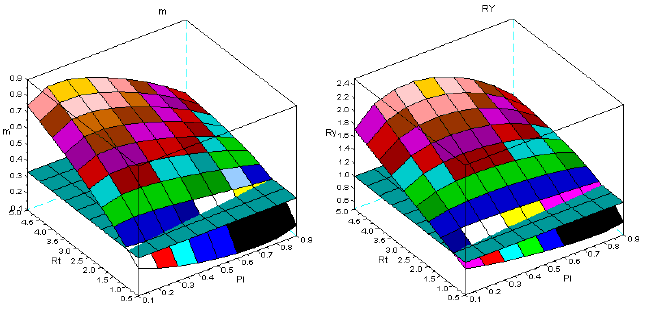
Figure 5 - Tree interaction of type III: sems Pel+Pha. For the symbols see the text
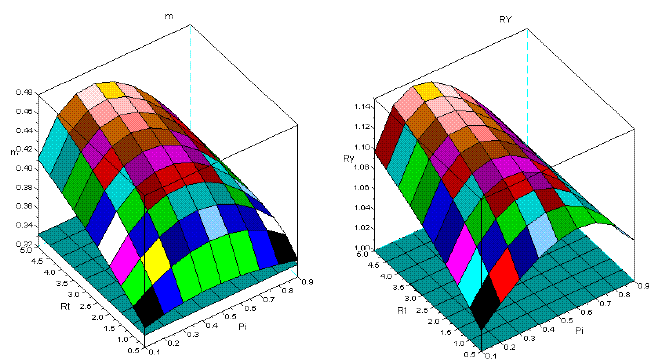
Figure 6 - Tree interaction of type IV: sems Ppi+Pha. For the symbols see the text
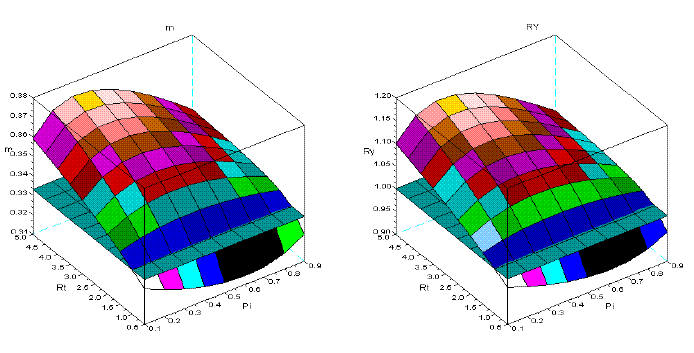
Figure 7 - Tree interaction of type V: sems Aru+Pme. For the symbols see the text
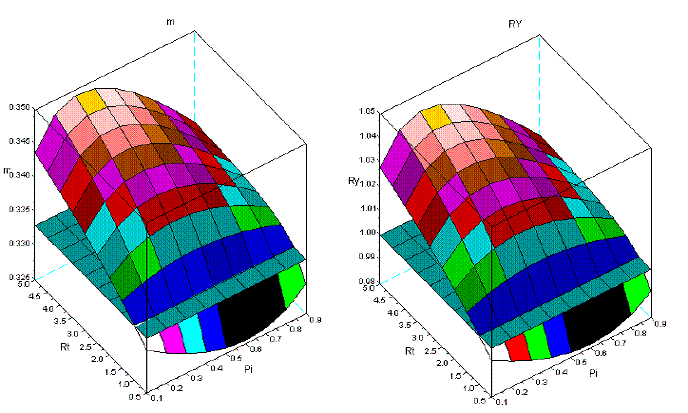
Figure 8 - Tree interaction of type VI: sems Pme+Psi. For the symbols see the text
The Dynamics of m, and RY
In this section I illustrate the effect of the variation of the dominance upon the dynamics of m, and RY. To estimate the intensity of dominance I consider the ratio of the relative mortality rates of the dominator over the same ratio of the dominated species (Rm), as I accept the Grime's hypothesis. For more details about this issue see, for instance, BARRETO (1997). I choose the sems Qro+Ppi with a steep increase of dominance, and for comparison the sems Fsy+Lde, with constant intensity of dominance. I exhibit their ratios of relative mortality rates in Figure 9.
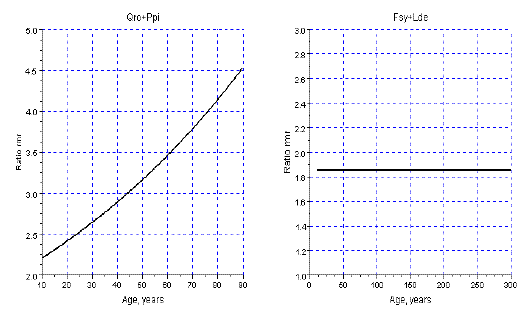
Figure 9 - Ratios of the relative mortality rates in the sems Qro+Ppi, and Fsy+Lde. The relative mortality rate of dominant species is the numerator (Qro/Ppi; Fsy/Lde)
In Figure 10, I present the results of my simulation for the sems Qro+Ppi. The effect of the variation of the intensity of dominance is conspicuous. Bellow a critical value of the Rm (and thus age) overyielding does not occur, as shown in the first row of this figure. The surfaces at early ages are also more complex to m, and both are completely different from the surfaces obtained with longer time series.
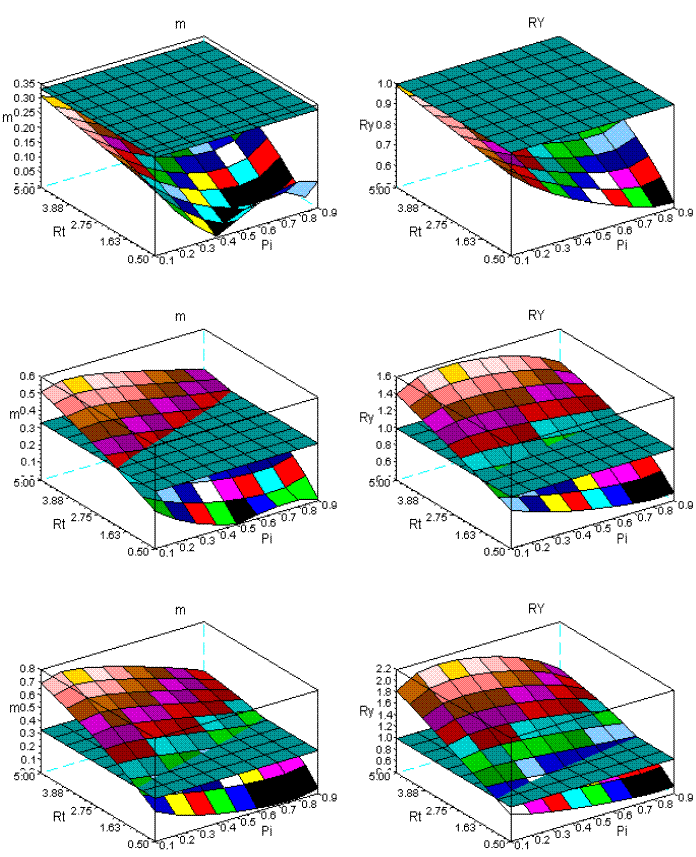
Figure 10 - The dynamics of m and RY in sems Qro+Ppi. First row: ages 10-30; second row: ages 10-60; third row: ages 10-90
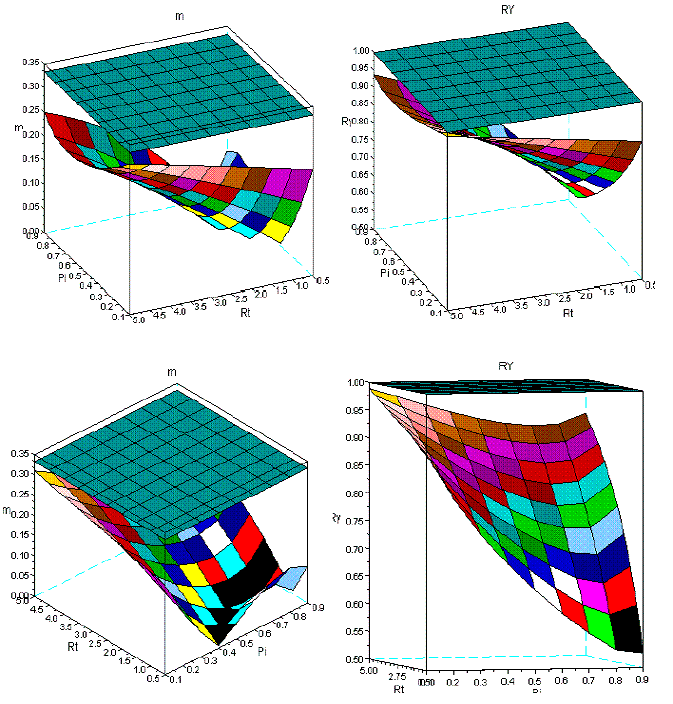
Figure 11 - Two different perspectives of the dynamics of m and RY in sems Qro+Ppi, covering ages from 10 to 30
In Figure 12, for the same age spans, I present the simulations for the sems Fsy+Lde. The change of the geometry of the surfaces is less conspicuous, as Figure 13, also confirms for the range 10-30. Given the longevities of Fsy, and Lde, I also introduce Figure 14, for the spans: 10-100, 10-200, 10-300 years. The variation of the geometry of the surfaces is negligible.
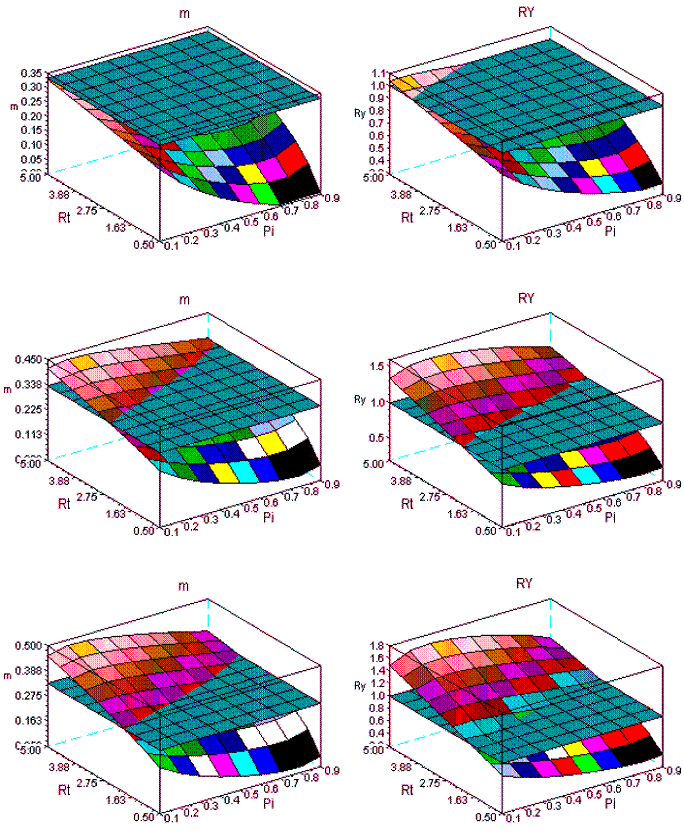
Figure 12 - The dynamics of m and RY in sems Fsy+Lde. First row: ages 10-30; second row: ages 10-60; third row: ages 10-90
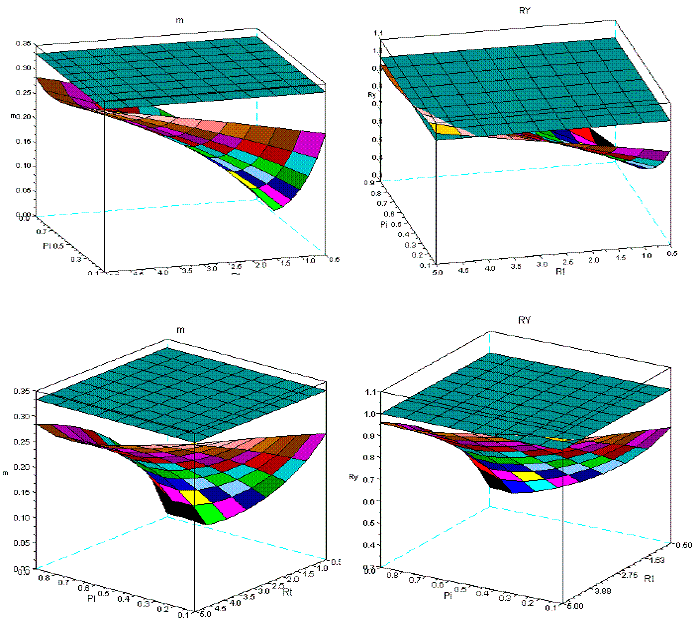
Figure 13 - Two different perspectives of the dynamics of m and RY in sems Fsy+Lde, covering ages from 10 to 30
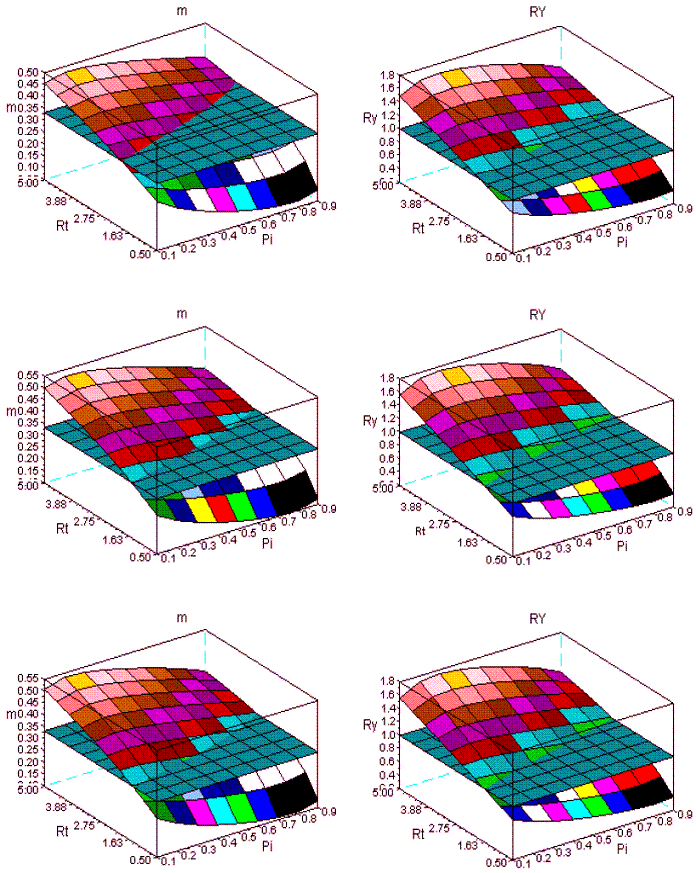
Figure 14 -The dynamics of m and RY in sems Fsy+Lde. First row: ages 10-100; second row: ages 10-200; third row: ages 10-300
The Global Dynamics of sems
The purpose of this section is two fold: a) To illustrate the transference of self-thinning from the dominant competitor to the dominated one; b) to obtain some insight in the behaviour of the dynamics of the biomass of the populations. I will use sems of type I (Qro+Ppi, figure 9), to fit Gompertz equations to the total biomass, and total density of the forests, and the same dynamics for each population. The results are displayed in Figures 15 to 17, Tables 2, and 3. I will fit the following form of the mentioned equation:
![]() (2)
(2)
where yf is the final or asymptotic value of y, R=yo/yf, y0 is the value of the variable at age t0, here admitted to be equal to 10 years, c>0.
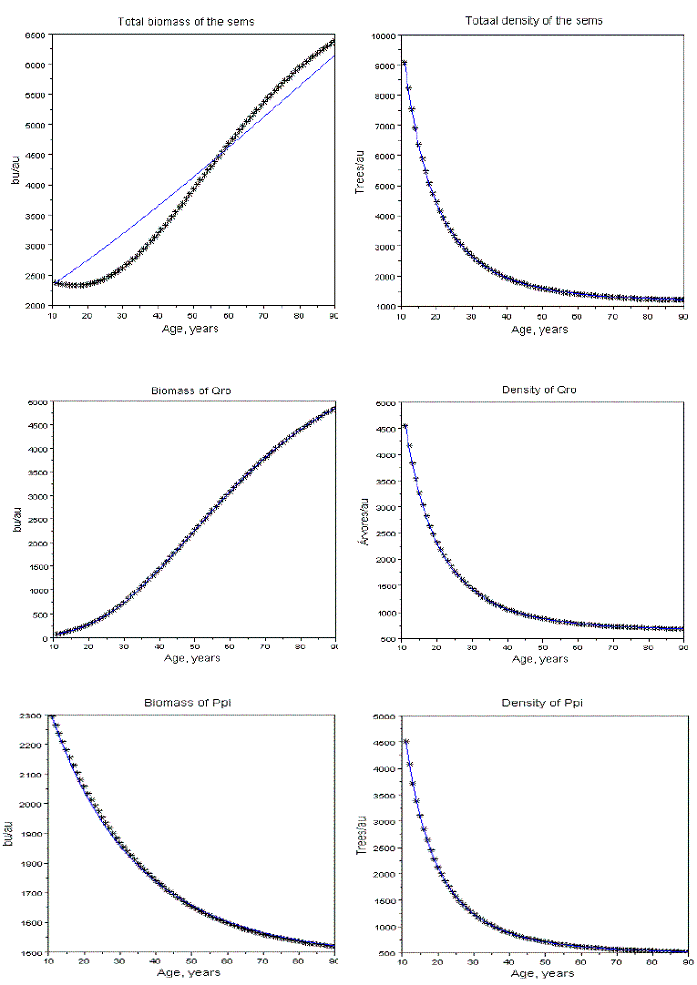
Figure 15 - Fitting of the Gompertz equation to the biomass and density of sems with Qro+Ppi, with Rt=3 e Pi=0.5, bu= biomass units; au=area unit. Total biomass of the sems does not abide the Gompertz equation. Data to be fitted represented by asterisk, fitted values by a line. Absolute mean relative errors of the fittings of the biomasses of Qro e Ppi, respectively, equal to 0.0015, and 0,0037
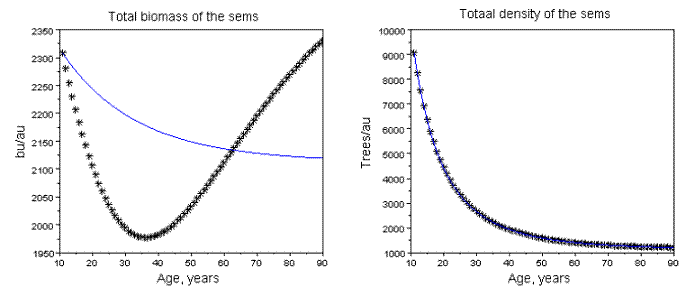
Figure 16 - Dynamics of the global biomass, and density of the sems with Qro+Ppi. Rt=0.5, Pi=0.5
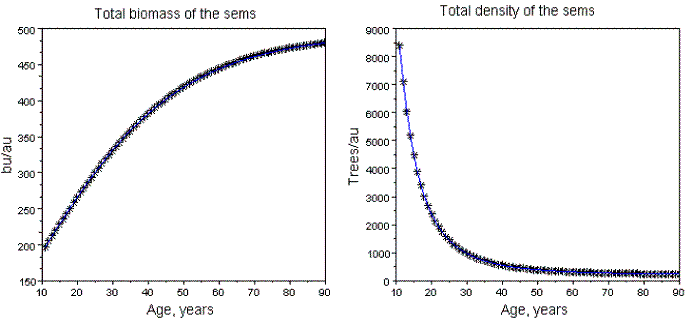
Figure 17 - Dynamics of the global biomass, and density of the sems with Pme+Psi. Rt=0.5, Pi=0.5
Table 2 - The fittings of the Gompertz equations to the density of the sems with Qro+Ppi, with several values of Rt, and Pi
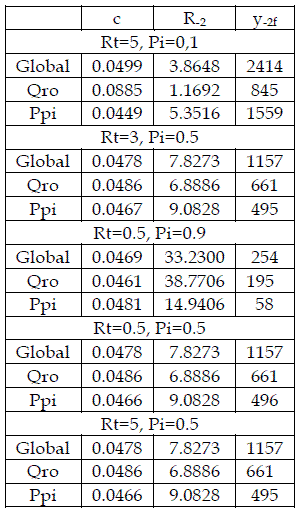
Table 3 - Absolute mean relative errors of the fittings in table 2. In the columns "Biomass" the signal + indicates that the dynamic abides the Gompertz equation, and the symbol – a non Gompertzian pattern

To fit the Gompertz equations, I used the method described in KHILMI, (1962:112). This method is very accurate, and avoids the guessing of trial values. This algorithm is also described in BARRETO (2005b: Chap. 4).
The sems simulated: a) at age 10 years have total density of 10000 trees, and variable area; b) the area of each stand is its area unit (au); c) the biomass units (bu) are also arbitrary. Operationally, these assumptions are more convenient to isolate the effects of Rt, and Pi. The simulations and fittings I made are described in Tables 2, and 3. In Figure 15, I exhibit the graphics related to sems with Rt=3, Pi=0.5. The effect of the mortality increasing of the dominated species is the existence of a critical value of Pi (Pic), such that for values of Pi> Pic, the total biomass of the populations decreases. In these situations, (simultaneous increasing of the biomass of the dominant competitor, and decreasing of the dominated one) the global biomass of the sems does not abide the Gompertzian pattern, as exhibited in Figure 15. The pattern of growth of the global biomass can also exhibit a non monotonic variation as displayed in Figure 16. The sems with two species that coevolved show always a Gompertzian pattern for all three biomasse dynamics, as shown in Figure 17.
The decreasing of mortality of Qro is translated in values of R-2 smaller then 125.9635, in table 2. Conversely, the increasing of mortality of Ppi is depicted by values of R-2>6.109. These statements are illustrated in Figure 18.
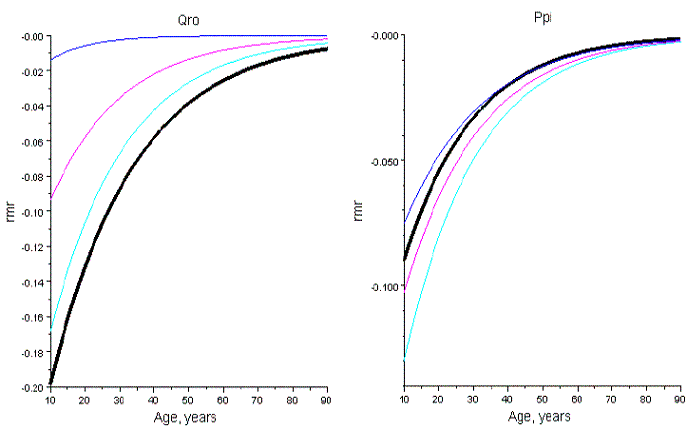
Figure 18 - Relative mortality rates of the sems in table 2, and of the species in pure stand (thickest line). Qro has less intense self-thinning in sems then in pure stand; the reverse happens in all sems of Ppi but one
The total biomass of Ppi can also have a non monotonic pattern of variation, as shown in Figure 19.
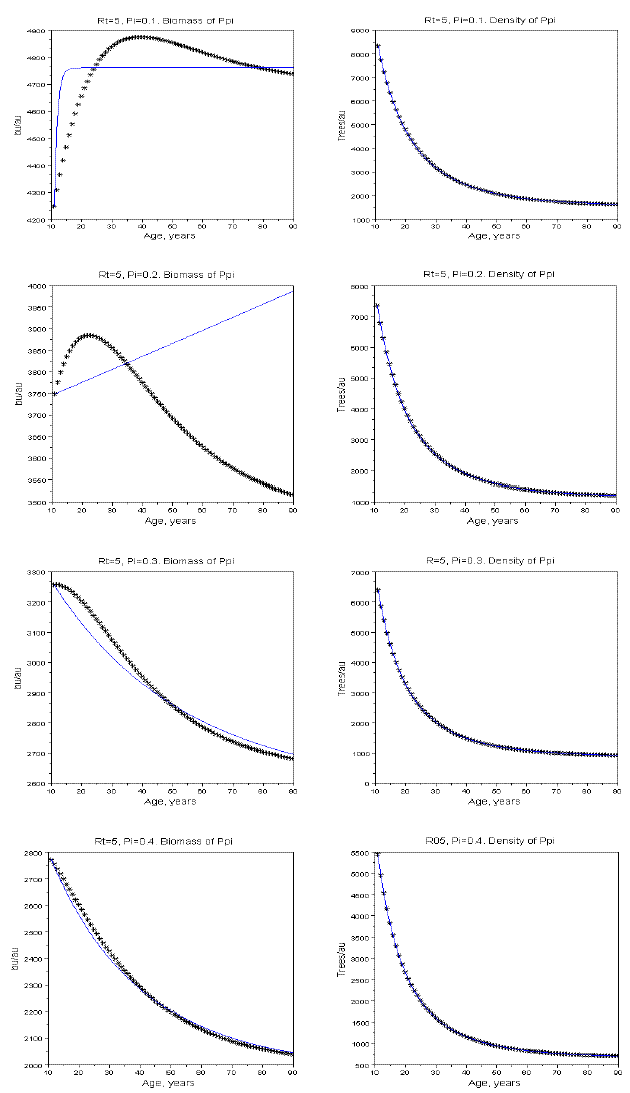
Figure 19 - The effect of Pi upon the pattern of growth of the biomass of Ppi. Rt=5, and Pi equal to 0.1, 0.2, 0.3, 0.4
Interpretation of the Results
Figures 1-8 show that there is a value of Pi that promotes the maximum production of biomass. The response of the yield to the proportions of the dominant species depends on the value of Rt. The greater is this value Rt the greater is the production of biomass. I explain this situation as follows: the self-thinning of sems is more intense for the trees of the dominated species. The trees of the dominant species have less self-thinning then in pure stand. The high values of Rt, guarantee that the larger trees, and with faster growth are preserved from mortality. They support the overyielding. In the same figures, it is also conspicuous that Rt<1 favours underyielding.
In Figure 10, the values of Rm - a measure of the transference of mortality from Qro to Ppi - increases with age. Before a critical age, this transference is not sufficient to sustain overyielding. In Figure 11, it is shown that the value of m, instead of a maximum has a minimum for Rt=5. For Rt=0.5, there is a minimum, and a maximum. The surface for RY has a less variable shape, and there is a minimum for each value of Rt. The shape of the surfaces are profoundly sensitive to age, and thus to Rm.
Also, the graphics are consistent with the competitive hierarchy characteristic of each type of interaction. For instance, types IV, V, and VI have species that coevolved and coexist in natural stands. Here, the values of m are close to 0.3333, and the values of RY are close to one. Underyielding is non-existent in the stands with the two Mediterranean pines (Figure 6, type IV). Empirical evidence can be found in VILA et al. (2001).
In the sems of a given mixture, the presence of overyielding depends on the possibility of the natural occurrence of high values of Rt. High values of Rt are controlled by the autoecology of the competitors, and the site quality, for each one of the competitors, of the places where they met.
Probably, for some sems, the necessary combinations of Rt, and Pi, for overyielding, never happen, in nature.
Conclusive Comments
I admit that my clarification of the global yield and allometry is coherent with my theory for mixed stands, in its total extension, and with its previous applications in simulations. Also it does not conflict with the applicable ecological concepts, and regularities related to this area.
The supporting empirical evidence displayed in PRETZSCH (2009), already mentioned, for the sems Fsy+Pab, and Pab+Lde confer a high level of verisimilitude to the six other simulations.
I already presented the formalizations of my theory for pure and mixed stands in BARRETO (2003c, 2004b). This formalizations or reconstructions (BUNGE, 2005:548-558) show the integral deducibility of my theory for forest stands. This property of my theory implies that my results for mixed stands can only be correct if both my theory for pure stands and the characterization of the dynamics of the species are also acceptable.
Figure 16 and 19 also show that the projection of the pattern of variation of the biomass of the populations and the all stand from the early ages can be misleading.
As I admit the time-space symmetry of sems and self-thinned uneven-aged mixed stands, the results here presented for the former stands are applicable to the standing biomass of the latter stands with stable age structure, in a given instant.
Mutatis mutandis, the analysis here presented is also applicable to standing merchantable volume measured in m3, as it is roughly equal to the total biomass expressed in Mg (e.g., PRETZSCH, 2009: eqs. (2.23), and (2.30)).
It is conspicuous the relevant role played by growth rates of forest variables, and associated relative (or per capita) growth rates in my constructs, since I started my approach to mixed stands (e.g., BARRETO, 1997), and in the life history strategies of the tree species (upper table 1; BARRETO, 2003d). I am not alone in this position. The Royal Society, in 2002, dedicated an issue of its Philosophical Transactions to a sole subject – population growth rates. In the introduction to this issue, it can be red "The thesis put forward in this issue of Philosophical Transactions is that population growth rate is the key unifying variable linking the various facets in population ecology". (SIBLY, HONE, CLUTTON-BROCK, 2002:1149). This unifying function implies the existence of one basic pattern for biological growth, evincing some versatility. The Gompertz equation satisfies these requirements.
Under an extensive perspective, this paper completes my analysis of mixed forests.
References
BARRETO, L.S., 1994.The Clarification of Self-Thinning and Thinning. A Simulation Approach. Silva Lusitana 2(2): 233-238. [ Links ]
BARRETO, L.S. 1996. Coexistence and competitive ability of tree species. Elaborations on Grime's theory. Departamento de Engenharia Florestal, Instituto Superior de Agronomia. Revised version published in Silva Lusitana 5(1): 79-93. [ Links ]
BARRETO, L.S., 1997. Coexistence and Competitive Ability of Tree Species. Elaborations on Grime's Theory. Silva Lusitana 5(1): 79-93. [ Links ]
BARRETO, L.S., 1999. A tentative typification of the patterns interaction with models BACO2 and BACO3. Silva Lusitana 7(1): 117-125. [ Links ]
BARRETO, L.S., 2001. O Modelo BACO3 para a Competição entre Plantas. Research Paper SB-02/01. Departamento de Engenharia Florestal, Instituto Superior de Agronomia. [ Links ]
BARRETO, L.S., 2003a. The Blended Geometry of Self-Thinned Uneven-Aged Mixed Stands. Research Paper SB-04/03. Departamento de Engenharia Florestal, Instituto Superior de Agronomia. Revised version submitted to Silva Lusitana. [ Links ]
BARRETO, L.S., 2003b. SB-BACO4. A Gompertzian Discrete Model for Tree Competition. Silva Lusitana 11(1): 77-89. [ Links ]
BARRETO, L.S., 2003c. A Unified Theory for Self-Thinned Pure Stands. A Synoptic Presentation. Research Paper SB-03/03. Departamento de Engenharia Florestal, Instituto Superior de Agronomia. Revised version submitted to Silva Lusitana. [ Links ]
BARRETO, L.S., 2003d. Growth, Regeneration, and Survival Indices for Tree Species. Research Paper SB-02/03. Departamento de Engenharia Florestal, Instituto Superior de Agronomia. Versão revista publicada na Silva Lusitana 17(1): 83-95. [ Links ]
BARRETO, L.S., 2004a. Tree Competition: Concepts, Models, and Patterns. Research Paper SB-01/04. Departamento de Engenharia Florestal, Instituto Superior de Agronomia. [ Links ]
BARRETO, L.S., 2004b. A Unified Theory for Self-Thinned Mixed Stands. A Synoptic Presentation. Research Paper SB-02/04. Departamento de Engenharia Florestal, Instituto Superior de Agronomia. [ Links ] Revised version submitted to Silva Lusitana.
BARRETO, L.S., 2005a. Gause's Competition Experiments with Paramecium sps. Revisited. Research Paper SB-01/05. Departamento de Engenharia Florestal, Instituto Superior de Agronomia. [ Links ] Revised version submitted to Silva Lusitana.
BARRETO, L.S., 2005b. Theoretical Ecology. A Unified Approach. Author's edition. E-book disseminated as PDF file. Lisbon. [ Links ]
BARRETO, L.S., 2007. The Changing Geometry of Self-Thinned Mixed Stands. A Simulative Quest. Silva Lusitana 15(1): 119-132. [ Links ]
BARRETO, L.S., 2008. The Reconciliation of the r-K, and C-S-R Models for Life-History Strategies. Silva Lusitana 16(1): 97-103. [ Links ]
BARRETO, L.S., 2009. Growth, Regeneration, and Survival Indices for Tree Species. Silva Lusitana 17(1): 83-95. [ Links ]
BARRETO, L.S., 2010. The Total Biomass of Self-Thinned Mixed Forests. A Theoretical and Simulative Inquiry. Preprint 01/10. [ Links ] Revised version submitted to Silva Lusitana.
BUNGE, M., 2005. Philosophy of Science. From Problem to Theory. Volume I. Transaction Publishers, New Brunswick. [ Links ]
Consortium Scilab (DIGITEO), 2009. Scilab-5.2. www.scilab.org [ Links ]
KHILMI, G.F., 1962. Theoretical Forest Biophysics. National Science Foundation, Washington, D.C. [ Links ]
PRETZSCH, H., 2009. Forest Dynamics, Growth and Yield. From Measurements to Model. Springer, Berlin. [ Links ]
SIBLY, R. M., J. HONE, T. H. CLUTTON-BROCK, 2002. Introduction. Phil. Trans. R. Soc. London B 2002 357:1149-1151. [ Links ]
VILA, M., VAYREDA, J., COMAS, L., IBÁÑEZ, J., OBÓN, B., 2007. Species Richness and Wood Production: a Positive Association in Mediterranean Forest. Ecology Letters 10: 241-250. [ Links ]
Entregue para publicação em Junho de 2010
Aceite para publicação em Abril de 2012


