


Serviços Personalizados
Journal
Artigo
 Inglês (pdf)
 Artigo em XML
 Referências do artigo
 Enviar este artigo por email
Indicadores
-
 Citado por SciELO
 -
 Acessos
Links relacionados
-
 Similares em
SciELO
Similares em
SciELO
Compartilhar

 Permalink
Silva Lusitana
versão impressa ISSN 0870-6352
Silva Lus. vol.19 no.1 Lisboa 2011
Modelling and Simulating Omnivory
Luís Soares Barreto
Jubilee Professor of Forestry
Av. do M.F.A., 41-3D, 2825-372 COSTA DE CAPARICA
Abstract
The author extends his models for the prey-predator interaction to omnivory. He considers food chains with three, and four trophic levels. The stability and the sensibility analysis of the models presented are approached. He considers variants of the basic model, such as the balance of the diet of the omnivore. He shows that his modelling strategy can easily incorporate stoichiometric modelling. Adequate conclusive remarks close the paper.
Key words: Balanced diet; modelling; omnivory; sensitivity analysis
Modelação e Simulação de Omnívoria
Sumário
O autor estende o seu modelo para a predação ao omnivorismo. Considera cadeias alimentares de três e quatro níveis tróficos. Aborda a estabilidade dos modelos e desenvolve análise da sua sensibilidade. Considera variantes do modelo básico, como o da dieta equilibrada. Mostra que a sua abordagem pode abarcar a modelação estequiométrica de ecossistemas. Comentários finais adequados encerram o artigo.
Palavras-chave: Análise da sensibilidade; equilíbrio da dieta; modelação; omnivorismo
Modélisation et Simulation de l'Omnivorisme
Résumé
L'auteur applique son modèle pour la prédation à la simulation des chaînes avec trois et quatre nivaux trophiques, avec omnivores. Il analyse la stabilité et la sensibilité de ses modèles. Il considère aussi des variantes des mêmes modèles, comme la diète équilibrée. Il montre que ses modèles peuvent être utilisés pour la simulation de la stoechiométrie des écosystèmes. Il termine son article avec des commentaires pertinents.
Mots clés: Analyse de la sensibilité; équilibre de la diète; modélisation; omnivorisme
Introduction
In BARRETO (2005), I presented a unified, basic framework for theoretical ecology. Among other aspects, I covered the following population interactions: amensalism, commensalism, mutualism, competition, predation, and linear food chains, but omnivory was leaved out. Also, I stated that I will attempt to apply the basic models to more complex trophic interactions. Here, I attempt to fill this gap presenting an extension of the model for predation, to omnivory. In a broad sense, I assume as an omnivore the organism that consumes resources from two different trophic levels.
This interaction was seen as rare, probably due to the instability evinced by the models used to mimic it, as accepted by some authors (e.g., MORIN, 1999: 172). Numerous, recent studies support the wide spread of omnivory (e.g., EUBANK, 2005). Also, new models overcame the instability shortcoming (e.g., BEGON, TOWNSEND, HARPER, 2006: 598). Today it is admitted that food web stability is enhanced by weak trophic interactions, and omnivory favors the occurrence of such interactions, when it promotes the existence of alternative flows of trophic transfer (e.g., POST, CONNERS, GOLDBERG, 2000). Briefly, omnivory is in fact accepted as an important population interaction that deserves the attention, and quest of researchers (e.g., VANDERMEER, 2006).
Tentatively, I will introduce models for omnivory in linear chains with three and four trophic levels. It is admitted that omnivory is associated to the balance of diet (EUBANK, 2005: 6), thus I will extend my modelling effort to the area of diet selection. To accomplish the extension of the basic model to these issues, for the benefit of comparison and easy reference, I adapt to my modelling frame a pertinent model selected from FRYXELL and LUNDBERG (1998).
A revision of bibliography, and new insights on the ecology of omnivory and predation can be found in BARBOSA and CASTELLANOS (2005).
All my calculations were made with software Scilab (Consortium Scilab (DIGITEO)), and R (R Development Core Team, 2006).
The Scilab listings, proposed in chapters 12 and 13 of BARRETO (2005), can be easily modified to accommodate omnivory.
The need for a unified and quantitative theory for ecology is recognized since the 70's (FORD, 2000: 500).
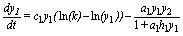
Basic Models for Omnivory
My basic model for omnivory is an extension of model SBPRED (1,1,1) (BARRETO, 2005: 134). In general terms, I consider a first trophic level (y1) (plant, part of a plant or an animal), an herbivore or predator (y2), and a top omnivore (y3).
First, let me recall model SBPRED (1,1,1):
 (1)
(1)
 (2)
(2)
 (3)
(3)
The extension of this model to SBPRED (1,1,1,1) is immediate (BARRETO, 2005: 137).
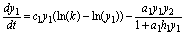
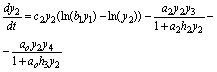
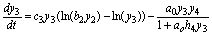
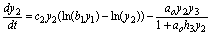
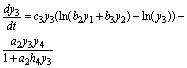
The basic model for omnivory can be concisely described as three differential equations of the Gompertz curve, tied by Holling type II functional responses, and it is written as follows:
 (4)
(4)
 (5)
(5)
 (6)
(6)
As usual, ai is the prey i encounter rate; hi is the handling time of prey by predator bi measures the contribution of each individual of prey to the carrying capacity of predator. It incorporates ai, hi, the relative abundance of the prey, competition with other consumers, the fraction of prey ingested, and the efficiency in transforming prey biomass into predator biomass. An open question is the constancy or variability of bi.
For easier reference I call the presented model SBOMN3.
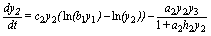
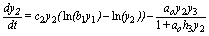
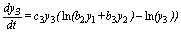
Omnivory in four trophic levels food chains had been studied both in aquatic and terrestrial communities (BEGON, TOWNSEND, HARPER, 2006: 581-582). For this situation I propose model SBOMN4, written as follows:
 (7)
(7)
 (8)
(8)
 (9)
(9)
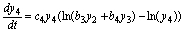 (10)
(10)
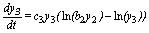
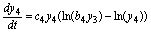
Also, I introduce model SBOMN4b as follows:
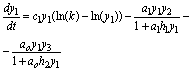 (11)
(11)
 (12)
(12)
 (13)
(13)
 (14)
(14)
In Figure 1, I present a graphical description of the food chains.
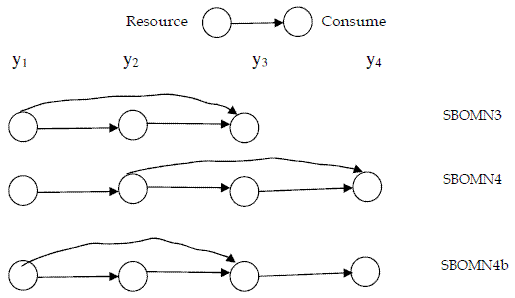
Figure 1 - Networks of the models for omnivory here introduced
The Stability of Models SBOMN3, and SBOMN4's
Models SBOMN3, and SBOMN4's are not sufficiently tractable to allow me to obtain the explicit algebraic solutions for them.
I tested numerous combinations of the parameters to scrutinize the stability of the solutions of the models, and I only found stable solutions, for a broad range of ecologically plausible values of the parameters. Omnivory is accepted as a stable interaction.
Although this verification, the models evince the so called paradox of enrichment, as I will illustrate ahead.
In Figures 2, 3 and 4, I exhibit a simulation of model SBOMN3, and SBOMN4's. The models, as model SBPRED(1, 1, 1), are stable even when the population y1 is depressed to values much smaller then the carrying capacity (k), as illustrated in the same figures. These properties have support in the writings of several authors who sustained that omnivory stabilize food webs (e.g., BASCOMPTE, MELIAN and SALA, 2005; FAGAN, 1997; McCANN and HASTINGS, 1997).
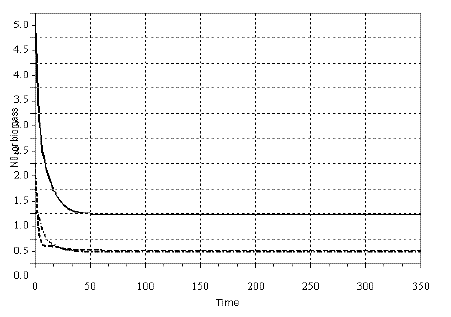
Figure 2 - Example of a simulation with model SBOMN3. The values of the parameters are as follows: c1=0.05, c2=0.5, c3=0.2, k=30, a1=1, h1=2, ao=1, h2=2, h3=1, b1=0.4, b2=0.1, b3=0.5. The initial sizes are y=[5, 2, 1]. The equilibrium sizes are y1*= 0.9857381, y2*=0.2725928, y3*=0.2348702. The eigenvalues of the Jacobian at equilibrium are -0.2346593 ± 0.0956110i, -0.1278424. Pasted from Scilab
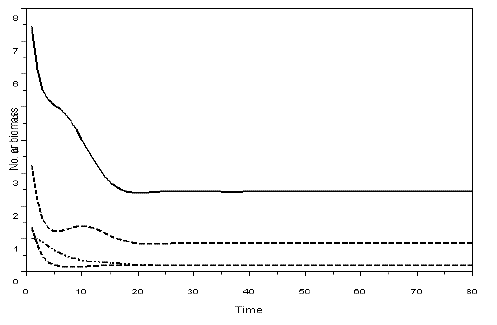
Figure 3 - Example of a simulation with model SBOMN4. The values of the parameters are as follows: c1=0.1, c2=0.4, c3=0.3, c4=0.15, k=30, a1=a2=ao=1, h1=h2=h3=h4=1, b1=0.6, b2=0.4, b3=0.1, b4=0.5. The initial sizes are y=[10, 5, 2, 1]. The equilibrium values are y1*= 2.4390711, y2*=0.8630624, y3*=0.2048115, y4*=0.1887120. The eigenvalues of the Jacobian at equilibrium are -0.1501381 ± 0.0573350i, -0.1736312 ± 0.3242814i. Pasted from Scilab
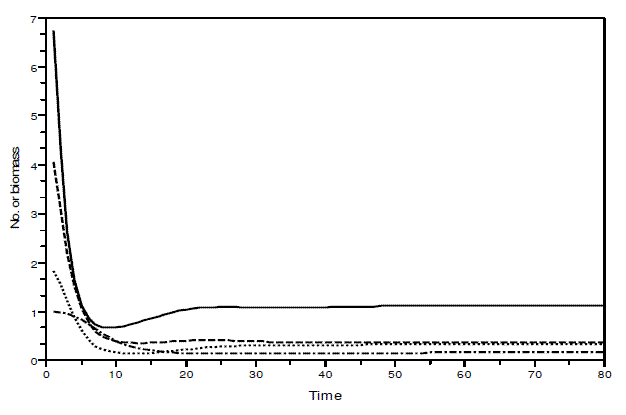
Figure 4 - Example of a simulation with model SBOMN4b. The values of the parameters are as follows: c1=0.1, c2=0.4, c3=0.3, c4=0.15, k=30, a1=a2=ao=1, h1=h2=h3=h4=1, b1=0.6, b2=0.4, b3=0.1, b4=0.5. The initial sizes are y=[10, 5, 2, 1]. The equilibrium values are y1*=1.1225879, y2*=0.3737709, y3*= 0.3236182, y4*= 0.1618091. The eigenvalues of the Jacobian at equilibrium are - 0.1425248 ± 0.0782616i, -0.1986015 ± 0.2884310i. Pasted from Scilab
In Figure 5, I present the phase portrait of a system of omnivory simulated with SBOMN3.
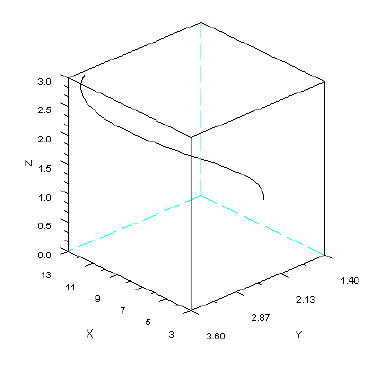
Figure 5 - Phase portrait of model SBOMN3. The parameters are as follows: c1=0.54;c2= =1.62;c3=0.81;k=30;a1=a2=ao=h1=h2=h3=1;b1=0.4;b2=0.1;b3=0.5. The initial sizes are y=[5, 2, 1]. y1=x, y2=y, y3=z. Pasted from Scilab
In nature, unstable equilibrium points are rare (TAUBES, 2008: 67). Also, PIMM (2002: xiv) emphasises that the majority of communities consist of stable populations.
Sensitivity Analysis of Predation and Omnivory
Some authors consider sensitivity analysis (SA) of a model an indispensable elaboration for any model, irrespective of its purpose (e.g., MULLIGAN, and WAINWRIGHT, 2004; SALTELLI et al., 2004: Chap. 8). Although I am not developing a model related to any real situation, SA can have a relevant role when applied to a general and theoretical model as SBOMN3, and SBOMN4's.
In the setting of this paper, SA can contribute for a better evaluation of the coherence of the model, and improve the understanding of the relationships among the parameters and the state variables. SA can also be used to identify the factors to whom allocate more research effort (factors prioritisation), in an eventual application of the models here mentioned (SBPRED (1,1,1), SBPRED (1,1,1,1), SBOMN3, SBOMN4, and SBOMN4b) to a concrete case. SA of trophic chains can also contribute to clarify the type of the interaction control (top-down or bottom-up).
The approach of SA that changes one parameter at a time is not applicable to the models, because the sensitivity tied to a given parameter changes with the variation of the others. For instance, in model SBOMN3, the sensitivity to changes in h1 increases if k increases. Thus, to accomplish the SA of the models I follow SALTELLI et al. (2004).
The main goal of my analysis is to identify the most influential characteristic parameters of the species interacting in a situation of predation and omnivory, upon their persistence and relative abundance. For this purpose, I must identify the form of the output of the model that answers my question. It should be a top statement variable, different of the model output as it is. I selected the well known Shannon-Wiener index of diversity (H) that simultaneously is a measure of the system entropy. H is a global measure of the persistence of the species, and their relative size. High values of H are associated with more evenness of the size of the populations (more balanced food chains).
It is worthwhile to mention that some authors, in the area of SA, criticized the use of variance as measure of output uncertainty, and proposed its replacement by entropy, evaluated by the Shannon-Wiener index (SALTELLI et al., 2004: 56-57).
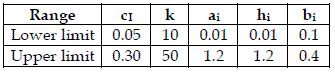
To achieve my purpose, for each model, I generated 200 combinations of random values of ci, k, ai, hi, bi. I used these values to run the model, with initial populations [y1=5, y2=2, y3=1], [y1=10, y2=5, y3=2, y4=1], and after I calculated H, from the asymptotic values of the yi. After all data was standardized (mean=0, variance=1). As I am not using real data, I used uniform distributions characterised in Table 1.
Table 1 - The ranges of the uniform distributions used to generate values of the model parameters
SA is a process seen as very complex, interactive, and full of surprises (SALTELLI et al., 2004: 61). To accomplish my SA, I used a method based in the decomposition of the variance of the output. This type of methods is extreme powerful, and provides a quantitative evaluation of the importance of the parameters or of groups of them. They are ideal for models that have a moderate number of factors, because they are computationally intensive. A more detailed evaluation of these methods can be found in SALTELLI et al. (2004: Chap. 5).
To apply the selected method I used routine "sobol.sal02" of the package for R, named "sensitivity" (PUJOL, 2006). This routine applies a variant of the method of Sobol', proposed by SALTELLI (2002). It estimates both first order (Si), and total order indices (STi) both with the same sampling scheme. In the output of this routine, negative values indicate unimportant factors, with sensitivity indices close to zero. A necessary and sufficient condition for factor xi to be non-influential is STi=0 (SALTELLI et al., 2004: 120). Alternative designations for Si are importance measure, correlation ratio or first order effect.
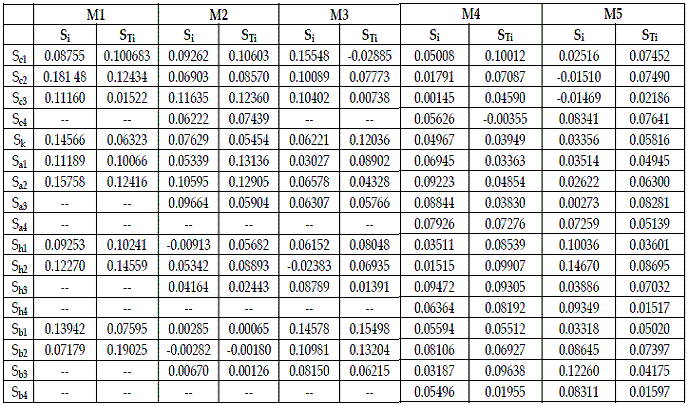
The output obtained with routine "sobol.sal02" is exhibited in Table 2. On all runs I made the number of bootstrap replicates equal to 40 (20%).
Table 2 - Importance of the parameters provided by routine "sobol.sal02". M1= SBPRED (1,1,1); M2=SBPRED (1,1,1,1); M3=SBOMN3; M4=SBOMN4; M5=SBOMN4b
In Table 3, I use the values of STi to order the parameters by decreasing importance.
Table 3 - The ordering of the parameters of the models by decreasing importance, using STi. The meaning of Mi is the same as in Table 2. Relative importance shown as per cent

Table 2 allows the statement of a first set of verifications:
a) In models SBPRED (1,1,1), and SBOMN4b all parameters are influential.
b) In model SBPRED (1,1,1,1) b2 is unimportant.
c) In model SBOMN3 c1 is non-influential.
d) In model SBOMN4 c4 is unimportant.
The figures in Table 3 show that the importance of the parameters varies with the type of interaction, connectivity of food chain, and their length. It is difficult to detect a pattern in the information exhibited in this table. A conspicuous feature of the figures in the table under scrutiny is that there are not factors that may be considered dominant (at least 30% of share of the total effect). The information in this table shows that to cover carefully the parameters that, at least cause about 50% of the variance of H, in models for predation, and SBOMN3, 4 parameters must be intensively investigated, and in the two remaining models, six parameters.
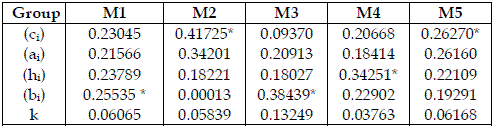
I do not depict any feature that may contend the coherence of the model's behaviour. In Table 4, I scrutinize the importance of the homogeneous groups of parameters of the models. Here, ai, and k never appear as a dominant type of parameters. ci are dominant in chains with four trophic levels, and a top predator (SBPRED (1,1,1,1), SBOMN4b). bi are dominant in chains with three trophic levels (SBPRED (1,1,1), SBOMN3). hi are dominant in a chain with four trophic levels, and a top omnivore (SBOMN4).
Table 4 - Aggregate importance of each type of parameters, expressed as values in the range 0-1. The meaning of Mi is the same as in Table 2. * indicates the most important set. Total order indices are used
I also attempt to scrutinize the importance of each trophic level. For this purpose I grouped the parameters as exhibited in Table 5. I admit that bi is only related to the consumed species. On the other hand, ai, and hi are exclusive characteristics of the consumer. The importance of the trophic levels is displayed in Table 6.
Table 5 - Characteristic parameters of each species used to obtain the results exhibited in Table 6
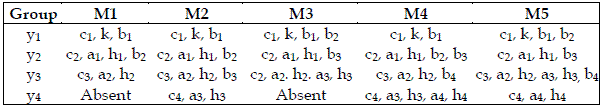
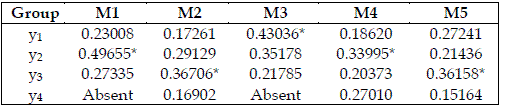
Table 6 - Importances of the trophic levels, expressed as values in the range 0-1. The meaning of Mi is the same as in Table 2. * indicates the most important species. Total order indices are used
The analysis and implications of the existence of a dominant variable are approached in TURÁNYI and RABITZ (2000: 91-93).
In Table 6, y2 is the most important species in model SBPRED (1,1,1), and in the chain with four trophic levels, and a top omnivore (SBOMN4). In the omnivore chains, the one with three trophic levels (SBOMN3) evinces the bottom species as the most important. In the chains with four trophic levels, and a top predator, (SBPRED (1,1,1,1), SBOMN4b), y3 is the most important species.
The SA I here presented may be strongly affected by the range of variation of the parameters, and the distribution they exhibit. This is a crucial issue that can only be clarified by extensive and intensive field work.
The actual environmental crisis brings new interest to predictions related to keystone species, control (bottom-up or top-down), and response to environmental variation, and severe perturbations, in food webs. In this context, the use of SA may become a valuable tool to guide research, and management of natural resources. I hope this section contributes to sustain this assertion.
The SA of a discrete model for fish populations is presented by COMENGES and CAMPOLONGO (2000). These authors apply the method of Morris.
Model SBOMN3 with Variable bi
Let yr be the size of the resource population and yc the size of the consumer population. A preliminary expression for bi may be the following one:
 (15)
(15)
m can be seen as a mean value of bi; er is the energy content of the resource; v is the rate of conversion of biomass of the resource into consumer biomass. ec/h is the profitability of the resource for the consumer,
In Figure 8, I present a simulation with a version of model SBOMN3 that accommodates eq. (15).
For the system in Figure 2, H=0.1925113; in Figure 8, H= 0.2167223. Probably, variable bi's are beneficial for the consumers.
The variation of food quality can also be incorporated in a model for bi.
Balanced Diet in Omnivory
For better fitness organisms require adequate nutrition. In organisms that consume not only one kind of food, as humans, a balanced diet is required for good health.
The diversification of food sources in omnivory has several advantages as reviewed in EUBANKS (2005). This author mentions various experiments where the supply of plant material decreases the consumption of prey, by omnivores. Also, the effect of plant food on the reduction of the per capita consumption of prey, by omnivores, is affected by several factors, as it was empirically verified (EUBANKS, 2005: 9). This assertion let us admit that a balanced diet is a relevant issue on the study of the feeding behaviour of omnivores. In this section, I deal with this topic.
There are several approaches to model diet selection. I will adapt to my theoretical setting, the one described in FRYXELL and LUNDBERG (1998: 42-51), particularly addressed to the equilibrium of diets.
I admit that omnivores search a balanced content of nutrients in their diet, and the status of this balance can affect their efficiency in using the energy existent in the food consumed.
Now, I will attempt to introduce balanced diet choice in model SBOMN3, both with constant and variable bi's.
I will summarize the description of the selected modelling approach. More details can be found in the reference just mentioned.
Let w be the best ratio, y1/ y2, of consumption of plant (y1), and prey (y2) by the omnivore. The energy content of plant and prey is, respectively, e1, and e2.
Two situations can be confronted: y1/ y2<w, and y1/ y2>w.
If y1/ y2<w then
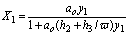 (16)
(16)
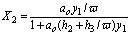 (17)
(17)
In the other situation applies
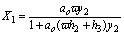 (18)
(18)
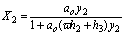 (19)
(19)
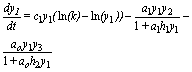
Model SBOMN3DS is introduced as:
 (20)
(20)
 (21)
(21)
 (22)
(22)
The explicit equations for the bl's are:
 (23)
(23)
 (24)
(24)
 (25)
(25)
In Figures 6 and 7, I exhibit simulations with the model for omnivory with balanced diet. I did not detect the paradox of enrichment in these models. Probably, diet selection reinforces the stabilizing effect of omnivory, because it favours the existence of weak interactions.
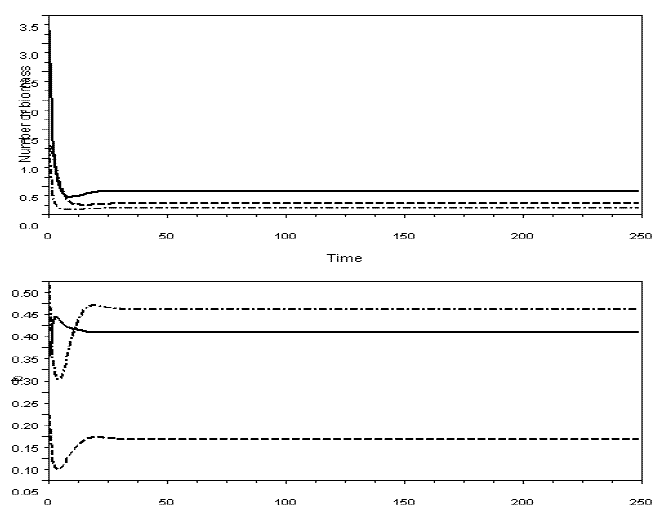
Figure 6 - Example of a simulation with model SBOMN3, with variable bi's. Upper graphic illustrates the dynamics of the yi's, the lower graphic the bi's. m1=m2=0.2, m3=0.3, v1=0.5, v2=0.5, v3=0.5, e1=1, e2=1.2, The values of the other parameters are as in Figure 2. The equilibrium values are y1*=0.4055237, y2*=0.1100737, y3*=0.1923791; b1*= 0.3838808, b2*= 0.4355625, b3*= 0.1430690. Pasted from Scilab
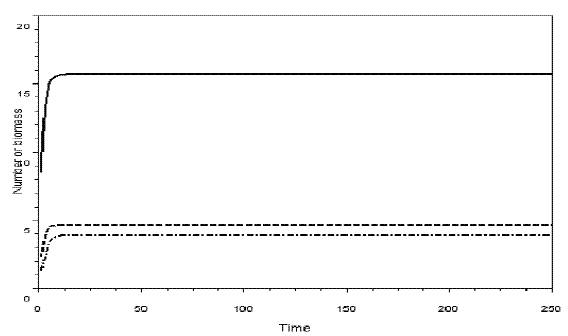
Figure 7 - Simulation of omnivory with balanced diet. c1=0.54; c2=1.62; c3=0.81; k=30; a1= ao= = h1=h2 = h3=1; b1=.4; b2=0.1; b3=.5; w=0.5. The initial sizes are y=[5, 2, 1]. The equilibrium values are: y1*= 15.678774, y2*=4.639011, y3*=3.8873829. H= =0.1882920. Pasted from Scilab
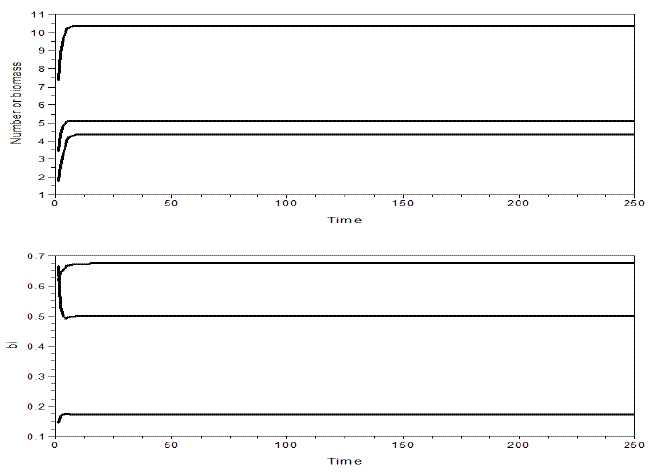
Figure 8 - Example of a simulation of omnivory with balanced diet, and variable bi's. Upper graphic illustrates the dynamics of the yi's, the lower graphic the bi's. m1=m2=0.2, m3=0.3, v1=0.5, v2=0.3, v3=0.2, e1=1.2, e2=3. The values of the other parameters are as in Figure 9. The equilibrium values are y1*= 10.352771, y2*= 5.1166205, y3*= 4.3472594; b1*= 0.6733963, b2*= 0.1733604, b3*= 0.4988643. H= 0.2228516. Pasted from Scilab
An Alternative to Stoichiometric Modeling
Actually, stoichiometric modelling (e.g., KUANG, HUISMAN and ELLER, 2004) is a hot issue in mathematical ecology. Fecundity as the capacity of a theory to give origin to more embracing solutions to problems, is one of its most important attributes. In this intrusive section, I propose a model that can be seen as an alternative way to mimic a terrestrial food chain, not ignoring its biogeochemistry.
It is known that in terrestrial ecosystems, excluding C, the cycles of the other elements, can be seen as closed (e.g., CHAPIN III, MATSON and MOONEY, 2002: 222). Also, in these ecosystems, the most ubiquitous situation is the one where the most strongly limiting nutrient imposes the quantitative expression of the cycles of the other essential nutrients (e.g., CHAPIN III, MATSON and MOONEY, 2002: 220). This pattern abides Liebig's Law of the Minimum.
Thus, in model SBOMN4, y1 can be seen as the weight of the limiting nutrient in the system, such as P. Now, in eq. (7), the Holling Type II function, established in 1959, can be expressed in its seminal form, the Michaelis-Menton equation proposed in 1913 (e.g., PASTOR, 2008: 120-121; 199-202).
Within this perspective:
1. The Gompertz model present in eq. (7) attempts to mimic the recycling of the nutrient, trough litter fall and decomposition. The smaller is the amount of free nutrient, the largest is the standing biomass and, thus the greater is the litter fall.
2. k is the total quantity of nutrient present in the closed system.
3. c1 is the rate of recycling of the nutrient. It reflects the promptitude of the processes of litter fall and decomposition in liberating the nutrient for uptake by the plant. It can be modelled as a function of variable controlling factors such as precipitation, temperature, and the redox potential.
4. b1 incorporates the nutrient use efficiency of the plant.
5. b2 and b3 can be modelled in a way that reflects any seasonal variation of food quality that may occur.
As already stated, the model evinces the paradox of enrichment, if k is strongly increased. When simulating with model SBOMN4 with the same parameters as in Figure 3, but k≥600, instead of 30, the population of herbivores disappears, and the food chain is virtually reduce to three trophic levels (Figure 9).
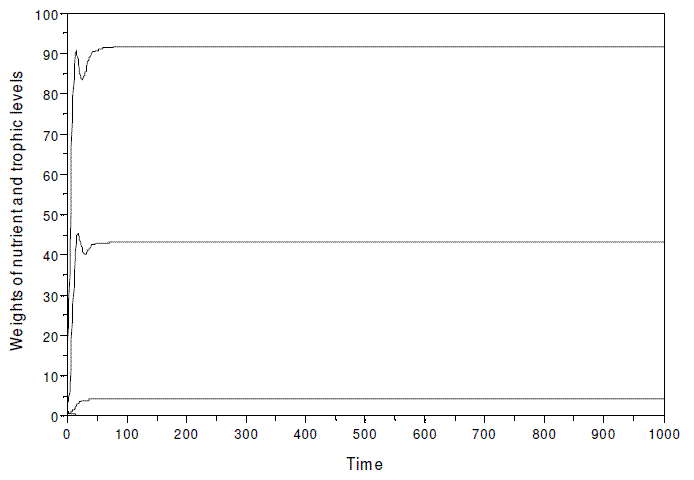
Figure 9 - A simulation of model SBOMN4 with the same parameters as in Figure 3, but k, assumed as equal to 600, instead of 30. The equilibrium values are y1*= 91.632806, y2*= 43.061818, y3*=0.0000101, y4*= 4.3061868. In this hypothetical ecosystem, the nutrient is expressed in kg, and the biomass of the trophic levels as Mg
In Figure 10, I illustrate the system of Figure 3 with k=100, when two different situations occur: a) the nutrient and the three trophic levels coexist since time=0; the omnivore is introduced at time=300. It is verified that the species invasion does not destabilize the system, and the two cases evince the same equilibrium values (y1*=18.282831, y2*=7.7793261, y3*=0.2859557, y4*=0.9209105). If the omnivore is absent, the equilibrium values are y1*=37.789336 , y2*=9.2009094, y3*=3.6799028. The presence of the omnivore has an important impact upon y1, and y3.
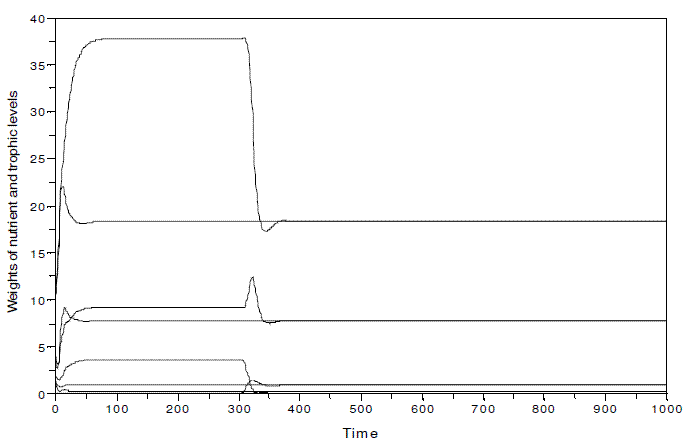
Figure 10 - System nutrient-plant-herbivore-omnivore in two different simulations: a) the nutrient and the three trophic levels coexist since time=0; the omnivore is introduced at time=300. All parameters as in Figure 3, but k, equal to 100. y1*= 18.282831, y2*=7.7793261, y3*=0.2859557, y4*=0.9209105. In this hypothetical ecosystem, the nutrient is expressed in kg, and the biomass of the trophic levels as Mg
As the main purpose of this paper is a basic model for omnivory, I will not go further in this issue. I will approach it latter, but before I close this section let me formulate a question: if we embark in the direction of very detailed stoichiometric models are we moving from mathematical ecology to mathematical ecophysiology?
Conclusive remarks
Let me point out some important aspects of the elaborations here presented:
1. I successfully extended my theory (BARRETO, 2005) to omnivory, maintaining its capacity to control small stable populations, and stable food chains with four trophic levels.
2. The results exhibited by the sensitivity analysis let foreseen that the control of a food chain depends on the number of trophic levels. This does not surprise because it is admitted that food-chain length is a central characteristic of ecological communities that strongly affects important functional aspects of the ecosystem.
3. In Table 6, only model SBPRED (1,1,1) shows a trophic level whose importance is greater then 40%, and it is not neither the bottom or top ones. Probably, food chains are simultaneously controlled by more then one trophic level.
4. A strategy in stoichiometric models is to assume at least two values of the carrying capacity k (LOLADZE, KUANG, and ELSER, 2000; KUANG, HUISMAN and ELLER, 2004). This attitude confers plausibility to the introduction of variable carrying capacities in the models I proposed in BARRETO (2005).
5. My alternative approach to stoichiometric modelling evinces the capacity of my theory to approach new problems with simple solutions, and internal coherence.
6. The same alternative approach is justified by the possibility of reduce the complexity of very detailed models, such as CENTURY, to a parsimonious set of differential equations, with negligible loss of generality and more conspicuous intelligibility, as BOLKER, PACALA, and PARTON, Jr. (1998) had shown.
7. There is a plethora of interest and work in food webs, using modeling, among other tools (e.g., PASCUAL and DUNNE, 2006). In my opinion, those models that incorporate prey-predator equations that do not allow small and stable prey populations must be regarded with caution. I extend this precaution to all models that use the logistic equation. As stated by KOT (2001: 116) "the dynamics of the Lotka-Volterra prey-predator model are fascinating", but is its ecological verisimilitude appealing? Before we commit ourselves to the modeling of food webs, we must try to obtain a set of basic and sound models, as I attempted to establish in BARRETO (2005), and now I engage in reinforcing its completeness with this paper. The robustness of a building depends on the quality of the bricks used.
8. The benefits of the use of mathematics in ecology can be obtained from the formal analysis of the models, and their use in numerical simulations. Mathematically tractable models are then advantageous, but their tractability, and the elegance of analysis they allow can not overcome their ecologically correctness. In this context, the analysis of an incorrect model is a pure exercise of mathematical analysis, and nothing more
9. My theory unifies allometry, demography, populations, and communities within variable time and spatial scales. This is required to obtain the largest benefits from the analysis of ecological data, and move towards a general and robust ecological theory that encompasses ecological systems of all degrees of complexity.
10. The unifying power, internal consistency, and fecundity of my theory are reinforced by the results here presented.
References
BARBOSA, P., CASTELLANOS, I., Eds., 2005. Ecology of Predator-Prey Interactions. Oxford University Press, Oxford. [ Links ]
BARRETO, L.S., 2005. Theoretical Ecology. A Unified Approach. Author's edition released as e-book, in format PDF. Costa de Caparica, Portugal. [ Links ]
BASCOMPTE J, MELIAN, C.J., SALA, E., 2005. Interaction strength combinations and the overfishing of a marine food web. Proc Natl Acad Sci USA 102(15): 5443-7. [ Links ]
BEGON, M., TOWNSEND, C.R., HARPER, J.L., 2006. Ecology. From Individuals to Ecosystems. Fourth Edition. Blackwell Publishing, Oxford. [ Links ]
BOLKER, B.M., PACALA, S.W., PARTON Jr., W.J., 1998. Linear Analysis of Soil Decomposition: Insights from the CENTURY Model. Ecological Applications 8(2): 425-439. [ Links ]
CHAPIN III, F.S., MATSON, P.A., MOONEY, H.A., 2002. Principles of Terrestrial Ecosystem Ecology. Springer, New York. [ Links ]
COMENGES, J.-M.Z., CAMPOLONGO, F., 2000. An Application of Sensitivity Analysis to Fish Population Dynamics. In A. SALTELLI, K. CHAN, and E.M. SCOTT, Eds., Sensitivity Analysis. John Wiley and Sons, Ltd, Chichester, pp. 367-383. [ Links ]
EUBANKS, M.D., 2005. Predacious Herbivores and Herbivores Predators. The Biology of Omnivores and the Ecology of Omnivore-Prey Interactions. In P. BARBOSA, and I. CASTELLANOS, Eds. Ecology of Predator-Prey Interactions. Oxford University Press, Oxford, pp. 3-16. [ Links ]
FAGAN, W.F., 1997. Omnivory as a stabilizing feature of natural communities. Am Nat 150: 554-67. [ Links ]
FORD, E.D., 2000. Scientific Method for Ecological Research. Cambridge University Press, Cambridge. [ Links ]
FRYXELL, J.M., LUNDBERG, P., 1998. Individual Behaviour and Community Dynamics. Chapman & Hall, London. [ Links ]
KOT, M., 2001. Elements of Mathematical Ecology. Cambridge University Press, Cambridge. [ Links ]
KUANG, Y, HUISMAN, J., ELLER, J.J., 2004. Stoichiometric Plant-Herbivore Models and their Interpretation. Mathematical Biosciences and Engineering 1(2): 215-222. [ Links ]
LOLADZE, I., KUANG, Y., ELSER, J.J., 2000. Stoichiometry in producer-grazer systems:
Linking energy flow with element cycling. Bull. Math. Biol. 62: 1137-62. As model description, and reference in Pastor (2008:262-266; 311).
McCANN, K., HASTINGS, A., 1997. Re-evaluating the omnivory stability relationship in food webs. Proc R Soc Lond B 264: 1249–54. [ Links ]
MULLIGAN, M., WAINWRIGHT, J., 2004. Modelling and Model Building. In J. Wainwright, and M. Mulligan, Eds. Environmental Modelling. Finding Simplicity in Complexity. John Wiley and Sons, Ltd, Chichester, pp. 7-73. [ Links ]
PASCUAL, M., DUNNE, J.A., Eds., 2006. Ecological Networks: Linking Structure to Dynamics in Food Webs, Oxford University Press, Oxford. [ Links ]
PASTOR, J., 2008. Mathematical Ecology of Populations and Ecosystems. Wiley-Blackwell, Chicester. U.K. [ Links ]
PIMM, S.L., 2002. Food Webs. The University of Chicago Press, Chicago. [ Links ]
PUJOL, G., 2006. Sensitivity: Sensitivity Analysis. R package version 1.2. Originally developped at Commissariat a l'Énergie Atomique CEA and Service d'Études et de Simulation du Comportement des Combustibles CEA/DEN/CAD/DEC/SESC, France. [ Links ]
POST, D.M., CONNERS, M., GOLDBERG, D.S., 2000. Prey preference by a top predator and the stability of linked food chains. Ecology 81: 8–14. [ Links ]
R Development Core Team, 2006. R: A Language and Environment for Statistical Computing R Foundation for Statistical Computing, Vienna, Austria. [ Links ]
SALTELLI, A., 2002. Making best use of model evaluations to compute sensitivity indices. Computer Physics Communication 145: 580–297. As mentioned in Pujol (2006). [ Links ]
Scilab Group. Scilab Reference Manual. INRIA Meta2 Project/ENPC Cergrene, France. [ Links ]
SALTELLI, A., TARANTOLA, S., CAMPOLONGO, F., RATTO, M., 2004. Sensivity analysis in practice. A Guide to Assessing Scientific Models. John Wiley & Sons publishers. [ Links ]
TAUBES, C.H., 2008. Modelling Differential Equations in Biology. Second edition. Cambridge University Press, Cambridge. [ Links ]
TURÁNYI, T., RABITZ, H., 2000. Local Methods. In A. SALTELLI, K. CHAN, and E. M. SCOTT, Eds. Sensitivity Analysis. John Wiley and Sons, Ltd, Chichester pp. 81-99. [ Links ]
VANDERMEER, J., 2006. Omnivory and the stability of food webs. Journal of Theoretical Biology 238: 497-504. [ Links ]
Entregue para publicação em Março de 2009
Aceite para publicação em Julho de 2009
