


Serviços Personalizados
Journal
Artigo
 Inglês (pdf)
 Artigo em XML
 Referências do artigo
 Enviar este artigo por email
Indicadores
-
 Citado por SciELO
 -
 Acessos
Links relacionados
-
 Similares em
SciELO
Similares em
SciELO
Compartilhar

 Permalink
Silva Lusitana
versão impressa ISSN 0870-6352
Silva Lus. vol.19 no.1 Lisboa 2011
Changes in Distribution of Carbon in Various Forest Types of India from 1995-2005
Rajiv Pandey*, G.S. Rawat* and J. Kishwan*
*Ph. D.
Biodiversity and Climate Change Division. Indian Council of Forest Research and Education, Dehradun, Uttarakhand, 248 006 India
Abstract
India has 76.87 million ha of forest and tree cover spread across 16 major forest types. These forests are potential source for critical ecosystem goods and services to the poor residing at the periphery. On the other hand the significant role of forests in carbon storage and sequestration has increased their importance manifold and brought them to the centre-stage of climate change mitigation strategies.
The national policies of India for forests for conservation and sustainable use has provided the opportunity to the forests as a net sink of CO2. From 1995 to 2005, carbon stocks stored in India's total forests have increased from 6244.78 to 6621.55 million tonnes (Mt). This amount of carbon sequestration will dent the emissions from various sources. This potential may be enhanced by reducing the barriers of different forest types, which hinders the carbon sequestration. In the present study we tried to explore the addition and reduction of carbon in the various types by using the data of various reports and papers. So that forests with decreasing carbon sequestering capability may be identified and addressed for enhancement of existing capability.
Our study reveals that carbon addition per ha is maximum in montane wet temperate forests followed by sub alpine and alpine forest and sub tropical dry evergreen forests in 1995 and 2005. However, for a few forest types the per unit carbon sequestration capability was decreased during the decades. This was highest in littoral and swamp forest followed by tropical semi evergreen and sub tropical broad leaved hill forest. Possible causes of carbon addition were pointed aiming to improve the situations of carbon sequestration of existing forests.
Key words: Carbon sequestration; sink; biomass carbon; forest management; mitigation measures.
Alterações na Distribuição do Carbono em Diferentes Tipos de Floresta na Índia entre 1995-2005
Sumário
A Índia tem 76,87 milhões de hectares de floresta, distribuídos por 16 tipos de espécies principais. Estas florestas, para os pobres residentes dos subúrbios, são uma fonte potencial de bens e serviços obtidos a partir de ecossistemas frágeis. Por outro lado, o papel significativo que as florestas desempenham no armazenamento e sequestro do carbono, aumentou a sua importância e colocou-as no centro das estratégias de mitigação das alterações climáticas.
As políticas nacionais de conservação e sustentabilidade das florestas na Índia aproveitaram a oportunidade criada para considerar as florestas como sumidouros de carbono. De 1995 a 2005, o carbono armazenado na totalidade das florestas indianas aumentou de 6244,78 para 6621,55 milhões de toneladas (MT). Este sequestro do carbono tem várias origens. O seu potencial pode ser intensificado reduzindo as barreiras dos diferentes tipos de floresta, que obstaculizam o sequestro do carbono. Neste estudo, tentámos pesquisar o aumento e redução do carbono nos diferentes tipos de floresta, utilizando dados de vários relatórios e trabalhos, de modo a que as florestas em que a capacidade de sequestro de carbono esteja a diminuir possam ser identificadas e geridas para que a referida capacidade aumente.
O nosso estudo revela que o acréscimo de carbono/ha é máximo nas florestas temperadas húmidas de montanha, seguidas pelas florestas subalpinas e alpinas e pelas florestas secas subtropicais de folha persistente, de 1995 a 2005. No entanto, para alguns tipos de floresta, a capacidade de sequestro de carbono tem vindo a decrescer há décadas. Este facto tem o seu máximo nas florestas pantanosas do litoral, seguindo-se as florestas tropicais de folha semi-persistente e subtropicais de folhosas de montanha. Apontam-se as possíveis causas de aumento de carbono, com o objectivo de melhorar o sequestro de carbono das florestas existentes.
Palavras-chave: Sequestro de carbono; sumidouro; carbono da biomassa; gestão florestal; medidas de mitigação.
Changements dans la Distribution du Carbone dans Différents Types de Forêts en Inde entre 1995-2005
Résumé
L'Inde a 76,87 millions d'hectares de forêts, distribués parmi 16 types d'espèces principales. Pour les populations pauvres des périphéries, ces forêts sont une source potentielle de biens et de services, obtenus à partir d'écosystèmes critiques. Le rôle significatif que les forêts jouent dans le stockage et séquestre du carbone a augmenté leur importance et les a mises au centre des stratégies de mitigation des changements climatiques.
Les politiques nationales de conservation et sustentabilité des forêts en Inde ont profité de l'occasion pour considérer les forêts comme des puits à carbone. Entre 1995 et 2005, le carbone stocké dans la totalité des forêts indiennes a augmenté de 6244,78 à 6621,55 millions de tonnes (MT). Le séquestre du carbone a plusieurs origines. Ce potentiel peut être intensifié en réduisant les barrières des différents types de forêts, qui rendent difficile le séquestre du carbone. Dans cette étude, nous avons étudié l'augmentation et la réduction du carbone dans les différents types de forêts, en utilisant les données de plusieurs rapports et travaux, pour que les forêts dont la capacité de séquestre du carbone est en train de diminuer puissent être identifiées et gérées afin d'augmenter leur capacité.
Notre étude montre que l'accroissement du carbone/ha est maximum dans les forêts tempérées humides de montagne, suivies par les forêts subalpines et alpines et par les forêts subtropicales de feuille persistante, entre 1995 et 2005. Cependant, pour certains types de forêts, la capacité de séquestre du carbone décroit depuis des années. Cette assertion est maximale dans le cas des forêts marécageuses du littoral, suivies par les forêts tropicales de feuilles semi persistantes et subtropicales de feuillus de montagne. On signale les causes possibles de l'augmentation du carbone, dans le but d'améliorer le séquestre du carbone des forêts existantes.
Mots clés: Séquestre du carbone; puits à carbone; carbone de la biomasse; gestion des forêts; mesures de mitigation
Introduction
Forests influence climate and the climate change processes by changing the concentration of atmospheric carbon dioxide. They act as "carbon sinks" by absorbing CO2 from atmosphere and as "carbon source" by releasing CO2 into the atmosphere while deforestation. Overall, the world's forest ecosystems are estimated to store more carbon than the entire atmosphere (FAO, 2006). However, the significant role of forests in carbon storage and sequestration has been considered more vital in the present climactic context and therefore at the centre-stage of climate change mitigation strategies (KISHWAN et al., 2009).
The estimated forest’s total carbon stock in 2010 is 652 billion tonnes in biomass, dead wood, litter and soils, corresponding to 161.8 tonnes per hectare with 44 percent in the biomass, 11 percent in dead wood and litter, and 45 percent in the soil (FAO, 2010). Geographically, the carbon stock varies significantly depending on the forest cover and associated vegetation.
In India, forest biomass carbon stock ranges from 7.94 Mt during 1880 and nearly half after 100 years (RICHARDS and FLINT, 1994). This range from 8.58 to 9.57 Gt C for biomass and soil carbon stocks in 1986 (RAVINDRANATH et al., 1997; HARIPRIYA, 2003; CHHABRA and DADHWAL, 2004). The total forest stocks contained 10.01 Gt C in 2005 (FAO, 2005). With an annual increment of 37.68 Mt during 1995 to 2005, the carbon stocks increased from 6.25 to 6.62 Gt during these periods (KISHWAN et al., 2009).
These differences in estimates are caused by high uncertainties in data of actual land use change and deforestation coupled with the approach adopted for estimation (BROWN and IVERSON, 1992). These differences can be minimized, if precise information about land use change and deforestation were available (BROWN et al., 1993). This required the assessment of the carbon at macro level for different vegetations or geographical basis for pooling. The location average density of biomass and soil carbon coupled with actual vegetation types may provide a better approach for overall carbon estimates of any region or forest. Partly or in derived forms, this approach has been used and advocated by many researchers for carbon estimation in different pools (ATJAY et al., 1979; BROWN and LUGO, 1982; PRENTICE et al., 1992). This sort of information is beneficial for formulation of proper regional forest management strategy and for the proper visualization of carbon mitigation potential in global carbon cycle processes at spatial basis (BROWN et al., 1993).
The other important issue lies for the regular assessment of the carbon cycle i.e. fixation of atmospheric carbon dioxide through photosynthesis and the emissions on spatio-temporal basis due to the continuous disturbance by the anthropogenic activities. The total net flux of carbon in the atmosphere has increased from 397Tg C to 2103Tg C from 1850 to 1995 (HOUGHTON and HACKLER, 2000). Therefore, countries are more interested to increase carbon storage capacity on land to check the rising concentrations of CO2 in the atmosphere. In this context the zone or vegetation distribution may provide guidelines for possible adjustment to increase the sequestration potential. This kind of information is lacking for many forests of the world including India's.
Despite the existence of studies conducted to estimate the carbon for location or species basis, a comprehensive approach is lacking to capture the whole forests of the country. For example, in Pune city, trees of the city are sequestering fifteen thousand tonnes of carbon each year (WARRAN and PATWARDHAN, 2008) and in Kolli Hills, Eastern Ghats, Tamilnadu, forests contain 2.74 Tg biomass carbon and 3.18 Tg soil carbon (Ramachandran et al., 2007). Examples of carbon sequestration potential by species are e.g. 22.66 t C ha-1 for Shorea robusta forests and 11.25 t C ha-1 for Tectona grandis forests in 1994 (MANHAS et al., 2006). The annual carbon sequestration rate were estimated to 8.97 t C ha-1 by Shorea robusta, 11.97 t C ha-1 by Albizzia lebbek, 2.07 t C ha-1 by Tectona grandis and 3.33 t C ha-1 by Artocarpus integrifolia in the West Bengal (JANA et al., 2009). This variability is attributed to the genetic makeup and phenotypic interactions of these species.
Based on aforementioned, the present study attempts to seek the distribution of carbon storage potential in various forest types of India’s forest through evaluation of soil and biomass carbon components based on secondary sources. This will provide information on the existing capacity of forest types for carbon storage and facilitate the comparative performance of these forests. This information may lead for the effective management of the country forest for carbon in segmental perspectives in addition to the mitigation potential of each forest types. It may also facilitate the decision making process about the conversion of forests to other land uses and temporal assessment of changes (HOUGHTON, 2005) and also lead to suggestive measures for improving the sequestration potential of the forests.
Profile of forest types group in India
CHAMPION and SETH, 1968, classified India's forests into four major classes namely tropical, sub-tropical, temperate and alpine. These major classes are further divided into following 16 type groups. The details are reported in Table 1.
Table 1 - Regional distribution of the forest types in India
Figure 1 shows the geographical distribution of these 16 forest types in India. Out of these forests types, tropical dry deciduous forest form the major forest cover in India as per geographical area basis followed by tropical moist deciduous forests.
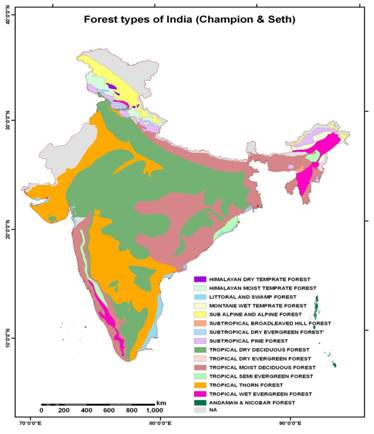
Figure 1 - Geographical distribution of forest types of India
Methodology
Estimation of biomass and soil carbon stocks in forestry sector is based either on IPCC guidelines or through use of actual conversion and expansion factors applied on growing stock (GS) data of forest inventories. In the present study, the total biomass and soil carbon in India's forests was considered from KISHWAN et al., 2009 and area under various forest types group was from FSI reports (FSI, 1995 and FSI, 2008). These data will be used to assess the carbon stocks in various forest types groups of the country. Algebraically, the respective forest carbon stocks under each forest types can be represented as:
 (1)
(1)
Where,
 = Total available carbon in the forest type, i.e., in the vegetation and in soil
 = Total available carbon in the above and below ground biomass of all vegetation in the forest type
 = Total available soil organic carbon (SOC) up to 30cm depth in the forest type
Soil Organic Carbon (SOC) Pool
The secondary source of information was used to derive the area and average soil carbon for different forest types. The area under each forest types of the country in 1995 and 2005 are reported in Table 2. It clearly reflects that the lowest area of forest is under the Himalayan dry temperate forest and the highest area is under tropical moist deciduous forest type in both years. Tropical dry deciduous and tropical moist deciduous forests constitute more than 50% of the forest area of the country.
Table 2 - Details about Area (in 000, ha) and Soil Carbon (in t) in Various Forest Types
Table 2 also contains the average soil carbon in tonnes per hectare (t ha-1) for each forest type. The variation of average soil carbon was lowest in tropical thorn forest and highest for montane wet temperate forest (Table 2). This variation is attributed to the combination of vegetations besides the topography and climatic factors within the types. Based on the estimate, the total soil carbon for each type was estimated by multiplying the average with the respective area under each forest type for the year 1995 and 2005, separately.
 (2)
(2)
 = Average soil organic carbon (t ha-1)
 = Area under the Forest Type in ha
Biomass Carbon
Biomass carbon can be disaggregated into above ground and below ground biomass for all lands with more than one hectare in area, with a tree canopy density of more than 10 per cent. The various secondary information was considered for estimating all the above and below forest floor biomass by incorporating suitable expansion and conversion factors or ratios. The biomass carbon for the tree and forest cover is obtained from KISHWAN et al., 2009.
The referred study uses the conservative value of 40% carbon content due to the content of mixed biomass (LEVINE, 1996) with the average moisture content of 20% mcdb (moisture content on dry basis) in dry wood and other biomass (LEACH and GOWEN, 1987; HALL et al., 1994). It was with the supposition that good amount of water still remains in wood even after proper drying (LUDWIG et al., 2003). Conservative values of carbon content and mcdb have been adopted to have realistic estimates in view of the errors that are generally associated with use of such values and factors in computation of total growing stock, wood densities, expansion and conversion factor, etc.
The biomass carbon under different forest types was not available for both years. Therefore, it was estimated by taking average of the proportional share of area and proportional share of soil carbon under each forest type. The respective biomass carbon under each forest type was estimated by multiplying the average proportional share with the total biomass carbon of country’s forest (KISHWAN et al., 2009). The proportion of the soil was considered as surrogate of changes occurred during the years, if any as well as under the consideration that soil carbon has linkages with vegetation's biomass. (DEAN, 1930; JENNY et al., 1948; RAMACHANDRAN et al., 2007; BHATTACHARYYA et al., 2008). The proportional share of biomass took into consideration that the trend may be followed, as the biomass accumulation has lagged property and thus accounted for the variation in carbon due to distribution of biomass (FUNG and WANG, 2001; HOUGHTON, 2005). The biomass carbon for each forest type was estimated as follows:
 =
=  (3)
(3)
where  is total biomass carbon in the year i.e. sum of carbon under all forest types, and R is ratio defined as follows:
 (4)
(4)
where  is proportional share of soil carbon under the forest type and
  is proportional share of area under the forest type in the year.
Proportional share of soil carbon
= (Individual share of soil carbon under the forest type / Total soil carbon)
Proportional share of area under the forest type in the year
= (Individual share of area under the forest type in the year / Total forest area in the year)
Total Carbon
The total carbon was obtained by adding the total soil carbon with the biomass carbon in the year for 1995 and 2005 i.e. by overall sum of the equation 2 and 3 for all forest types. The incremental evaluation was also estimated on per unit area basis. This will explain the actual changes and comparative scenario in the total carbon stock under each forest type during this period and will also be a guide for the future plantation program or the restoration of degraded forests.
Results
The available data showed that the overall average soil carbon of India’s forest was 55 Mt ha-1.
The analysis reveals that the contribution of soil carbon was maximum in tropical moist deciduous forest (35.76%) followed by the tropical dry deciduous forest (17.55%). Soil carbon was minimum in Himalayan dry temperate forest owing to little area and low SOC. The contribution of tropical dry evergreen forest and sub tropical broad leaved hill forest was also at lower side for sequestration capability (Table 3). This scenario of soil carbon remains the same for both the years in the country’s pool except interchange between Tropical Semi Evergreen Forest and Sub Alpine and Alpine Forest due to increase in area.
Table 3 - Soil and Biomass Carbon (in Mt) in Various Forest Types Based on Ratio
Biomass carbon was maximum in tropical moist deciduous forest (41.88%) followed by the tropical wet evergreen forest (16.21%), and tropical dry deciduous forest (13.14%). The biomass carbon was added to respective soil carbon to derive the total carbon stock (biomass and soil) in each forest type (Table 3). The lowest contribution of carbon stock was from the Himalayan dry temperate forest and tropical dry evergreen forest. Similar trend was observed for total carbon pool in different forest types in both years. This was primarily due to the use of the same proportion.
Maximum decadal change (Table 3) has been observed for tropical moist deciduous forest, tropical wet evergreen forest and tropical dry deciduous forest. However, this information reflects the actual changes in volume of carbon stock within the various types in totality. This may not fulfill the objectives for better management of land or land use changes decisions. The prior prediction of the carbon stock may also not be possible in the absence of the information for smaller units.
Therefore, contribution of carbon per unit hectare was estimated to visualize the definite share of each forest type. This may facilitate the conservation and sustainable aspects of the forests through optimizing the carbon share of different forest types. It will also provide options to shift the combinations of native vegetations, which promote the carbon sequestration.
Carbon per unit hectare was highest in tropical wet evergreen forest followed by montane wet temperate forest in both years. Minimum per unit hectare occurred in tropical thorn forest and tropical dry deciduous forest.
The analysis revealed that in some of the forests the carbon sequestration capability was reduced during the decades. These forest types were Himalayan moist temperate, littoral and swamp, sub tropical broad leaved hill, tropical dry evergreen, tropical semi evergreen, tropical thorn and tropical wet evergreen. This loss was highest in littoral and swamp forest followed by tropical semi evergreen and sub tropical broad leaved hill forest. These reductions may be attributed to degradation due to various natural and anthropogenic causes, such as landslides, bamboo flowering, insect pest attack on tree crops, land conversion for developmental activities, forest fires, high extraction of biomass for fuel wood and fodder due to population explosion.
However, carbon sequestration capability was increased in montane wet temperate forest, sub alpine and alpine forest and sub tropical dry evergreen forest (Table 4). This fact may be attributed to the proper and effective forest management, which leads to regeneration and stages of various ecological climaxes, increasing forests' density and hence biomass.
Table 4 - Per Unit Ha Carbon Sequestration (in Mt) in Various Forest Types
Discussion
Forests are among the most productive terrestrial ecosystems and attractive for climate change mitigation (NABUURS et al., 2007). Exchange of C between forests and the atmosphere is being influenced by natural and anthropogenic disturbances. Understanding and quantifying the impacts of disturbances are prerequisites to selecting forest management options aimed at enhancing C sinks and reducing C sources, while maintaining other ecological, social, and economic benefits of the forest (BLACK, et al., 2008) as disturbance was the primary mechanism that changes ecosystems from C sinks to sources based on FLUXNET synthesis (BALDOCCHI, 2008).
The varied low carbon density among a few forest types is mostly due to vegetation degradation rather than to the actual characteristics of the types. This may be attributed to the either temporary or permanent changes in structure, density (canopy closure, canopy quality, tree density, biomass density and fragmentation), and species composition, not the deforestation. The probable changes occurred due to the biophysical, socioeconomic and political disturbances as drought, fire, insect pests, pollution, defoliants, incentives, political stability and other natural and human hazards (GRAINGER, 1996). Deforestation is an extreme case of degradation, as it temporarily reduces the density of vegetation cover to zero (GRAINGER, 1993) and mitigation measures through forest management and plantation on degraded land provide better solutions (GRAINGER, 1990).
This study ranges differences in the carbon stock among various forest types and may be below their capability of sequestration potential, therefore it is worth to protect the existing forests, which in turn sequester carbon by regeneration and regrowth (IVERSON et al., 1994). In the present context, if the poor forest with low carbon sequestration potentiality start sequestrating at least with world average biomass sequestration potential of 81 t per ha (FAO, 2010), the carbon addition in India’s forest will be increased by 614.61 Mt. Hypothetically, this increase in carbon stock will be 1027.83 Mt, if all the forest types of India will sequester carbon at least equal to the national average (97.8 t) of 2005. Moreover, this option is cheaper than the new plantation options theoretically until and unless the potential of the carbon sequestration has not reached to the steady state.
The GHG mitigation benefits of reducing deforestation are greater than the benefits of reforestation (CANADELL and RAUPACH, 2008). However, the success lies with the political willingness (resources in terms of manpower and money) and administrative commitment (implementation) of better management of forest. Forest policy has therefore potential implications in respect of carbon scenarios in country’s forests. It clearly shows that the degradation of land in terms of loss in soil productivity or biomass degradation or in combination of both reduces total carbon content of forests. Therefore, for modeling exercise under the various regime of forest land use under assumptions of mature or primary forest, the carbon may have different values (HOUGHTON et al., 1987; BROWN et al., 1993).
Another domain of the finding provides significant implications about the plantation options and proper management of existing forests for mitigating the carbon accumulation. Despite the general assumption that in matured forests, carbon accumulation reached at the steady state (LUGO and BROWN, 1992), a recent meta-analysis evidence of old-growth globe's forests indicated that these forests also continue to accumulate significant amounts of C (LUYSSAERT et al., 2008).
The sequestration may be improved by planting other more adaptive species, which can sustain against the disturbance as growth conditions change with climate change, the potential range of species will also change. Research is required on how different tree species (e.g., nitrogen fixers) can affect the magnitude and permanence of soil C stocks including the effect of N fertilization, because increased C inputs into the soil through litterfall and root decomposition can either speed up or slow down the decomposition of labile and recalcitrant soil organic matter. The plantation should be oriented with high potential carbon sequestration species based on specific studies in the forest types (RAMACHANDRAN et al., 2007; WARRAN and PATWARDHAN, 2008). The species should be selected based on the scientific evaluation at the particular location so that it can facilitate better carbon sequestration with their gregarious growth e.g. (JANA et al., 2009).
Research is also required to determine the effects of fire suppression on the risk of intense crown fires and other types of disturbance (e.g., insect outbreak). Insect infestations can cause defoliation, partial or total tree mortality, reductions in forest CO2 uptake in photosynthesis, and increases in emissions from the decay of biomass. Periodic insect and disease infestations have always been part of the natural cycles of growth, self-thinning, death, and rejuvenation of forest stands, especially in the interior forests. Controlling insect infestations remains a challenge, and more research is required on emergence, survival and physiology of existing insect species and those appearing as a result of changing climate.
Additional research efforts are also needed to determine to what extent stand disturbance (fire, harvesting and insect outbreak) will increase runoff and ultimately affect soil erosion and losses of organic matter, and on how different tree species, e.g., nitrogen fixers, (BLACK, et al., 2008) can affect the magnitude and permanence of soil C stocks in different forest types.
References
ATJAY, G.L., KETNER, P., DUVIGNEAUD, P., 1979. Terrestrial primary production and phytomass. In: The Global Cycle. Eds.: Bolin, B.; Degens. E.T.; Kempe, S. and Ketner, P. John Willey & Sons, Chichester. pp. 129–181. [ Links ]
BALDOCCHI, D., 2008. Breathing of the terrestrial biosphere: lessons learned from a global network of carbon dioxide flux measurement systems. Australian Journal of Botany 56: 1-26. [ Links ]
BHATTACHARYYA, T., PAL, D.K., CHANDRAN, P., RAY, S.K., MANDAL, C., TELPANDE, B., 2008. Soil carbon storage capacity as a tool to prioritize areas for carbon. Current science 95(4): 482-494. [ Links ]
BLACK, T.A., JASSA, R.S., FREDEEN, A.L., 2008. Carbon Sequestration in British Columbia's Forests and Management Options. Pacific Institute for Climate Solutions, University of Victoria, Victoria. [ Links ]
BROWN, S., LUGO, A.E., 1982. Storage and production of organic matter in Tropical Forests and their role in global carbon cycle. Biotropica 14: 161-187. [ Links ]
BROWN, S., IVERSON, L.R., 1992. Biomass estimates for tropical forests. World Resource Review 4: 366-384. [ Links ]
BROWN, S., IVERSON, L.R., PRASAD, A., LIU, D., 1993. Geographical distributions of carbon in biomass and soils of tropical Asian forests. Geocarto International 4: 45- 59. [ Links ]
CANADELL, J.G., RAUPACH, M.R., 2008. Managing forests for climate change mitigation. Science 320: 1456-1457. [ Links ]
CHAMPION, H.G., SETH, S.K., 1968. A Revised Survey of the Forest Types of India. Manager of Government of India Publications, New Delhi. [ Links ]
CHHABRA, A., DADHWAL, V.K., 2004. Assessment of major pools and fluxes of carbon in Indian forests. Climatic Change 64(3): 341–360. [ Links ]
DEAN, A.L., 1930. Nitrogen and organic matter in Hawaiian pineapple soils. Soil Sci. 30: 439–442. [ Links ]
FAO, 2005. State of the World’s Forests. FAO, Rome. [ Links ]
FAO, 2006. Global Forest Resources Assessment 2005: Progress towards sustainable forest management. FAO Forestry Paper 147. Food and Agriculture Organisation of the United Nations, Rome. [ Links ]
FAO, 2010. Global Forest Resources Assessment 2010: Progress towards sustainable forest management. FAO Forestry Paper 163. Food and Agriculture Organisation of the United Nations, Rome. [ Links ]
FSI, 1995. Extent, composition, density, growing stock and annual increment of India's forests. Forest Survey of India, Ministry of Environment & Forests, Dehradun. [ Links ]
FSI, 2008. State of forest report, 2005. Forest Survey of India, Ministry of Environment and Forests Government of India, Dehra Dun, India. [ Links ]
FUNG, J.Y., WANG, Z.M., 2001. Forest biomass estimation at regional and global levels, with special reference to China's forest biomass. Ecological Research 16: 587-592. [ Links ]
GRAINGER, A., 1990. Modelling the impact of alternative afforestation strategies to reduce carbon dioxide emissions. In: Proceeding of the IPCC conference on tropical forestry response options to global climate change. São Paulo, Brazil. Report No. 20P-2003, USDA, Washington. 95-104 pp. [ Links ]
GRAINGER, A., 1993. Controlling tropical deforestation. Earthscan Publications, London. [ Links ]
GRAINGER, A., 1996. Degradation of tropical rain forest in Southeast Asia: Taxonomy and appraisal. In: Eden, J.M. and Parry, J.T. (Ed.), Land degradation in the tropics. Pinter, London. [ Links ]
HALL, D.O., ROSILLO-CALLE, F., WOODS, J., 1994. Biomass utilization in households and industry: Energy use and development. Chemosphere 29: 1099–1119. [ Links ]
HARIPRIYA, G.S., 2003. Carbon budget of the Indian forest ecosystem. Climate Change 56: 291–319. [ Links ]
HOUGHTON, R .A, 2005. Aboveground Forest Biomass and the Global Carbon Balance. Global Change Biology 11: 945–958. [ Links ]
HOUGHTON, R.A., HACKLER, J.L., 2000. Changes in terrestrial carbon storage in the United States. I: The roles of agriculture and forestry. Global Ecology Biogeography 9:125-144. [ Links ]
HOUGHTON, R.A., BOONE, R.D., FRUCCI, J.R., HOBBIE, J.E., MELILLO, J.M., PALM, C.A., PETERSON, B.J., SHAVER, G.R., WOODWELL, G.M., MOORE, B., SKOLE, D.L., MYERS, N., 1987. The flux of carbon from terrestrial ecosystems to the atmosphere in 1980 due to changes in land use: geographic distribution of the global flux. Tellus 39 B: 122-139. [ Links ]
IPCC, 2000. Land use, land-use change and forestry. Special report, Cambridge University. Intergovernmental Panel on Climate Change, Geneva. [ Links ]
IVERSON, L.R., BROWN, S., PRASAD, A., MITASOVA, H., GILLESPIE, A.J.R., LUGO, A.E., 1994. Use of GIS for estimating potential and actual biomass for continental South and Southeast Asia. In: Dale, V. (Ed.): Effects of land use change on atmospheric CO2 concentrations: Southeast Asia as a case study. Springer Verlag, New York. [ Links ]
JANA, B.K., BISWAS, S., MAJUMDER, M., ROY, P.K., MAZUMDAR, A., 2009. Carbon sequestration rate and aboveground biomass carbon potential of four young species. Journal of Ecology and Natural Environment 1(2): 15-24. [ Links ]
JENNY, H., BINGHAM, F.T., PADILLA-SARAVIA, B., 1948. Nitrogen and organic matter contents of equatorial soils of Colombia, South America. Soil Sci. 66: 173–186. [ Links ]
KISHWAN, J., PANDEY, R., DADHWAL, VK, 2009. India’s Forest and Tree Cover: Contribution as a Carbon Sink. 130 ICFRE BL – 23. ICFRE, Dehradun. [ Links ]
LEACH, G., GOWEN, M., 1987. Household Energy Handbook. World Bank Technical Pap. 67, World Bank, Washington, D.C. [ Links ]
LEVINE, J.S., 1996. Biomass Burning and Global Change. MIT Press, Cambridge, MA. pp. 902 +28. [ Links ]
LUDWIG, J., MARUFU, L.T., HUBER, B., ANDREAE, M.O., HELA, G., 2003. Domestic Combustion of Biomass Fuels in Developing Countries: A Major Source of Atmospheric Pollutants. Journal of Atmospheric Chemistry 44: 23–37. [ Links ]
LUGO, A.E., BROWN, S., 1992. Tropical forests as sinks of atmospheric carbon. Forest Ecology and Management 54: 239-255. [ Links ]
LUYSSAERT, S., SCHULZE, E-D., BORNER, A., KNOHL, A., HESSENMOLLER, D., LAW, B.E., CIAIS, P., GRACE, P., 2008. Oldgrowth forests as global carbon sinks. Nature 455: 213-215. [ Links ]
MANHAS, R.K., NEGI, J.D.S., RAJESH KUMAR, CHAUHAN, P.S., 2006. Temporal assessment of growing stock, biomass and carbon stock of Indian forests. Climate Change 74(1-3): 191-221. [ Links ]
NABUURS, G.J., MASERA, O., ANDRASKO, K., BENITEZ-PONCE, P., BOER, R., DUTSCHKE, M., ELSIDDIG, E., FORD-ROBERTSON, J., FRUMHOFF, P., KARJALAINEN, T., 2007. In Climate Change 2007: Mitigation. Contribution of Working group III to the Fourth Assessment Report of the Intergovernmental Panel on Climate Change, Metz, B.; Davidson, O.R.; Bosch, P.R.; Dave, R. and Meyer, L.A. (Eds.), Cambridge Univ. Press, Cambridge, pp 541–584. [ Links ]
PRENTICE, I.C., CRAMER, W., HARRISON, S.P., LEEMANS, R., MONSREUD, R.A., SOLOMON, A.M., 1992. A global biome model based on plant physiology and dominance, soil properties, and climate. J. of Biogeography 19: 117-134. [ Links ]
RAMACHANDRAN, A., JAYAKUAMR, S., MOHAMED-HAROON, A.R., BHASKARAN, A., 2007. Carbon management in forest floor – An agenda of 21st century in Indian forestry scenario. Indian forester 133(1): 25-40. [ Links ]
RAVINDRANATH, N.H., SOMASHEKHAR, B.S., GADGIL, M., 1997. Carbon flows in Indian forests. Climate Change 35: 297–320. [ Links ]
RICHARDS, J.F., FLINT, E.P., 1994. Historic land use and carbon estimates for South and Southeast Asia 1880–1980. ORNL/CDIAC-61, NDP-046, Oak Ridge National Laboratory, Tennessee, USA. [ Links ]
TIWARI, A.K., SINGH, J.S., 1987. Analysis of forest land use and vegetation in a part of Central Himalaya using aerial photographs. Environ Conser. 14: 233-244. [ Links ]
WARRAN, A., PATWARDHAN, A., 2008. Carbon Sequestration Potential of Trees in and around Pune City. Retrieved from www.ranwa.org on 17th July, 2009. [ Links ]
Entregue para publicação em Outubro de 2010
Aceite para publicação em Fevereiro de 2011
