


Serviços Personalizados
Journal
Artigo
 Inglês (pdf)
 Artigo em XML
 Referências do artigo
 Enviar este artigo por email
Indicadores
-
 Citado por SciELO
 -
 Acessos
Links relacionados
-
 Similares em
SciELO
Similares em
SciELO
Compartilhar

 Permalink
Finisterra - Revista Portuguesa de Geografia
versão impressa ISSN 0430-5027
Finisterra no.98 Lisboa dez. 2014
ARTIGO ORIGINAL
Environmental conditions and childhood asthma in Lisbon. An exploratory analysis for autumn thunderstorms
Condições ambientais e asma infantil em lisboa. Análise exploratória em dias de trovoada no outono.
Paulo Canário1 Marcelo Fragoso2 Carla Mora3 Helena Nogueira4
1 PhD student, researcher at CEG - IGOT – UL, research Group ZePHyrUs – alterações Climáticas e sistemas ambientais. Edifício da Faculdade de Letras, Alameda da Universidade, 1600-214 Lisboa, Portugal. E-mail: pmscanario@gmail.com
2 Assistant Professor, researcher at CEG - IGOT – UL, research Group ZePHyrUs – alterações Climáticas e sistemas ambientais. Edifício da Faculdade de Letras, Alameda da Universidade, 1600-214 Lisboa, Portugal. E-mail: mfragoso@campus.ul.pt
3 Invited assistant Professor, researcher at CEG - IGOT – UL, research Group ZePHyrUs – alterações Climáticas e sistemas ambientais. Edifício da Faculdade de Letras, Alameda da Universidade, 1600-214 Lisboa, Portugal. E-mail: carlamora@campus.ul.pt
4Assistant Professor, researcher at CIAS – UC, research Group CIAS - research Centre for Anthropology and Health. Faculdade de Ciências e tecnologia, Universidade de Coimbra apartado 3046 3001-401 Coimbra. E-mail: helenamarquesnogueira@gmail.com
ABSTRACT
Asthma attacks triggered by thunderstorms have been described in several countries. The rises in pollen concentrations, attributed to atmospheric electrical discharges, were considered the leading cause of these outbreaks. The presence of various pollutants as well as certain weather conditions may contribute synergistically to the onset of exacerbations in patients with a previous diagnosis of asthma. This study aims to investigate whether atmospheric electrical discharges exert any influence on the number of emergency admissions due to childhood asthma, in autumn, in Lisbon. The investigation will examine whether there are isolated or combined effects of meteorological variables, pollutant and pollen concentrations that favour an increase in the number of exacerbations of asthma symptoms. For this purpose we compared the number of asthma admissions in periods with and without thunderstorms in a Lisbon paediatric emergency service. Increasing pollen concentrations attributed to thunderstorms reported in the literature were not found in Lisbon in the days analysed. There was also an absence of relationship between admissions for asthma and air pollution. Associations between hospitalisations due to asthma crisis and atmospheric variables were documented. In Lisbon, no influence of atmospheric electrical discharges in the variation of the number of emergency admissions due to childhood asthma was verified in the studied period (autumn). On the contrary, it was verified that a decrease in minimum temperature positively reinforces these admissions.
Keywords: Asthma, thunderstorms, atmospheric electrical discharges, minimum temperature, Lisbon
RESUMO
Crises de asma desencadeadas por trovoadas têm sido descritas em vários países, como consequência do aumento das concentra ções de pólenes. Vários poluentes e certas condições meteorológicas podem contribuir sinergicamente para a agudização dos sintomas em indivíduos com asma. Investiga-se se as descargas eléctricas atmosféricas (DEA) aumentam as admiss ões hospitalares à urgência infantil, no Outono, em Lisboa. Analisaram-se as entradas numa urgência pediátrica em Lisboa, comparando o número de admissões por asma em períodos com e sem trovoadas. O aumento das concentrações de pólenes no ar, atribuído às trovoadas não se verificou, em Lisboa, no período analisado. Confirmou-se também a ausência de rela ção entre admissões por asma e poluentes e documentaram-se associações entre aquelas e as variáveis atmosfé ricas. Não se observou associação entre descargas eléctricas atmosféricas e admissões ao serviço de Urgê ncia pediátrico por asma. No entanto, verificou-se que a diminuição da temperatura mínima provocou o aumento de admissões hospitalares por asma no período estudado.
Palavras-chave: Asma, trovoadas, descargas eléctricas atmosfé ricas, temperatura mínima, Lisboa.
RÉSUMÉ
Conditions atmosphériques et asthme infantile à Lisbonne: une analyse pr éliminaire portant sur les jours orageux. On a décrit en divers pays une augmentation des crises d’asthme pendant les jours d’orage, surtout à cause d’un accroissement des concentrations en pollens, liées aux décharges électriques. Mais d’autres causes peuvent être la présence de divers polluants dans l’air ou encore certaines situations météorologiques. On a comparé le nombre de décharges électriques au nombre d’admissions en urgence infantile causées par l’asthme, pendant un automne à Lisbonne. On n’a pas observé d’augmentation de la concentration de l’air en pollens, attribuée aux orages dans la bibliographie pendant cette période, ni de rapport entre les admissions pour asthme et la concentration en polluants ou la fréquence de décharges électriques. Il semble, par contre, que la baisse de la température minimale provoque une augmentation de ces admissions.
Mots-clés: Asthme, orage, décharges électriques atmosphériques, température minimale, Lisbonne.
I. INTRODUCTION
As part of the “RAIDEN” project, financed by FCT, the Portuguese foundation for science and technology, research was conducted on the spatial and temporal variability of thunderstorms over mainland Portugal based on the first seven years (2003-2009) of atmospheric electric discharge (AED) records, provided by the AED detection network setup by Instituto Português do Mar e da Atmosfera (IPMA). For more on these records please see Santos et al. (2012), Sousa et al. (2013) and Correia (2013). As part of the aforementioned project, Professor Henrique Andrade, in collaboration with physicians of Dona Estefânia Hospital in Lisbon, initiated a study on the possible links between thunderstorms and the increase in the number of asthma attacks in children living in Lisbon.
The increase in number of asthma attacks linked to thunderstorms has been reported around the world. The first studies were made in the beginning of the 1980s in the UK (D’amato, 2012; Anderson, 2001). Other countries to report surges in the number of asthma attacks linked to the occurrence of thunderstorms are Australia (Bellomo, 1992; Girgis, 2000; Marks, 2001), the USA (Grundstein, 2008), Canada (Villeneuve, 2005) and Italy (D’Amato, 2005; Losappio, 2011). Several mechanisms were put forward as the triggers of asthma crisis, the most widely accepted being an increase in the concentrations of airborne pollen during and immediately after the occurrence of thunderstorms (Marks, 2007). The increase in pollen concentrations is due to the rupture of pollen grains through osmotic shock, which occurs during thunderstorms on the smaller sized particles that, when inhaled, reach the lower air passages thus increasing the allergic reaction (Suphioglu, 1992; Vaidyanathan, 2006; Taylor, 2007; Grudstein, 2009). Other factors can work in synergy to increase asthma attacks during thunderstorms, for example the increase in pollutants such as ozone, nitrogen oxides and particulate matter (PM) (Fauroux, 2000; Johnston, 2006; Ruffoni, 2013). Alcoforado (1991) found a link between increases in the occurrence of asthma attacks and clear, calm anticyclone conditions in the city of Lisbon during spring.
the records for thunderstorms in Portugal show a relatively low frequency of these events, even for the country’s centre, interior and southern regions where the occurrence is higher, with a yearly average AED for 2003-2009 of 15 days to 20 days with registered electrical activity. In the Lisbon area the average was of 10 days a year.
Autumn and more specifically the September-November trimester is the time of year with the highest occurrence of AED in mainland Portugal (Correia, 2013). The month of September registers the highest number of incidences with an average of 23.5% of the yearly total of days with thunderstorms. During this season the average density of AED are nevertheless lower than during the summer, especially in the interior regions of Portugal. As for the spatial distribution, AED are more frequent in the centre, interior and south of Portugal. During both autumn and the spring-summer seasons, there is a well-defined daily cycle in the temporal distribution of AED, which occur more frequently during the afternoon, with peaks between 4p.m. and 5p.m.
II. AIM
The aim of this study is to investigate whether thunderstorms, namely, the records of atmospheric electric discharges, exert any influence on the number of asthma admissions to the paediatric emergencies (in autumn, in Lisbon). In parallel, the study aims at understanding which atmospheric variables are associated with the increase of paediatric asthma admissions. Lastly, it is also important to identify the environmental conditions (isolated or a combination of meteorological, pollutant and pollen concentration effects) that are consistent with asthma symptoms.
III. METHODS AND DATA
1. Atmospheric Electric Discharge Data
AED are one of the most important manifestations in the development cycle of vertically developed clouds, such as Cumulonimbus or Cumulus congestus, which occur during unstable atmospheric conditions known as thunderstorms. In 2002 IPMA installed and has since maintained a network for the detection of AED in mainland Portugal, made-up of four sensors that capture two types of AED, intra-cloud and cloud-ground.
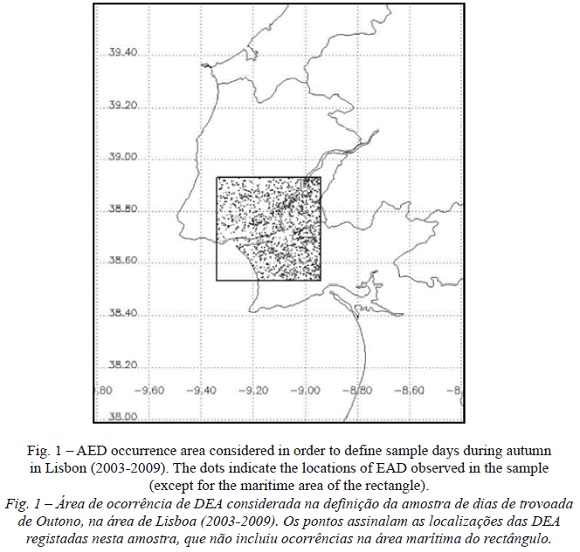
In order to build a sample of thunderstorm days in autumn in the Lisbon area, data from the period of 2003-2009 were made available by IPMA through the RAIDEN project collaboration protocol. As stated above, the information was obtained from the detection network implemented over mainland Portugal, through sensors that function combining two detection methods (known as Df, Direction finders and TOA, time of arrival), which are efficient and precise at capturing the electromagnetic signal produced by the AED. In this study, only the cloud-ground AED were considered since the intra-cloud discharges do not have a significant impact on atmospheric conditions that might influence allergenic symptoms. In this manner, the sample for “ thunderstorm days in the Lisbon area” during autumn (2003-2009), are days where AED cloud-ground were registered within a quadrangular sector (fig. 1) with around 40 km each side, centred about the Dona Estefânia Hospital. Despite the lack of control over whether patients arriving at that hospital with asthma symptoms are doing so from within the defined area, the defined spatial limits (fig. 1) allow for the hypothesis that the Hospital’s admissions for asthmatic patients are related to the thunderstorms (AED) detected within the area. The parameters considered for the AED were the total amount of discharges within the area of study. Other parameters, such as polarity, current intensity or multiplicity, were not considered relevant.
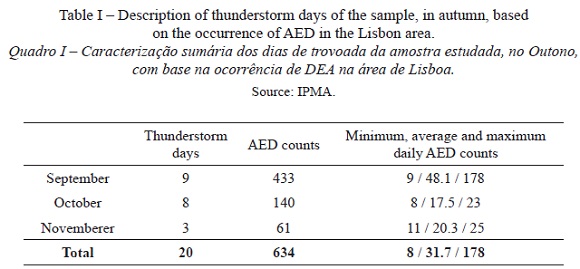
The sample contained a total of 20 days with registered thunderstorms between the 1st of September and the 15th of November, a period that is considered to be representative of the warmest phase in autumn. Table I presents a general description of the atmospheric electric discharge during those 20 days. Out of the sample total, 45% of days with registered thunderstorms occurred in September and were characterised by the severity of the storms with a higher number of registered AED – 433 – making up a total of 68% of all the registered AED. Of note is a single day (9th of September 2009) with an exceptionally high number of AED (178), an extreme event in the context of atmospheric electric discharges in the Lisbon area for the period of 2003-2009 (Carraça et al., 2012). In October and November the days with registered thunderstorms had similar numbers of daily AED, with a daily maximum of 23 and 25 AED.
In addition to this sample, a control sample was created made-up of a random selection of 40 days without registered AED, during the same time-period in autumn and for the same region.
2. Meteorological variables
The meteorological data were obtained from the national Climatic Data Center (NCDC). Values of temperature, humidity, precipitation, wind, cloud cover and atmospheric pressure for the Gago Coutinho weather station in Lisbon were used. this station (located within the Dona Estefânia Hospital’s area of influence) is not influenced by terrain or urban construction, as it is situated next to the airport, which is why it is used as a reference station representative of regional climate (Andrade, 2003; Alcoforado e Andrade, 2006).
3. Air quality
When thunderstorms occur, electrical discharges can increase pollen concentrations and can also contribute towards the production of nitrogen oxides, and thus towards an increase in ozone concentrations (Dales et al., 2003; Grundstein and Sarnat 2009; Ruffoni et al., 2013). The increase in pollutant concentrations and the fragmentation of airborne particles, making them more easily inhaled, are phenomena that can contribute to increase the number of asthma attacks (Burch and Levetin, 2002; Moreira et al, 2008; D’amato, Cecchi and Annesi-Maesano, 2012).
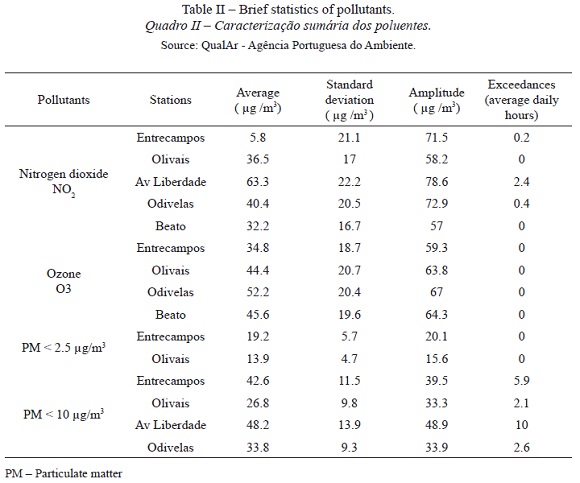
The concentrations of nitrogen dioxide (nO2), ozone (O3), PM less than 2.5 µg/m3 and PM less than 10 µg/m3 were analysed for the 40 days of the control sample and the sample’s 20 days. Hourly data from the stations closest to the Dona Estefânia Hospital in Avenida da Liberdade, Beato, Olivais, Odivelas and Entrecampos (Qualar – Portuguese environmental agency - table II), were analysed.
Air quality was determined by both the time-limits of pollutant concentration set by decree-law no. 102/2010, of the 23 rd of September, and by two levels: alert levels (level above which a short period of exposure represents risk to human health and immediate measures must be adopted) and information levels (level above which a short period of exposure represents risk to human health for that part of the population that is particularly sensitive and above which the need for immediate public advice in needed).
Values of PM 2.5 and PM 10 greater than 50 µg/m 3 were considered above the limit for Human Health safety (Decree-law no. 102/2010); values lower than 30 µg/m3 are considered to be good air quality levels and values between 30 and 50 are considered medium air quality levels.
Hourly mean nitrogen dioxide levels were fixed between 120 µ g/m3 and 100 µg /m3 as the upper and lower limits, respectively. As for ozone concentrations, values should not be above 180 µ g /m3 for the information level, or above 240 ug/m3 for the alert level, also for a reference period of 1 hour.
For the analysed period, ozone concentrations were below the above-referenced levels.
As for nO2, there were several days where the upper limits were exceeded. This gas is a product of the oxidisation of NO, which is originated by vehicle emissions, making it a good indicator for the amount of traffic. The Avenida da Liberdade weather station illustrates this point as it is the station closest to an area of high traffic intensity and was the station that registered the highest nO2 concentrations (table II). The Entrecampos weather station registered similar values, however Olivais station values did not pass the legal limits and Beato station only exceeded these limits during a two-hour period. The latter two stations are located farthest from the main road arteries and essentially reflect the regional signal.
Critical values were registered during two days in Entrecampos (during 2 hours on 12/9/2007 and 1 hour on 19/9/2007) and during a 7 day period in Avenida da Liberdade (between 1 to 13 hours, daily). The month of September 2007 registered the highest number of days above the critical values, which were also the warmest days in the sample.
Only two weather stations (Entrecampos and Olivais) had data for the smaller dimension PM (<2,5 µg/m3), and never registered values above the legal limit of 50 µg/m3 (table II). Moderate quality data were registered for 8 hours in Entrecampos and during 6 hours in Olivais, with both stations registering the highest values for the same five days.
PM 10 µg/m3 values were registered in 4 of the chosen stations, with Avenida da Liberdade station showing the highest values (16 days), followed by Entrecampos (15 days), Olivais (10 days) and Odivelas (7 days). During the warmest days in 2007 (19/9, 20/9, 21/9 and 16/10) values were above critical levels during 24 hours in Avenida da Liberdade.
4. Emergency admission records
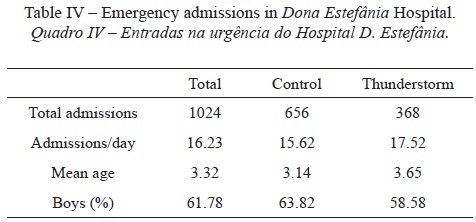
During the 60 days analysed, clinicians consulted 14,464 children resulting in the same number of admissions in the hospital’s emergency, and 1023 were asthma admissions (table IV). From each of the patient’s admission charts information relating to time of admission, date of admission, age, sex and patient postal code were collected.
5. Pollen information
Pollen-concentration data were obtained from the Portuguese network of aerobiology (http://www.rpaerobiologia.com/). Data were retrieved for the analysed days and for the five days preceding and succeeding those dates. The predominant pollens were from the Parietaria and Chenopodium grain types, registering values that were, on average, higher during the control days than the days with thunderstorms.
6. Statistical analysis
An initial comparison between numbers of admission in both samples (thunderstorm and control) was made using an analysis of variance ANOVA. In all analyses the total daily number of asthma cases was considered, as well as the percentage of asthma cases relative to the total number of admissions. Spearman correlation matrices were made for all the variables that were retrieved and considered important in the consulted literature.
A regression analysis was made with the aim of establishing a link between the pollen counts, meteorological variables and air quality and the amount of patients arriving at the paediatric emergency for the sample days. The pollen counts used for this study were for those with the highest concentrations: Chenopodium, Parietaria, Poaceae, Cupressaceae and the total value of all species present. Both the daily concentrations and the previous days mean average concentration (up to five days) were analysed. Different meteorological variables were accounted for: maximum, minimum and average temperature; wind speed direction, average speed and maximum wind gust, relative humidity, pressure, precipitation and cloud cover. Also used were values of maximum (MaxTan), minimum (MinTan) and average temperature anomaly (calculated as a function of a normal reference monthly value for each of the mentioned temperatures). The air quality values used were the average concentration and the number of hours that concentration values were above critical levels for the pollutants referenced in table III. Discriminant analysis was used in order to classify groups of days by the various variables, in the variety of contexts analysed. This analysis was considered to be a simple and robust tool that adequately interprets the differences between two groups, as it allows for the investigation of the differences between two samples of different days according to the same set of independent variables (Hand, 2006). The tool allows for an easy treatment of qualitative variables (such as wind direction) necessary for the analysis. This statistical approach also has the advantage of providing a predictive analysis and of allowing for the definition of a single or a set of variables that allows for the prediction of the number of arrivals at the paediatric emergency services.
In the analysis presented, values were considered to be statistically significant if they had a p value that was less than 0.05. The software used for statistical analyses were SPSS (version 17.0), sas (version 9.00), XLstat and Statistica (version 7).
IV. RESULTS
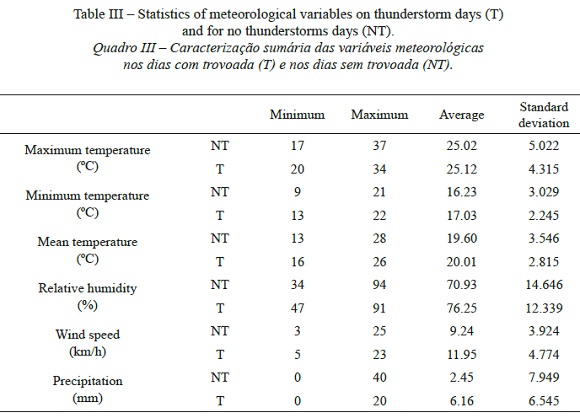
The forty days of the control sample were analysed and compared to the thunderstorm sample of twenty days. This comparison showed that the days with the highest absolute values for maximum and average temperatures occurred in the control sample and that, on average, days with thunderstorms were slightly warmer when comparing maximum, minimum and average temperatures (table III). Wind speed was higher for days with thunderstorms and precipitation values were, on average, also higher. Only 17% of the control sample days registered precipitation values, whereas 80% of thunderstorms days registered precipitation (precipitation days were defined as days with precipitation values over 0.1mm). Relative humidity was also on average higher for thunderstorm days than for the control sample.
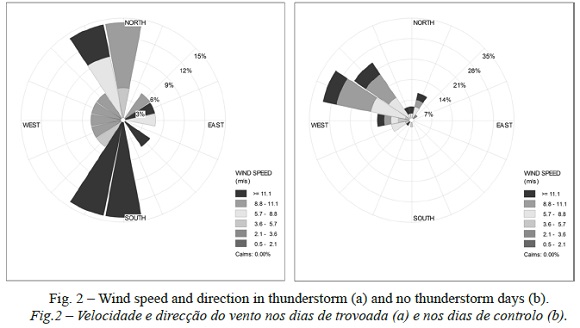
Wind values had significantly different characteristics in both samples, both in speed and direction. During thunderstorm days, wind speed was substantially higher than for the control sample (fig. 2). The wind direction on thunderstorm days presented a different pattern from the control sample. On days with thunderstorms the wind blew mostly from north and south, whereas on control days the wind direction was mainly from WNW and NW (fig. 2).
As for the admissions to the paediatric emergency, the average number of admissions on days with thunderstorms was slightly higher than those for days in the control sample (table IV).
The correlation matrices computed for the different variables gave clues on how to proceed with the analysis. Table V only presents the statistically significant spearman correlation coefficients computed between all the considered variables and the emergency admission variables (percentage and number of asthma cases).
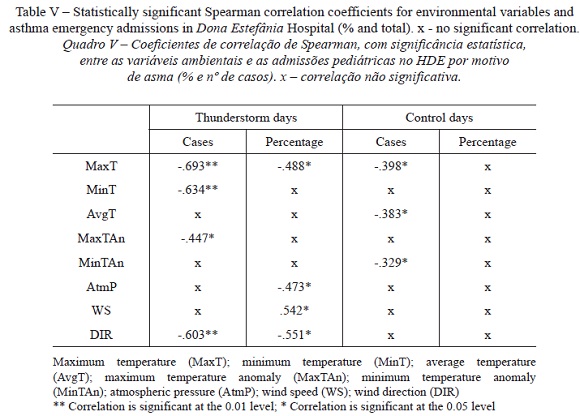
The analysis presented in table V reveals that the level of significance of the pairing varies when considering the percentage or the number of asthma cases.
The analysis shows that pollen concentrations do not increase as a function of electric discharges, and that the concentration values were much lower than the critical levels established in the aforementioned references, making them clinically irrelevant. Rapijeko (2007) found that few patients previously established as sensitive to pollen grains reacted to pollen concentrations of 20 grains/m3, showing only adverse reactions when concentrations reached 50 grains/m3. Pollen levels of 35 grains/m3 (Brito et al., 2010) and of 50 grains/m3 (Kiotseridis, 2013) were described in Spain and Sweden, respectively. In Lisbon, during the thunderstorm sample days, the maximum values of pollen concentrations were 6.48 grains/m3 for the Chenopodium grains, of 2.70 grains/m3 for the Cupressaceae grains and 4.32 grains/m3 for the Parietaria grains. The low pollen concentrations, and therefore clinically irrelevant values measured during the sample days determined that these variables were of no influence on asthma patient admissions.
The possible link between the number of daily electric discharges and the number of daily admissions to the Paediatric emergency (both as percentage of cases and number of cases) was explored, and no statistically significant correlations were found between these variables.
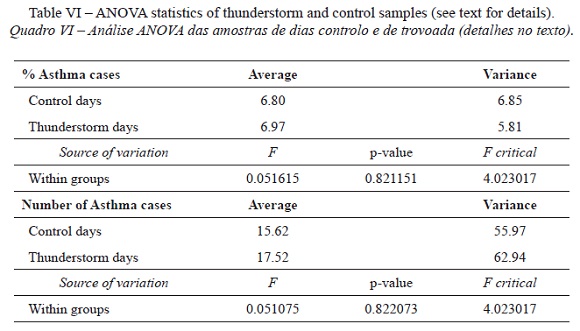
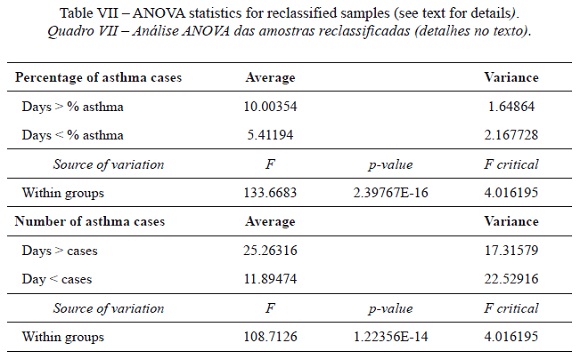
Given the number of asthma admissions, the analysis of the two samples using analysis of variance (ANOVA) showed an absence of statistically significant differences between the two samples (table VI), which was verified for both percentage of emergency asthma cases and number of emergency asthma patient cases. Given that there was no statistically significant difference between the two samples, combined with the low pollen concentration values, the decision was made to reclassify all the sample days. In this manner, two new samples were created, the first with 19 days, representing 1/3 of the days with the highest number of asthma admissions, and a second containing the remaining 38 days. The analysis of variance (ANOVA) was performed on the two new samples, which were found to be statistically different (table VII).
There was now a need to establish the relationship between the meteorological and air quality variables and asthma admissions in the two new samples. In order to address this, several discriminant analyses were conducted in order to identify the factor, or set of factors, that determined the classification of the days in each of the samples (table VIII and table IX).
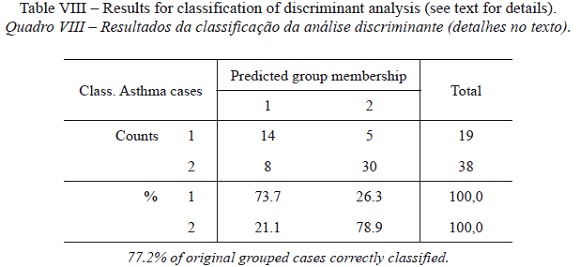
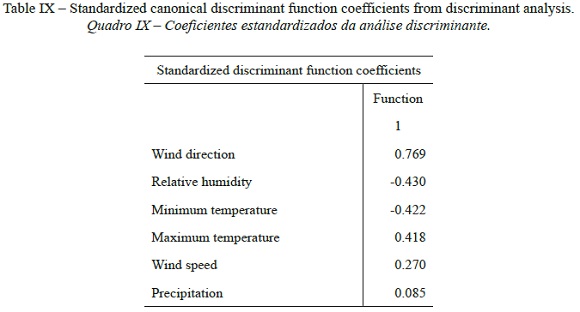
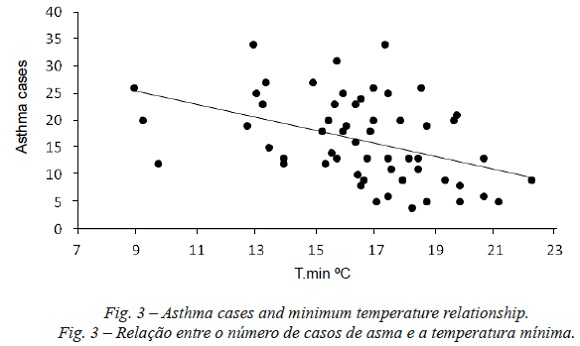
A little over 77% of the sample days were well classified by the variables listed above (when considering the number of daily cases). The days with the highest number of emergency asthma admissions were characterised by lower minimum temperature values (fig. 3), higher maximum temperatures, lower relative humidity and greater wind speed. The wind direction was a relatively important factor in the classification of the variables, whereas atmospheric pressure and precipitation were less important.
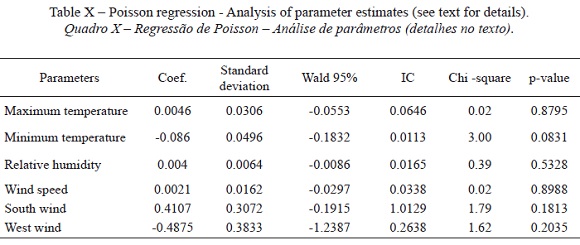
Poisson regression analysis served to model and examine the effects of the variables on emergency asthma admissions. Several regression models were built with different meteorological and air quality variables in order to determine the model capable of explaining the most (the variables used were the same as those used for the discriminant analysis). The Poisson regression confirmed the relative importance of minimum (maximum) temperatures and its inverse (direct) relationship with the increase in asthma cases (table X). Furthermore, it was verified that the increase in asthma admissions was higher by winds blowing from the south and West.
V. DISCUSSION AND CONCLUSIONS
This study found no relationship between the occurrence of thunderstorms and emergency paediatric asthma admissions in Lisbon during autumn. Despite the fact that, on average, days with thunderstorms showed a higher number of emergency asthma admissions, no statistical evidence was found to link the two phenomena. In the same manner, no statistical evidence was found linking the number of daily electric discharges with the number of asthma emergency admissions. The increase in airborne pollen concentrations that several authors have associated with the occurrence of thunderstorms did not occur in Lisbon during the time of the study. The smallness of the sample of days with thunderstorms could have been a contributing factor. On the other hand, it is possible that air flux dynamics, described as causing an increase in the number of asthma cases, might not have occurred, or if they did, they might not have affected the risk population (Taylor et al., 2004; Nasser, Pulimood, 2009; D’amato et al., 2012). Autumn was chosen for the analysis as the period of the year with the highest number of AED in Portugal, together with the fact that, as it is not the period with the highest pollen concentration (concentrations are low and stable), it would allow for an easy identification of any peaks that could more easily be associated with the occurrence of thunderstorms. It is possible, however, that the relationship might occur for months with higher pollen concentrations in Lisbon, such as the months of April and May (Caeiro et al., 2007).
The absence of a relationship between asthma admission and the pollutants is due to the relatively low concentration values and the relatively low number of days where the risk levels were exceeded, despite the relationships previously established when concentration values were below the risk levels determined by law (Fauroux, 2000).
The inversely proportional relationship between hospital admissions and minimum temperatures and the directly proportional relationship between hospital admissions and maximum temperatures was established using discriminant analysis, and confirmed by the Poisson regression, albeit with low statistically significant values (with the maximum temperatures established as less significant). However, there was no statistical relationship between the daily temperature range for the sampled days and asthma admissions, contrary to what was established during spring in Lisbon (Alcoforado, 1991) where days with a large range in temperature were associated to an increase in the number of asthma cases. The relationships here established only demonstrate the relative importance of the coldest and warmest days. The inversely proportional relationship with minimum temperatures confirms the conclusions also reached in other studies (Rossi, 1993; Hervás, 2013), although other authors have shown the existence of directly proportional relationships (Hashimoto, 2004; Mireku et al., 2009) such as the one found here. In all the analyses performed, the wind speed variable is directly proportional to the number of asthma attacks (despite having a low importance). As for wind direction, Poisson regression analysis found opposite signs for the different directions considered. The importance of wind direction is a matter deserving a more in depth analysis, where a larger sample of consecutive days registering higher pollen counts (spring) should be considered. The relationship between the asthma attack variables and humidity was contradictory for the two analyses performed, which did not allow for a conclusion.
As a final note: this study did not find that atmospheric electric discharges had any influence on the number of paediatric emergency asthma admissions. At the same time, no influence between AED and the increase in pollen concentrations was found for Lisbon. These results might be due to the fact that the period of thunderstorms occurrences analysed was autumn when pollen concentrations are low, due to the limited number of sample days and due to the type of analysis performed. a drop in the minimum temperature does seem to increase the amount of asthma emergencies.
ACKNOWLEDGEMENTS
The study presented here is the result of an initiative brought about by Professor Henrique Andrade who pioneered this theme in Portugal, which has interested a diversity of specialists, mainly in europe and north America. With the aim of continuing his research, the team he collaborated with at the time of his death, presents this paper as the first results of an ongoing research. The authors would like to thank the imuno-allergic services of the Dona Estefânia Hospital for all the support and availability throughout this first phase of the research. We also thank the anonymous reviewers for all comments and suggestions that helped improve this work.
The research was undertaken within the project “Lightning activity in Portugal: variability patterns and socioeconomic impacts (RAIDEN)”, funded by Fundação para a Ciência e a tecnologia (FCT), under the contract number PTDC/CTE-ATM/101931/2008.
BIBLIOGRAPHY
Alcoforado MJ, Andrade H (2006) Nocturnal urban heat island in Lisbon (Portugal): main features and modelling attempts. Theor Appl Climatol, 84: 151-159. [ Links ]
Alcoforado MJ (1991) Influência do tempo no desencadeamento de crises de dispneia em doentes respiratórios. Finisterra - Revista Portuguesa de Geografia, XXVI (51): 105-115. [ Links ]
Anderson W, Prescott GJ, Packham S, Mullins J, Brookes M, Seaton A (2001) Asthma admissions and thunderstorms: a study of pollen, fungal spores, rainfall and ozone. Q J Med; 94: 429-433. [ Links ]
Andrade H (2003) Bioclima humano e temperatura do ar em Lisboa. PhD Thesis. University of Lisbon, 435 p. [ Links ]
Bellomo R, Gigliotti P, Treloar A, Holmes P, Suphioglu C, Singh MB, Knox B (1992) Two consecutive thunderstorm associated epidemic of asthma in Melbourne. Med J Australia, 156: 834-837. [ Links ]
Brito FF, Gimeno PM, Carnés J, Fernández-Caldas E, Lara P, Alonso AM, García R, Guerra F (2010). Grass Pollen, Aeroallergens, and Clinical Symptoms in Ciudad Real, Spain. J Investig Allergol Clin Immunol., 20(4): 295-302. [ Links ]
Burch M. and Levetin E (2002) Effects of meteorological conditions on spore plumes. Int J Biometeorol 46: 107-117.
Caeiro E, Brandão R, Carmo S, Lopes L, Almeida MM, Gaspar A, Oliveira JF, Todo-Bom A, Leitão T, Nunes C (2007) Rede Portuguesa de Aerobiologia: Resultados da monitorização do pólen atmosférico (2002-2006). Rev Port Imunoalergologia; 15(3): 235-250. [ Links ]
Carraça MGD, Fragoso M, Alcoforado MJ, Lopes A, Mora C, Correia S, Andrade H (2012) Effects of surface features on thunderstorm activity – a preliminary study for Lisbon region, Conference Proceedings of the ICUC8-8th International Conference on Urban Climates, 6th-10th August 2012, UCD, Dublin (Ireland). [ Links ]
Correia S (2013) Análise de padrões temporais e espaciais de descargas elétricas atmosféricas em Portugal Continental. Centro de Estudos Geográficos, Núcleo Clima e Mudanças Ambientais, 5, 124pp. [ Links ]
Dales RE, Cakmak S, Judek S, Dann T, Coates F, Brook JR, Burnett RT (2003) The role of fungal spores in thunderstorm asthma. Chest, 123: 745-750. [ Links ]
D’ Amato G, Liccardi G, Silvana JG, Viegi BG (2005) Thunderstorm-associated asthma in pollinosis patients. http://www.bmj.com/rapid-response/2011/10/30/thunderstorm-associated-asthma-pollinosis-patients [ Links ]
D’Amato G, Cecchi L, Annesi-Maesano I (2012) A trans-disciplinary overview of case reports of thunderstorm-related asthma outbreaks and relapse. Eur Respir Rev., 21(124): 82-87. [ Links ]
Fauroux B, Sampil M, Quénel P, Lemoullec Y (2000) Ozone: A Trigger for Hospital Pediatric Asthma Emergency Room Visits. Pediatr Pulm 30: 41-46. [ Links ]
Girgis ST, Marks GB, Downs SH, Kolbe A, Car GN, Paton R (2000) Thunderstorm-associated asthma in an inland town in southeastern Australia. Who is at risk? Eur Respir J., 16: 3-8. [ Links ]
Grundstein A, Sarnat SE, Klein M, Shepherd M, Naeher L, Mote T, Tolbert P (2008) Thunderstorm associated asthma in Atlanta, Georgia. Thorax 63: 659-660. [ Links ]
Grundstein A, Sarnat SE (2009) Meteorological Mechanisms Explaining Thunderstorm-Related Asthma. Geography Compass 3/1: 45-63. doi: 10.1111/j.1749-8198.2008.00195.x [ Links ]
Hand DJ ( 2006) Classifier technology and the illusion of progress. Stat Sci 21(1): 1-15. [ Links ]
Hashimoto M, Fukuda T, Shimizu T, Watanabe S, Watanuki S, Eto Y, Urashima M (2004) Influence of climate factors on emergency visits for childhood asthma attack. Pediatr Int., 46: 48-52. [ Links ]
Herv ás D, Utrera JF, Hervás-Masip J, Hervás JA, García-Marcos L (2013) Can meteorological factors forecast asthma exacerbation in a pediatric population? Allergol Imuno. http://dx.doi.org/10.1016/j.aller.2013.07.004
Johnston NW, Sears MR (2006) Asthma exacerbations 1: Epidemiology. Thorax 61: 722-728. doi: 10.1136/thx.2005.045161 [ Links ]
Kiotseridis H, Cilio CM, Bjermer L, Tunsäter A, Jacobsson H, Dahl Aslög (2013) Grass pollen allergy in children and adolescentssymptoms, health related quality of life and the value of pollen prognosis. Clin Transl Immunology, 3: 19 http://www.ctajournal.com/content/3/1/19
Losappio L, Heffler E, Contento F, Cannito C, Rolla G (2011) Thunderstorm-related asthma epidemic owing to Olea Europea pollen sensitization. Allergy 66: 1510-1511. [ Links ]
Marks GB, Colquhoun JR, Girgis ST, Koski MH, Hansen P, Downs SH, Car NG (2001) Thunderstorm outflows preceding epidemics of asthma during spring and summer. Thorax 56: 468-471. [ Links ]
Marks GB, Bush RK (2007) It’s blowing in the wind: new insights into thunderstorm-related asthma. J Allergy Clin Immunol 120: 530-532. [ Links ]
Mireku N, Wang Y, Ager J, Reddy RC, Baptist AP (2009) Changes in weather and the effects on pediatric asthma exacerbations. Ann Allergy Asthma Immunol 103: 220-4. [ Links ]
Moreira S, Santos CS, Tente H, Nogueira L, Ferreira F, Neto A (2008) Morbilidade respiratória e exposi ção a partículas inaláveis na cidade de Lisboa. Acta Pediatr Port 0873-9781/08/39-6/223.
Nasser SM, Pulimood TB (2009) Allergens and Thunderstorm Asthma. Curr Allergy Asthm R 9: 384-390. [ Links ]
Rapiejko P, Stanlaewicz W, Szczygielski K, Jurkiewicz D (2007) Threshold pollen count necessary to evoke allergic symptoms. Otolaryngol Pol., LXI(4): 591-594 [ Links ]
Rossi OVJ, Kinnula VL, Tienari J, Huhti E (1993) Association of severe asthma attacks with weather, pollen, and air pollutants. Thorax, 48: 244-248. [ Links ]
Ruffoni S, Passalacqua G, Ricciardolo F, Furgani A, Negrini AC, De Amici M, Ciprandi G(2013) A 10-year survey on asthma exacerbations: Relationships among emergency medicine calls, pollens, weather, and air pollution. Rev Fr Allergol 53: 569-575. [ Links ]
Santos M, Fragoso M (2013) Precipitation variability in Northern Portugal: data homogeneity assessment and trends in extreme daily precipitation indices, Atmos Res, 131: 34-45. [ Links ]
Sousa JF, Fragoso M, Mendes S, Corte-Real J, Santos JA (2013) Statistical-dynamical modeling of the cloud-to-ground lightning activity in Portugal, Atmos Res, 132-133: 46-64. [ Links ]
Suphioglu C, Singh MB, Taylor P, Bellomo R, Holmes P, Puy R, Knox RB (1992) Mechanism of grass-pollen-induced asthma. Lancet, 339: 569-572. [ Links ]
Taylor P E, Haflidi J (2004) Thunderstorm Asthma. Curr Allergy Asthma Rep, 4: 409-413. [ Links ]
Taylor PE, Jacobson KW, House JM, Glovsky MM (2007). Links between pollen, atopy and the asthma epidemic. Int Arch Allergy Immunol, 144: 162-170. [ Links ]
Vaidyanathan V, Miguel AG, Taylor PE, Flagan RC, Glovsky MM (2006) Effects of electric fields on pollen rupture. J Allergy Clin Immunol, 117(2): S157. [ Links ]
Villeneuve PJ, Leech J, Bourque D (2005) Frequency of emergency room visits for childhood asthma in Ottawa, Canada: the role of weather. Int J Biometeorol, 50: 48-56. [ Links ]
Received: May 2014; Accepted: September 2014.

