


Serviços Personalizados
Journal
Artigo
 Inglês (pdf)
 Artigo em XML
 Referências do artigo
 Enviar este artigo por email
Indicadores
-
 Citado por SciELO
 -
 Acessos
Links relacionados
-
 Similares em
SciELO
Similares em
SciELO
Compartilhar

 Permalink
Finisterra - Revista Portuguesa de Geografia
versão impressa ISSN 0430-5027
Finisterra no.98 Lisboa dez. 2014
ARTIGO ORIGINAL
New bioclimatic maps of Lisbon. Spatial modelling of physiological equivalent temperature
Novos mapas bioclimáticos de Lisboa. Modelação da temperatura fisiológica equivalente
Sofia Baltazar1
1Câmara Municipal de Lisboa/serviço Municipal de Protecção Civil. e-mail: sbaltaz@gmail.com
ABSTRACT
Bioclimatic indices provide an evaluation of the effect of climate on thermal sensation and comfort, due to the combined use of various atmospheric parameters. in this context, and bearing in mind the comfort of Lisbon’s population, we have developed a methodology for the preparation of bioclimatic maps and performed the spatial modelling of an index applied to the city of Lisbon − the Physiological Equivalent Temperature (PET ). Using Geographic information systems (GIS), we performed spatial modelling of the various meteorological and physical variables of the territory and computed the value of PET for different extreme weather conditions. The resulting maps will contribute to a better knowledge of the thermal comfort in the city of Lisbon and will provide instruments for bioclimatic characterization, spatial planning and civil protection.
Keywords: Bioclimatic maps, urban climate, thermal comfort, Physiological equivalent temperature, Lisbon (Portugal).
RESUMO
O efeito do clima sobre a sensação, o conforto e o stress térmicos pode avaliar-se com aux ílio de índices bioclimáticos, que combinam vários parâmetros atmosféricos. neste contexto, e na perspectiva do conforto bioclimático da população de Lisboa, foi desenvolvida uma metodologia para a elaboração de mapas bioclimá ticos e efectuada a modelação espacial de um índice aplicado a esta cidade – Physiological Equivalent Temperature ( PET ). Com recurso aos sistemas de informação Geográfica (SIG), procedeu-se à modelação espacial de variá veis meteorológicas e físicas do território e ao cálculo da PET , para condições meteorológicas diferenciadas. Os mapas resultantes contribuem para um melhor conhecimento do conforto térmico na cidade de Lisboa e constituem instrumentos para a sua caracterização bioclimática e apoio a acções de ordenamento e de protecção civil.
Palavras-chave: Mapas bioclimáticos, clima urbano, conforto térmico, Physiological Equivalent Temperature, Lisboa (Portugal).
RÉSUMÉ
Nouvelles cartes bioclimatiques de Lisbonne. Modélisation de la température physiologique equivalente. L’effet du climat sur la sensation, le confort et le stress thermiques peut être évalué à partir d’indices bioclimatiques, qui combinent divers paramètres atmosphériques. On a réalisé, grâce aux systèmes d’information Géographique (SIG), des cartes bioclimatiques de Lisbonne, en utilisant l’indice de température Physiologique équivalente (PET ) et en l’associant à des variables atmosphériques et morphologiques, lors de diverses situations météorologiques. Ces cartes permettent de mieux appré cier le confort thermique à Lisbonne, de mieux caractériser bioclimatiquement la ville et de favoriser ainsi de nouvelles actions de planification et de protection civile.
Mots-clés: Cartes bioclimatiques, climat urbain, confort thermique, Physiological Equivalent Temperature, Lisbonne (Portugal).
I. INTRODUCTION
There is an increasing degradation of climate and of air quality − heating, pollutants, allergens − in urban areas due to the high concentration of population, high density of construction and anthropogenic activities. This fact coupled with climate changes, such as rising temperatures and the frequency and intensity of extreme phenomena (namely heat waves, iPCC, 2012), makes cities particularly vulnerable to weather elements. One of the current concerns is related to the influence of heat stress on the comfort and health of the population in urban areas (Garcia-Herrera et al., 2005; Kováts and Hajat, 2008).
Although Lisbon has already been the object of several climatic and bioclimatic studies (Alcoforado, 1992; Andrade, 2003; Lopes, 2003, 2006 and 2009; Alcoforado and Andrade, 2006; Alcoforado et al., 2006 and 2009a; Vasconcelos and Lopes, 2007; Andrade and Alcoforado, 2008; Andrade et al., 2011), climate information in general, and the climatic comfort in particular, were overlooked in the various instruments of spatial planning, as shown in a systematic analysis of Municipal Plans (PDM), performed by Alcoforado and Vieira (2004). However, some results of the work of Alcoforado et al. (2005) have been included as Climatic Guidelines within the revised PDM of Lisbon. The aim of this work is to present a methodology for the development of the spatial modelling of a bioclimatic index, updating the basic cartography, namely the maps of land use for the city of Lisbon. Using Geographic information systems (Gis) the various meteorological and physical variables were integrated and mapped and the index value was spatially modelled for different weather conditions. The selection of these conditions was based on their severity or frequency. The chosen index – Physiological Equivalent Temperature (PET ) – developed by Höppe, 1999 and Matzarakis et al., 1999, has been widely used by various authors and applied in different types of climate − continental (Germany), Mediterranean (Greece and Portugal), desert (New Mexico, USA), among others (Matzarakis et al., 1999; Andrade, 2003).
The identification, delimitation and characterization of areas of greater thermal comfort, or discomfort, is particularly important for the development of strategies for prevention and action in situations of weather and climate hazards associated with extreme temperatures – in both hot or cold situations.
II. BIOCLIMATIC INDICES
The first indices were relatively simple and limited as they used only meteorological parameters. examples of such indices are the Wind-Chill of Siple and Passel (1945), that takes into account the chilling effect of wind, and the effective temperature of Houghten and Yaglou (1923), determined from the combination of temperature, wind speed and radiant temperature (Parsons, 1993; Andrade, 2003). The latter was subsequently corrected by Vernon and Warner (1932).
The following generation of indices takes into account the physiological responses to climatic conditions (Jauregui, 1997; Höppe, 1999). It was fanger who, in 1970, established one of the first models of energy balance in the human body, subsequently modified by Jendritzky, who included assessment parameters of radiative flux enabling its application to outdoor environments (Jendritzky, 1979, in Höppe, 1997). Other models of the energy balance in the human body and more advanced and dynamic indices have since been developed. These enable the modelling of the thermo-physiological mechanisms of the human body in a given thermal environment (physical activity and defined clothing) and further allow the determination of the energy expenditure associated to the physiological response for the regulation of body temperature (Höppe, 1999; Andrade, 2003). One example of such models is the Munich energy-balance Model for individuals (MeMi), developed by Höppe (Höppe 1984, in Höppe, 1999; Andrade, 2003; Matzarakis and Amelung, 2008).the results are obtained through the quantification of heat flows (between the inside of the body and the skin and between the body and the environment), body temperature and sweating rates (Höppe, 1997; Andrade, 1998, 2003).
The bioclimatic study results are increasingly being taken into account in guidelines and official technical standards of town planning (planning, architecture and engineering). in Germany, in 1996, the Verein Deutscher Ingenieure (VDI, 1996, in Mayer and Matzarakis, 1998) recommended the use of energy balance models in the evaluation of thermal conditions in urban and regional planning.
III. PHYSIOLOGICAL EQUIVALENT TEMPERATURE (PET)
The PET index was developed in 1987 by Mayer and Höppe and modified by Höppe, in 1993. It is based on the MeMi model and expresses the thermophysiological results obtained by that model in air equivalent temperature (Höppe, 1999).
The meteorological parameters used in the calculation of this index are the air temperature (ta) and humidity, wind speed and the Mean radiant temperature (TMRT). PET can be defined as the air temperature of a closed compartment under standard conditions (ta = TMRT; wind speed = 0.1 m/s and vapour pressure = 12 hPa) that requires the same thermo-physiological response as the real environment (Höppe, 1999; Andrade, 1998, 2003; Matzarakis and Amelung, 2008). It assumes as standard a 35 year old male individual, 1.75 m tall and weighing 75 kg. The thermal insulation of clothing and physical activity are taken as constants (respectively 0.9 Clo and 80 W/m2).
Matzarakis and Mayer established a relationship between the scale of comfort of the Predicted Mean Vote (PMV) determined by fanger and PET values for equivalent levels of activity and clothing by setting thresholds to the classes of thermal sensation (table I, Matzarakis et al., 1999). is worth noting that different thermal environments can match equal values of PET – for example, a lower value of ta can be compensated by a higher TMRT.
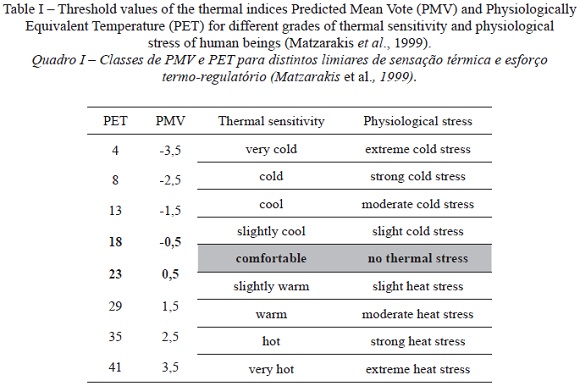
There are some advantages ascribed to PET : it is valid for the Mediterranean climate in all seasons and scales of analysis (Matzarakis et al., 1999; Andrade, 2003); it is expressed in degrees centigrade, which makes it is easy to understand and use in this region (Andrade, 1998; Matzarakis et al., 1999); it maintains constant personal parameters and it is therefore appropriate to spatial and temporal analysis of bioclimatic conditions (Andrade, 2003); it allows predictions or simulations through changes of environmental parameters (Matzarakis et al., 1999; Matzarakis and Amelung, 2008); there are already some studies performed in Lisbon with the application of this index (Andrade, 2003; Andrade and Vieira, 2007; Andrade and Alcoforado, 2008, several papers, this issue).
IV. SPATIAL MODELLING OF PET AND ITS APLICATION TO LISBON
1. Climatic aspects of Lisbon
The city of Lisbon is located on the north bank of the Tagus estuary on the western side of Portugal. Its hilly topography, dominated by the Monsanto hills to the west (with altitudes exceeding 200 m), as well as its urban features, are important to explain Lisbon’s climatic conditions (Alcoforado, 1987). Lisbon has gone through various stages and rates of growth and it currently has a diverse and heterogeneous morphology, with well-marked contrasts in terms of urban and architectural typologies. Hence, buildings and urban typologies of very different ages coexist, showing discontinuities in height, occupation and much diversified functions (Salgueiro, 2001). The city has a Mediterranean climate. There are two very distinct seasons: a hot, dry summer and a rainy winter, with relatively mild temperatures (Alcoforado, 1992). The observed thermal variations in the interior of the city are due to the topographical features and urban morphology. The urban heat island occurs mainly in the south and centre of the city, reaching its highest value during the summer nights. Its average intensity ranges from 2ºC to 3ºC (Lopes et al., 2013; Alcoforado et al., 2014, this issue).
The wind regime – speed and direction − and local weather affect the spatial pattern of the distribution of temperatures in the city. The wind near the surface is dominated by a frequent flow from the north (75% of annual observations, Lopes, 2003; Alcoforado et al., 2009b). a recent study of the relationship between the wind regime and the thermal patterns in the city points towards the occurrence of higher frequencies of heat island with wind speeds between 2 and 6 m/s, because the shelter effect to fluxes from the north/northwest directions also contributes to higher temperatures in the centre (Lopes et al., 2013). The fast urban growth in the northern part of the city can slow down, and even prevent the progression of the prevailing winds to the centre and thus seriously affect the conditions of ventilation and cooling of the city, in addition to contributing negatively to air pollution (Lopes, 2003 and 2011).
The existence of breezes from the ocean and from the Tagus estuary (in circa 30% of summer days) has a very important role in the cooling and ventilation within the city, primarily in the areas along the river. The urban heat island has then a northernmost position, while the riverfront is on average 3.5ºC cooler than the other city areas, although in certain situations these differences may be greater than 10ºC (Alcoforado, 1987, 1992; Lopes, 2003; Vasconcelos, 2006; Vasconcelos and Lopes, 2007; Lopes et al., 2013; Alcoforado et al., 2014, this issue).
2. Methods and Data
2.1. PET modelling basic methodology
The methodology for producing PET maps for Lisbon is essentially based on the investigation of factors that influence PET spatial variation and on its automatic modelling using GIS. Due to the influence of the physical characteristics of the territory on the patterns of climatic variables, particularly in the urban canopy layer, its modelling relied heavily on that information. Figure 1 represents schematically the model of analysis used.
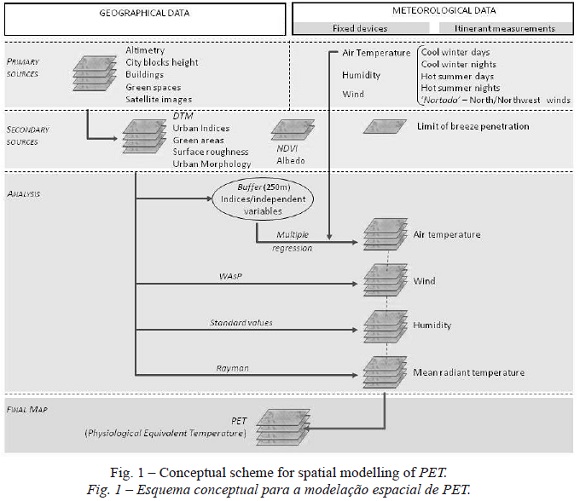
PET was computed using the rayman model by including the following variables: air temperature, water vapour pressure, wind speed and mean radiant temperature. The spatial modelling was performed using a raster format (with a 100x100m grid) for each variable that was subsequently integrated in the calculation of PET. The maps of PET index were thus obtained for Lisbon with representative meteorological conditions pertaining to extreme conditions and to the most frequent situations that occur in the city.
2.2. Metereological data and sample selection
Data gathered at the Gago Coutinho station was used for maps of meteorological variables: wind (direction and speed), humidity (water vapour pressure, Pa) and temperature; these were supplemented with hourly data from mesoscale recording network (tinytag Plus, the Geminy data loggers) of the Centre for Geographical studies (CEG) at the Institute of Geography and Spatial Planning (IGOT), University of Lisbon (described in Alcoforado et al., 2007). The studied period was 2004-2007. additional measurements were made along three distinct observation pathways perpendicular to the river (Belém, Baixa and Olivais) at several measuring points, where wind speed and direction, air temperature and relative humidity were measured to establish the limit of penetration of the breeze into the city (Baltazar, 2010). The values of moisture and TMRT, used to compute PET, were simulated taking into account the different weather conditions and reference values were used for each class of urban morphology, described in Baltazar (2010:40).
The selection of days for the data series was made on the basis of existing studies. Hence, the following extreme/frequent climatic conditions were chosen for the period under review (2004-2007):
a) 818 Hot Summer Days in which maximum daily Ta≥ 32ºC (Nogueira and Paixão, 2005) and 754 Hot Summer Nights in which minimum nocturnal Ta≥ 22ºC;
b) 696 Cold Winter Days and 535 Cold Winter Nights, in which minimum Ta ≤ 11ºC and 7 ºC respectively (Marques, 2007);
c) 704 days of “nortada”: North Wind days that blow in 70% of summer days on the western coast of Portugal and reach a maximum intensity during the afternoon (Alcoforado, 1987; Alcoforado et al., 2006; Lopes et al., 2013). These were chosen due to their frequency.
2.3. Cartographic information (primary and secondary sources)
The basic cartographic information concerning altimetry, buildings, green areas and roads dates back to 2008 and the city ortho-photomaps were obtained through aerial surveys in 2006 (by courtesy of Lisbon Municipality).
Several maps that express and summarise the physical and urban morphology: altimetry, green areas, distance from the river, height of city blocks, building density, normalized Difference Vegetation index (NDVI) and albedo (based on a Landsat 5 image of July 22, 2007), average surface roughness (z0) and homogeneous areas in urban terms (Baltazar, 2010:35-36) were constructed in raster format (primary and secondary sources, fig. 1).these maps integrate the spatial modelling of meteorological variables (ta, wind and TMRT) used in the calculation of PET (Baltazar, 2010).
2.4. Maps of the meteorological variables
For the spatialisation of air temperature (ta), multiple linear regression was used to establish the numerical relationship between the standardisedi Ta (dependent variable) and various geographic parameters of the city (independent variables). The spatial variation of temperature was thus modelled for each one of the five meteorological conditions considered (the ones in fig. 2). The explanatory power of the model was assessed using the coefficient of determination (r 2) and the factors with the strongest correlation were selected. Ta maps were constructed based on the regression equations obtained for each of the meteorological conditions and the data was then extrapolated for the remaining area of the city (Baltazar, 2010:38).
Hourly wind data for each of the meteorological conditions was used in the simulation of the mean wind field in the city. The simulation was performed with the WasP software (Wind atlas analysis and application Program); the results were subsequently corrected for the height of 1.5 m above the ground, using the wind profile potential equation (Deacon, 1949, cited by Linacre, 1992; Lopes et al., 2011). A simulation with south-westerly wind, which is frequently the direction of the breeze, was carried out for summer conditions (hot days and nights) in which riverside areas are under the effect of the Tagus estuary and of sea breezes; a mask of the limit of penetration of the breeze was applied to this map.
Since the data of atmospheric humidity do not have much spatial variability (Andrade, 2003) we applied the same value throughout the city. Nevertheless, the value varied according to the meteorological conditions considered.
TMRT in reference-areas, characteristic of the different urban morphology patterns, was estimated using the rayman software (a prior classification was done based on the type of land use, structure, morphology and height of the building, Baltazar, 2010: 41). This calculation was done using the mean values of ta, wind speed and cloudiness for each weather condition and the height of the buildings, their surface albedo and the Bowen ratioii were taken into account. The final TMRT derives from the average values computed in each area-type of urban morphology (Baltazar, 2010).
V. RESULTS
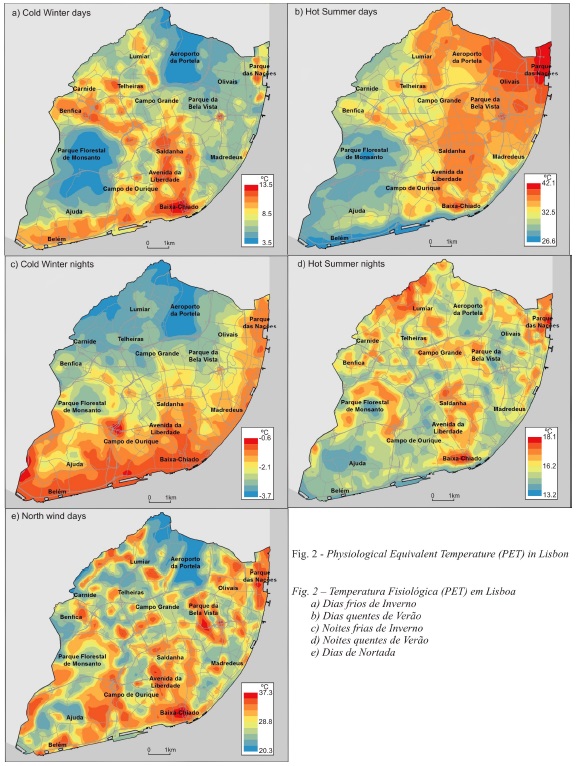
On Cold Winter Days (fig. 2a), PET varies between 3.5ºC and 13.5ºC (table I), that is from moderate cold stress to strong or even extreme cold stress in Monsanto Hill and the airport. Moderate cold stress occurs in the centre and along the main axes of the city, high density areas of Benfica and Parque das Nações and western riverside area (fig. 2a). This is probably due to the release of energy stored in buildings (Lopes, 2003), the retention of radiation in urban canyons through multiple reflections (e.g. larger TMRT) and the decrease of the air flow and /or higher shelter from prevailing north winds. Extreme cold stress occurs in non-urbanised areas of Monsanto Hill and at the airport (fig. 2a). The Monsanto area is colder during daytime due to its dense vegetation and consequently higher evapotranspiration. Likewise, the open areas near the airport with no construction, under strong influence of north and east winds suffer a sharp cooling, resulting in strong and extreme cold stress.
During Cold Winter Nights (fig. 2c), the levels of discomfort are quite pronounced, with PET values always below 0 ºC (fig. 2c), which correspond to extreme cold stress throughout the city (table I). PET is higher (around 0ºC) in areas of greater building density in southern and southwestern Lisbon; these areas are also sheltered from cold north winds. The lowest PET values occur in the non-urbanised and wind exposed northernmost parts of the city, including the airport (PET down to -3.7ºC).
In Hot Summer Days (fig. 2b) there are very large spatial contrasts within the city: PET varies between 26.6ºC and 42.3ºC, that is, from slight heat stress to extreme heat stress. The latter occurs in Baixa (lower part of the city) and in a modern city-district in the NE part of Lisbon (Parque das Nações, near the Tagus). In the other areas of urban expansion (Lumiar, Benfica and Telheiras) moderate and strong thermal stress occurs in these occasions (fig. 2b). The heat stress in densely populated areas is related to poor ventilation and low sky-View factor (SVF). In other words, greater heat retention is due to the dense urban fabric and the height of buildings. It is worth noting the important role that the ocean breezes in summer play in cooling the air (Vasconcelos and Lopes, 2007, Lopes et al., 2011), hence helping to mitigate the thermal discomfort in the western riverside areas of Lisbon, which have lower PET values than the rest of city: PET is here around 26.5ºC, that means slight heat stress (fig. 2b). However, the eastern riverside sector of the city with high values of PET (around 42ºC, i.e. extreme heat stress in Parque das Nações, as referred above) is an exception. The increased roughness brought about by the high building density in recent years has led to a decrease in the average speed of the estuary breezes estimated at about 10.5% by Vasconcelos (2006). This construction barrier conditions and impairs the Tagus estuary breezes ability to penetrate inland, significantly intensifying the summer discomfort in this sector of the city. The highest levels of comfort (slight heat stress, PET between 26 and 28ºC, fig. 2b) in Monsanto confirm the importance of green spaces in tempering the high temperatures (greater evapotranspiration and rapid radiative losses). This is particularly relevant in the wellbeing and health of the population, as the summer is a particularly suitable time of the year for outdoor activities. in the northern sector of the city, places with lower z0 (airport, for example) show high PET values (between 40 and 42 ºC, e.g. strong or extreme heat stress), due to prolonged exposure of these areas to solar radiation (particularly high at this time of year) that causes a large increase in TMRT and ta.
During the Hot Summer Nights (fig. 2d), the spatial contrasts are relatively smaller, PET varies between 13 and 18ºC, that is between slight cold stress and comfortable situations. One would perhaps expect higher values of PET in “hot nights” in Lisbon, but frequently wind decreases PET values in Lisbon.
In situations of strong and persistent north winds, typical of summer (North Wind Days, fig. 2e), the estimated maximum values of PET 37ºC, corresponding to strong heat stress), although high, are slightly lower than those of Hot Summer days, due to the tempering effect of the wind. The differences in PET values are quite high, reaching 17ºC between hotter and cooler city areas. The topographic position (more or less sheltered) in relation to the prevailing north (or northwest) winds affects spatial variations of PET The highest and more exposed places − the top of Monsanto, the airport and some still open areas north of the city show no thermal stress (values of PET , around 20ºC). Conversely, the densely built areas in valleys and in lower or sheltered positions (e.g. The central area of the city) experience strong heat stress caused by poor conditions of ventilation (wind speed <1m / s) and overheating of the air due to the high radiative temperature in built-up areas. The occurrence of strong and persistent northerly winds cancel out the breezes along the riverside areas (often the wind regime changes, in the same day, from a situation with predominance of morning and early afternoon breeze to a situation of evening north wind (Alcoforado, 1992). according to Vasconcelos (2006), 50% of breezes occur only when the regional wind speed is lower than 3 m/s. in the eastern sector of the city, for example, higher values of PET are then, as opposed to Hot Summer Days, limited to smaller areas close to the Tagus estuary (fig. 2e).
VI. CONCLUSIONS
The main bioclimatic differences registered in Lisbon are determined by the geometry and urban morphology (SVF range), the presence or absence of green areas (variations of the Bowen ratio), type of materials used (greater or lesser capacity for heat storage), that influence the conditions of ventilation and the radiative and energy balance of the city. A higher urban density and a more closed urban geometry lead to higher values of PET. According to Andrade (2003) an increase of 0.5 in the ratio between the height of the building and the width of the street corresponds to an average increase of 1ºC in PET; however, this tendency is also dependent of the topographical features of the site.
In the most extreme weather conditions, such as the ones discussed, much of the city has high levels of discomfort (covering the extreme categories of physiological stress indicated in table I) and the expected bioclimatic conditions are nearly always more unfavourable than those expected when only ta is taken into account.
The nights (both hot and cold) always have lower spatial PET contrasts than the days. In the daytime, differences in exposure to direct sunlight contribute to higher thermal variations in the city. In Cold Winter Nights, conditions of extreme heat stress occur throughout the whole city, while in Summer Hot days, extreme heat stress is to be found only in the central and eastern part of the city, less exposed to the Ocean breezes. The map of north wind days shows great spatial variations, due to site positions in sheltered or windy areas.
The urban sprawl of recent decades, especially in the northern part of the city, alters the patterns of local ventilation and prevents the progression of wind and breeze into the city (there is a strong relationship between the roughness and the intensity of the breeze as reported by Vasconcelos and Lopes, 2007). Therefore, the conditions of ventilation and cooling of the city may be seriously affected leading, in some areas, to increased thermal discomfort of the population and degradation of air quality. From a thermal point of view exclusively the situation may be quite beneficial in winter, by reducing energy consumption; conversely, this is particularly critical in the summer as it heightens the level of discomfort through excessive heat.
the maps resulting from the modelling of thermal indices show the bioclimatic contrasts within the city and are important instruments for climate synthesis, a good support for urban planning and for the definition of measures for prevention and mitigation of hazards associated with extreme thermal conditions, that are anticipated to become more intense and frequent in the coming decades (according to forecasts of the IPCC, 2012 and 2013).
ACKNOWLEDGEMENTS
This paper is the result of my master thesis, presented in 2010. The research was developed under the dedicated, demanding but patient and ever-present guidance of Professor Henrique Andrade. Without his unconditional support, this work would not have been possible. The author wishes to thank Professor Maria João Alcoforado for her tireless encouragement and assistance within the preparation of this paper and Professor Ant ónio Lopes for the revision of the manuscript and several important suggestions. Thanks are also due to the anonymous referees whose comments have helped to improve the text and to Lisbon Municipality for the geographical data provided.
BIBLIOGRAPHY
Alcoforado MJ (1987) Brisas estivais do Tejo e do Oceano na região de Lisboa. Finisterra – Revista Portuguesa de Geografia, XXII (43): 71-112. [ Links ]
Alcoforado MJ (1992) O clima da regi ão de Lisboa. Contrastes e ritmos térmicos. Memórias do CEG, 15, Lisboa. [ Links ]
Alcoforado MJ, Andrade H (2006) Nocturnal urban heat island in Lisbon (Portugal): main features and modelling attempts. Theoretical and Applied Climatology, 84 (151-159). [ Links ]
Alcoforado MJ, Andrade H, Lopes A, Oliveira S (2007) A ilha de calor de Lisboa. Aquisi ção de dados e primeiros resultados estatísticos para aplicação ao ordenamento urbano. In CEG Centro de Estudos Geográficos (eds). Geophilia - o sentir e os sentidos da Geografia. Homenagem a Jorge Gaspar . Centro de Estudos Geográficos, Lisboa: 593-612. [ Links ]
Alcoforado MJ, Andrade H, Lopes A, Vasconcelos J (2009) Application of climatic guidelines to urban planning. The example of Lisbon (Portugal). Landscape and Urban Planning, 90(1-2): 56-65. [ Links ]
Alcoforado MJ, Andrade H, Lopes A, Vasconcelos J, Vieira R (2006) Observational studies on summer winds in Lisbon (Portugal) and their influence on daytime regional and urban thermal patterns. Merhavim, 6: 90-112. [ Links ]
Alcoforado MJ, Andrade H, Oliveira S, Festas MJ, Rosa F (2009b) Altera ções climáticas e desenvolvimento urbano (Climate Change and Urban development). DGOTDU, [ Links ] Lisboa.
Alcoforado MJ, et al. (2005) Orientações climáticas para o ordenamento em Lisboa . Geo-Ecologia, 4, CEG/ULisboa, Lisboa. [ Links ]
Alcoforado MJ, Vieira H (2004) Informação climática nos planos directores municipais de concelhos urbanos. Sociedade e Território , 37-38: 103-118. [ Links ]
Andrade H (1998) O desconforto térmico estival em Lisboa. Uma abordagem bioclimática. Finisterra – Revista Portuguesa de Geografia, XXXIII (66): 41-58. [ Links ]
Andrade H (2003) Bioclima humano e temperatura do ar em Lisboa Doutoramento em Geografia Física.. Universidade de Lisboa. [ Links ]
Andrade H (2005) O clima urbano – natureza, escalas de an álise e aplicabilidade. Finisterra – Revista Portuguesa de Geografia, XL (80): 67-91. [ Links ]
Andrade H, Alcoforado MJ (2008) Microclimatic variation of thermal comfort in a district of Lisbon (Telheiras) at night. Theoretical and Applied Climatology, 225 (3-4): 225-237. [ Links ]
Andrade H, Alcoforado MJ, Oliveira S (2011) Perception of temperature and wind by users of public outdoor spaces: relationships with weather parameters and personal characteristics. International Journal of Biometeorology, 55(5): 665-680. DOI: 10.1007/s00484-010-0379-0 [ Links ]
Andrade H, Vieira R (2007) A climatic study of an urban green space: the Gulbenkian Park in Lisbon (Portugal). Finisterra - Revista Portuguesa de Geografia, XLII(84): 27-46. [ Links ]
Baltazar S (2010) Mapas Bioclimáticos de Lisboa (Bioclimatological maps of Lisbon). Master thesis presented to the University of Lisbon, 2010. http://repositorio.ul.pt/bitstream/10451/3858/1/igotul000951_tm.pdf (in Portuguese) (accessed 03.10.12). [ Links ]
García-Herrera R, Díaz J, Trigo RM, Hernandez E (2005) Extreme summer temperatures in Iberia: health impacts and associated synoptic conditions. Annales Geophysicae, 23: 239-251. [ Links ]
Grimmond S, Oke TR (1999) Aerodynamic properties of urban areas derived from analysis of surface form. Journal of Applied Meteorology, 38: 1262-1292. [ Links ]
Höppe P (1997) Aspects of human biometeorology in past, present and future. International Journal of Biometeorology, 40: 19-23. [ Links ]
Höppe P (1999) The physiological equivalent temperature – a universal index for the biometeorological assessment of the thermal environment. International Journal of Biometeorology, 43(2): 71-75. [ Links ]
IPCC- Intergovernmental Panel on Climate Change (2012) Managing the Risks of Extreme Events and Disasters to Advance Climate Change Adaptation (SREX)..Cambridge University Press, Cambridge, UK, and NY, USA. [ Links ]
IPCC Intergovernmental Panel on Climate Change (2013) Climate change 201. The physical science basis: contribution of working group I to the fifth assessment report. Cambridge University Press, Cambridge, UK, and NY, USA.
Jauregui E (1997) Aspects of urban human biometeorology. International Journal of Biometeorology , 40: 58-61. [ Links ]
Kovats RS, Hajat S (2008) Heat stress and public health − a critical review. Annual Review of Public Health, 29: 41-55. [ Links ]
Lettau H (1969) Note on aerodynamic roughness-parameter estimation on the basis of roughness-element distribution. Journal of Applied Meteorology, 8: 828-832. [ Links ]
Linacre E (1992) Climate data and resources: a reference and guide. Routledge, London, United Kingdom. [ Links ]
Lopes A (2009) O sobreaquecimento das cidades. Causas e medidas para a mitigação da ilha de calor de Lisboa. Territorium, 15: 39-52 [ Links ]
Lopes A (2006) A microclimatological study of an urban canyon in Lisboa (Portugal), as a tool to suggest climate guidelines in local urban planning. 6thInternational Conference on Urban Climate, Göteborg, Sweden. [ Links ]
Lopes A (2003) Modificações no clima urbano de Lisboa como consequência do crescimento urbano. Vento, ilha de calor de superfície e balanço energético. Doutoramento em Geografia Física.. Universidade de Lisboa. [ Links ]
Lopes A, Alves E, Alcoforado MJ, Machete R (2013) Lisbon urban heat island updated: new highlights about the relationships between thermal patterns and wind regimes. Advances in Meteorology, vol. 2013, Article ID 487695, 11 pages, doi:10.1155/2013/487695 http://www.hindawi.com/journals/amet/aip/487695/
Lopes A, Lopes S, Matzarakis A, Alcoforado MJ (2011) Summer sea breeze influence on human comfort during hot periods in Funchal (Madeira Island). Meteorologische Zeitschrift, 20(5): 553-564. DOI: 10.1127/0941-2948/2011/0248 [ Links ]
Lopes A, Saraiva J, Alcoforado MJ (2011) Urban boundary layer wind speed reduction in summer due to urban growth and environmental consequences in Lisbon. Environmental Modelling & Software, 26(2): 241-243. [ Links ]
Marques J (2007) Condi ções climáticas de Inverno e a mortalidade diária no distrito de Lisboa. Dissertação de Mestrado em Geografia. Faculdade de Letras. Universidade de Lisboa. [ Links ]
Mayer H, Matzarakis A (1998) – Human-biometeorological assessment of urban microclimates. Thermal component. http://www.lib.kobe-u.ac.jp/repository/00044728.pdf (Consultado em Agosto 2010). [ Links ]
Matzarakis A, Amelung B (2008) Physiological Equivalent Temperature as indicator for impacts of climate change on thermal comfort of humans. In Thomson et al. (Eds.). Seasonal Forecasts, Climate Changes and Human Health: 161-172.
Matzarakis A, Mayer H, Iziomon M (1999) Applications of a universal thermal index: Physiological Equivalent Temperatures. International Journal of Biometeorology, 43: 76-84. [ Links ]
Nogueira P, Paixão EJ (2005) Modelos para a mortalidade associada a ondas de calor: actualização do sistema de vigilância e alerta de ondas de calor português. ONSA, Lisboa. [ Links ]
Oliveira S, Andrade H (2007) An initial assessment of the bioclimatic comfort in an outdoor public space in Lisbon. International Journal of Biometeorology, 52: 69-84. [ Links ]
Parlow (1999) Remotely sensed heat fluxes of urban areas. Proc. of the 15th Intern. Congress of biometeorology and Intern, conference of urban climatology. Sidney – Australia, Macquarie University.
Parsons KC (1993) Human thermal environments.Taylor & Francis, London. [ Links ]
Salgueiro TB (2001) Lisboa. Periferia e Centralidades. Oeiras, Celta. [ Links ]
Vasconcelos J (2006) Avaliação climática para o planeamento urbano de Lisboa. Influência do crescimento urbano no sistema de brisas do estuário do Tejo. Dissertação de mestrado. Faculdade de Ciências e Tecnologia da Universidade Nova de Lisboa, Lisboa. [ Links ]
Vasconcelos J, Lopes A (2007) Recent urban development trends and its implication on the estuarine breezes in Lisbon, Portugal in Proceedings of the 6th International Conference on Urban Climate, Lisbon, Portugal: 466-469. [ Links ]
Received: March 2013. Accepted: September 2014.
NOTES
i Difference between each value of ta and the mean value of all the observations.
iiratio between the sensible heat flux and the latent heat flux, which is often used in the estimation of evapotranspiration and as an indicator of greater or lesser presence of vegetation on the ground. typical values of the Bowen ratio were used following Parlow, 1999.

