


Services on Demand
Journal
Article
 English (pdf)
 Article in xml format
 Article references
 Send this article by e-mail
Indicators
-
 Cited by SciELO
 -
 Access statistics
Related links
-
 Similars in
SciELO
Similars in
SciELO
Share

 Permalink
Finisterra - Revista Portuguesa de Geografia
Print version ISSN 0430-5027
Finisterra no.98 Lisboa Dec. 2014
ARTIGO ORIGINAL
Urban bioclimate and comfort assessment in the African city of Praia (Cape Verde)
The population of Praia (Ilha de Santiago/Cape Verde)
António Lopes1 Ezequiel Correia2 Judite M. Do Nascimento3 Paulo Canário4
1 Researcher at CEG-IGOT-ULisboa, research Group ZePHyrUs, Professor at IGOT, Universidade de Lisboa, edifício da faculdade de Letras, alameda da Universidade, 1600-214 Lisboa, Portugal. E-mail: antonio.lopes@campus.ul.pt
2 Researcher at CEG-IGOT-ULisboa, research Group ZePHyrUs, Universidade de Lisboa, edifício da Faculdade de Letras, Alameda da Universidade, 1600-214 Lisboa, Portugal. E-mail: ezequielc@campus.ul.pt
3 Researcher and Professor at Departamento de Ciência e tecnologia da Universidade de Cabo Verde. E-mail: judite.nascimento@adm.unicv.edu.cv
4 PhD student and researcher at CEG-IGOT-ULisboa, research Group ZePHyrUs, Universidade de Lisboa, edifício da faculdade de Letras, alameda da Universidade, 1600-214 Lisboa, Portugal. E-mail: paulocanario@campus.ul.pt
ABSTRACT
Has recently increased from 90,000 inhabitants in 2000 to 132,300 in 2012. Located in the southern part of the Santiago Island, the city has an average temperature of 22ºC and high values of humidity. The hot and rainy season occurs between July and October. according to the Cape Verde “national Climate Change adaptation” report, the temperatures increased about 1ºC in the last 15 years and scenarios indicate an annual warming between 0.7 ºC and 2.5ºC until 2060. This will lead to the deterioration of bioclimatic comfort conditions, especially in urban areas. the main goals of this research are: i) to make a first-hand assessment of bioclimatic conditions and human comfort in the city of Praia; ii) to evaluate the main microclimatic and urban factors that increase thermal stress in a “planned” neighbourhood (Palmarejo). It was shown that “moderate and strong heat stress” (PET>29ºC) occurs between august and October. The rest of the year hardly any heat stress occurs (18ºC<PET<29ºC). In the Palmarejo neighbourhood, heat stress in hot days (PET>40ºC) happens especially in poorly ventilated streets, well exposed to the sun.
Keywords: Urban bioclimatology, thermal patterns, heat stress, PET, Praia, Cape Verde.
RESUMO
Avaliação do bioclima urbano e do conforto térmico da Praia (cabo Verde). A população da cidade da Praia aumentou de 90 000 habitantes, em 2000, para 132 300 em 2012. Localizada no litoral meridional da ilha de Santiago, Praia regista todo o ano valores elevados de humidade, e temperatura média superior a 22ºC. O período mais quente do ano, entre Julho e Outubro, coincide com a estação das chuvas. De acordo com o “Plano nacional de adapta ção às Mudanças Climáticas de Cabo Verde”, a temperatura do ar aumentou cerca de 1ºC na região, nos últimos 15 anos admitindo-se uma subida da temperatura média anual entre 0,7oC e 2,5oC até 2060. Prevê-se, assim, que ao longo deste século se degradem as condições de conforto bioclimático, particularmente nas áreas urbanas. Os principais objectivos deste estudo são: i) fazer uma primeira avaliação das condições bioclimáticas e do conforto humano na cidade da Praia; ii) determinar os principais factores microclimáticos e de morfologia urbana, que incrementam as situações de stress térmico no bairro do Palmarejo, na parte ocidental da cidade, escolhido para este estudo microclimático. No período mais quente e húmido do ano ocorrem predominantemente as situações de stress térmico “quente e muito quente” (PET> 29ºC), ao passo que o resto do ano é considerado “confortável” ou “ligeiramente quente” (18ºC <PET <29 ºC). No interior do bairro do Palmarejo, o stress térmico em dias quentes pode ser mais acentuado nas ruas bem expostas à radia ção solar directa e naquelas onde a ventilação é fraca, normalmente perpendiculares ao vento dominante de nordeste-alí seo (PET> 40ºC).
Palavras-chave: Bioclimatologia urbana, padrões térmicos, stress térmico, PET, Praia, Cabo Verde.
RÉSUMÉ
Evaluation du bioclimat urbain et du confort thermique a Praia (République du Cap Vert). De 2000 à 2012, la population de la ville de Praia, dans l’île de Santiago, est passée de 90 000 à 132 300 habitants. Située sur le littoral sud, la ville enregistre des valeurs élevées d’humidité et une température moyenne mensuelle toujours supé rieure à 22ºC. La période la plus chaude coïncide avec la saison des pluies, de juillet à octobre. Selon le « Plan national d’adaptation aux Changements Climatiques », la température moyenne de l’air a augmenté de près de 1ºC en 15 ans et un accroissement moyen annuel de 0,7 à 2,5ºC est prévu jusqu’en 2060. On pense donc que les conditions bioclimatiques vont se dégrader au cours du prochain siècle et surtout dans les aires urbaines. Objectifs principaux de la présente étude : i) ré aliser une évaluation provisoire des conditions bioclimatiques et du confort humain à Praia et ii) Déterminer les principaux facteurs microclimatiques et de morphologie urbaine qui accentuent les situations de stress thermique dans le quartier de Palmarejo, à l’ouest de la ville. Les situations de stress s’y produisent surtout pendant la saison la plus chaude et la plus humide (PET > 29ºC). Le reste de l’ann ée, le temps est «confortable» ou «assez chaud» (18< PET< 29ºC). Dans ce quartier, le stress thermique de saison chaude est plus fort dans les rues mal ventilées, perpendiculaires au vent dominant de ne, l’alizé, et dans celles qui sont le plus exposées à la radiation solaire directe (PET > 40ºC).
Mots-clés: Bioclimatologie urbaine, champs thermiques, stress thermique, PET, Praia, république du Cap Vert.
I. INTRODUCTION
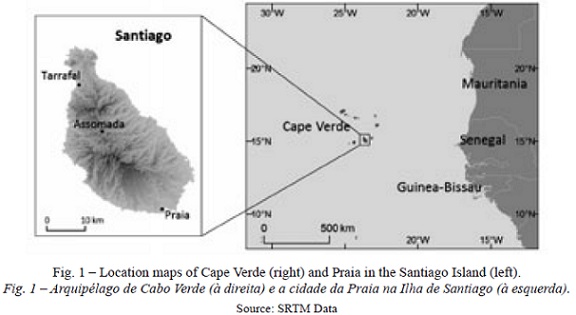
The city of Praia (Santiago Island) is the capital of Cape Verde republic, an insular country with 10 main islands located 500 km off the Senegalese western coast of Africa (fig. 1). According to the Census of 2010 (INE-CV, 2010), 491,683 people inhabit nine islands (S. Luzia is uninhabited). Out of the total population 303,673 people (61.8%) live in urban areas. as in other developing countries in Africa, severe droughts, soil and coastal erosion and flash floods are some of the environmental hazards that threaten its populations. another natural hazard, such as dust storms, known locally as Bruma Seca or Lestada (i.e. the Harmatan, a Sahara flux from the African continent towards the islands occurring from December to March) frequently have severe impacts at social (health problems and loss of life) and economic levels, mainly due to transport (land, air and sea) shutdown. the occurrence of these episodes makes Cape Verde society very dependent on the duration and intensity of natural hazards.
Recently, new concerns related to thermal comfort and air pollution, have arisen due to the fast urban growth in several African cities (Liousse et al., 2014). However, only a few studies have been conducted in Africa, namely in south-Africa (Becker, 2000), Algeria (Ali-Toudert et al., 2005), Angola (Ferreira-Baptista and De Miguel, 2005), Morocco (Johansson, 2006), Tanzania (Ndetto and Matzarakis, 2013a; Ndetto and Matzarakis, 2013b), and Nigeria (Eludoyin et al., 2014; Balogun and Balogun, 2014). Unfortunately some urban environmental hazards (especially human thermal discomfort) have not received much attention from national and international agencies. Until now it is obvious that the major concerns for the “underdeveloped” economies are related with primary assistance (food, health and fresh water supply) rather than with heat stress mitigation. nevertheless, part of African population currently have access to consumption goods with strong energy impact, such as individual transportation, massive use of air conditioning, etc. furthermore, Africa will have more urban dwellers and one of the largest population growth until 2050, with an expected 1,300 million increase (total of 2,431 million in 2050), exceeding the population-giant Asia rate (from 4,302 million in 2013 to 5,284 million in 2050, Haub and Kaneda, 2013). According to the same source of information, Cape Verde will have a rate of natural increase of 1.5%, reaching about 700,000 inhabitants in the middle of the century (the 2010 Cape Verdean census registered 491,683 inhabitants).
Along with the demographic explosion, the emissions of gases and particulate matter from fossil fuels combustion will impoverish the air quality in the near future in many African cities (Liousse et al., 2014). This will significantly modify the chemical composition of the urban boundary layer with consequences in the thermal patterns of the cities. We should note that the use of coal for home cooking in Cape Verde is a generalized practice nowadays; in fact, coal and wood are used by 32.1% of the dwellers in the archipelago (9.7% in urban areas - INE-CV, 2010).
Biometeorological and urban climate is a rapid expanding field (Gosling et al., 2014). In Africa, climate studies are more focused on the impacts of heat stress on human health and livestock than on human thermal comfort in outdoor conditions, as it was shown recently by Eludoyin et al. (2014). The causes are related with shortage of meteorological data in African cities and other priority needs related with immediate daily survival (Roth, 2007).
The Physiological equivalent temperature (PET) is a thermal index derived from the human energy balance (Matzarakis et al., 1999). PET corresponds to air temperature at a typical indoor setting in which an individual with normalized characteristics (sex, age, height, clothing, etc.) has the same physiological responses (skin temperature, core body temperature and sweating) as in a given real environment (H öppe, 1993 and 1999). PET is used to characterize the thermal bioclimate and is also suitable to urban and regional planning, whenever a thermal assessment is required (Matzarakis et al., 1999). Compared to other thermal indices PET has the additional advantage of using the widely known Celsius scale (°C) that is easily understood by urban planners and decision makers. PET can be used in all year round studies in different climates (Lin and Matzarakis, 2008; Zaninović and
Matzarakis 2009; Lopes et al., 2011) and it has been used in several regions with hot-humid climate in Southeast Asia (Lin and Matzarakis 2008; Nasir et al., 2012) and Africa (Johansson, 2006; Ndetto and Matzarakis 2013a and 2013b; Omonijo et al., 2013). The current study will show that this index is suitable to be applied in Cape Verde, although some adjustments to adapt physiological stress thresholds should be made in the future. The use of PET allows to build ranges of thermal perception and grades of physiological stress on humans for different regions and cli-mates enabling the comparison between different regions (Lin and Matzarakis 2008; Omonijo and 2013; Tzu-Pin et al., this issue).
The main objectives of this study are: i) to make a first-hand assessment of biothermal conditions and human comfort in the city of Praia (Cape Verde) and ii) to determine the microclimatic features that act as urban climate constraints in a sprawling neighbourhood in the western part of the city. To address the first objective, meteorological data from the Praia/airport station was used. This allowed us to show the frequency of thermal sensation classes and stress conditions in the main Atlantic tropical seasons (rain and dry season). To achieve the second objective, a microclimatological model (Envimet) was used to simulate wind speed and direction, mean radiative and air temperature and PET on a hot day. This allowed us to understand the importance of the wind, shade and vegetation in the streets as key factors to reduce outdoor thermal stress. The geographical characteristics of the study area are described in the next section. Details about the data and methodology used, such as the micrometeorological modelling, are presented in section III. Section IV includes the results and discussion and the conclusion is presented in section V.
II. STUDY AREA
1. The city of Praia: population and growing patternsOver 25% of the total population of the Cape Verde archipelago lives in the city of Praia. Its current population of 132,317 inhabitants has increased by 32% since 1990, and the current growth is about 3% per year. Until the 1930’s, the city of Praia was confined to the Plateau (Medina do Nascimento, 2009). in the middle of the XX century, the surrounding hilltops where gradually occupied (fig. 2) and during the 1970’s the vacant spaces were filled with new neighbourhoods, as a result of a spontaneous and unplanned manner, typical of many African urban sprawl processes (Medina do Nascimento, 2010). According to this author, more than 70% of the residential districts were built without proper planning or municipal licenses: 19 of the 31 residential neighbourhoods are predominantly unlicensed and many of the considered “formal” (planned) city-districts have illegal housing patches.
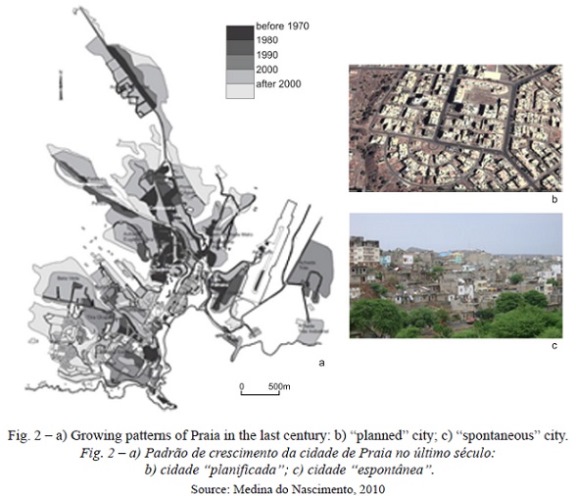
The traditional rectangular grid of the Plateau (introduced during the Portuguese administration) was not applied in many other areas. The new sprawling areas have an irregular shape (with very heterogeneous urban occupation, street orientation and width), determined by the space available between the buildings. Another urban characteristic is the scarcity of green spaces. Obviously, the natural ventilation in those areas is affected, with the impoverishment of the air quality and thermal conditions in indoor and outdoor spaces.
2. Temperature and wind regime at the Praia/airport meteorological station
According to the updated Köppen-Geiger climate classification (Peel et al., 2007), the climate of Praia is hot and dry (trockenes Passatklima , BWh - Köppen, 1936), with a wet irregular season from July to October. the minimum air temperatures during the dry season (December to June) range from 21ºC to 23ºC and the maximum from 25ºC to 27ºC. During the dry and cooler period, the lower relative humidity occurs in March with values around 50% during the day and 70% during the night. In the wet and hot season the humidity is very high especially during the night (80 to 90%) and about 70% around noon and late afternoon (fig. 3a). it is also the hottest period of the year, with very hot nights, e.g.
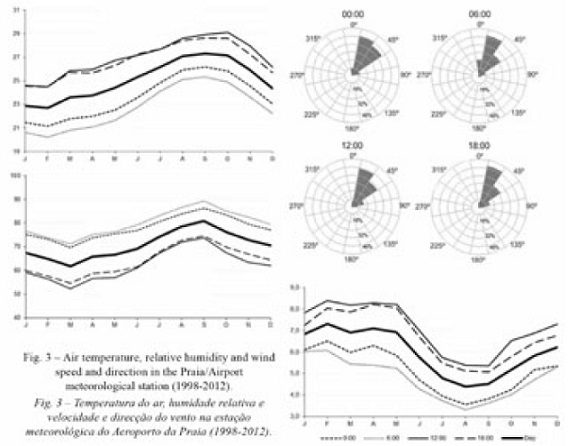
From august to October the daily mean temperature remains above 25ºC. The trade winds blow very regularly form ne all year round with high wind speeds in the dry season, especially during the day (8 to 9 m/s - fig. 3b). During the rainy season the wind speed drops to roughly 3 m/s during the night and 5 m/s during the day. The wet period from July to October, characterized by high temperature and humidity and low wind speed values, is locally known as “Azágua” and probably the most uncomfortable period of the year. The seasonality is, therefore, the main climate characteristic of Praia region, not only because of the rainfall occurrence but also due to other main climatic elements regime.
According to the latest report, published by the national adaptation Programme on Climate Change (INMG, 2010), in the last 15 years the mean annual temperature in Cape Verde increased by approximately 1ºC. Projected scenarios show an increase of 0.7 to 2.5ºC by 2060 and of 1.2 and 3.7ºC by the end of the century (Mcsweeney et al., 2010). Furthermore, until 2060, an increase of 16 to 32% in the frequency of hot days (with temperatures exceeding the current 90th percentile) and 23 to 49% of hot nights is expected. According to the same authors, these figures become even more severe from august to October, the warmest period of the year. An impoverishment of the bioclimatic comfort conditions in the archipelago is expected, particularly in the urban areas that have grown significantly during this century.
III. METHODS AND DATA
The regional thermal comfort assessment was made using PET (Physiological equivalent temperature). The calculations were performed using the rayMan software (Matzarakis et al., 1999 and 2007), which is a simple model that uses meteorological data as input. Data registered at the meteorological station of nelson Mandela airport of Praia (about 3 km northeast of the city centre, φ latitude 14.9 N / λlongitude, 23.5 W), during the periods of 1998-2006 and 2008-2012 was obtained from the national Climatic Data Centre (NCDC) ( http://gis.ncdc.noaa.gov/, last accessed in January 2014). Hourly data of air temperature, wind speed, relative humidity and cloud cover (used to estimate radiative fluxes indirectly) at 0:00h, 06:00h, 12:00h and 18:00h UTC, were used to compute PET. The software calculates the Mean radiant temperature (MRT), the main radiation influence on the human body that, along with the other meteorological parameters, assesses the thermal comfort. This evaluation was accomplished by analysing the frequency of occurrence of thermal stress (PET) classes, shown in the next section (IV. 1).
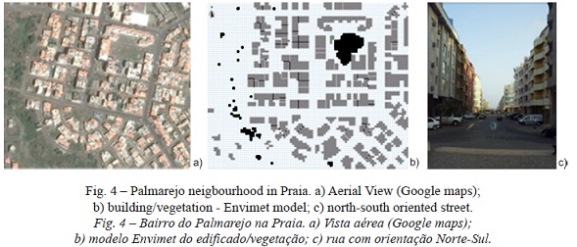
The micrometeorological study of the Palmarejo area, a neighbourhood in the western part of Praia (fig. 4), was made using the Envimet software (Bruse and fleer, 1998). This tool uses prognostic, non-hydrostatic, 3D micro-scale meteorological models with a horizontal resolution of 2 to 10 m and a vertical resolution from the surface to a few meters above the buildings. The model covers an area of about 18.3 ha. the simulations were performed during a clear sky “warm” thermal sensation day (maximum temperature > 30ºC and PET=34ºC), with a north-easterly wind with a speed of 4.6 m/s. these conditions were observed in the meteorological station of Praia airport, on the 15th august 2012 during the afternoon (12:00h, local time) (table I). The upper-air sounding at 12:00h (launched in the Sal Island and published by the University of Wyoming http://weather.uwyo.edu/upperair/sounding.html, last accessed in January 2014) was used for the initial boundary conditions at 2,500m which is the vertical limit of the model. The vegetation in Palmarejo is predominantly made up of dry grass (with few small trees in the western part) and buildings with typically 3 to 7 stories (fig. 4).
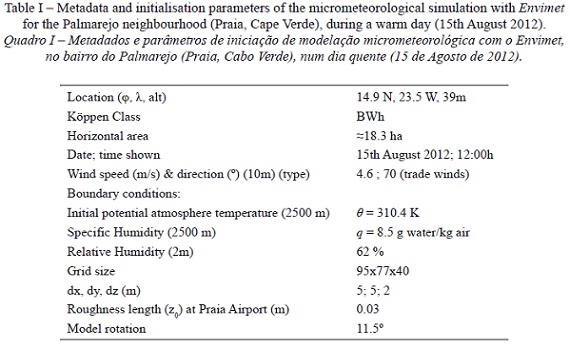
The software simulation yielded several layers of microclimatic data (programmed for every 3 hours, starting at 03:00 am to 21:00 pm during the 15th august 2012), from which we analysed the potential temperature (θºC), the Mean radiant temperature, the wind speed and direction and PET (the latter was calculated using the specific module - CalcPET). The results for noon (12:00h – solar time) are presented in the next section (IV. 2).
IV. RESULTS AND DISCUSSION
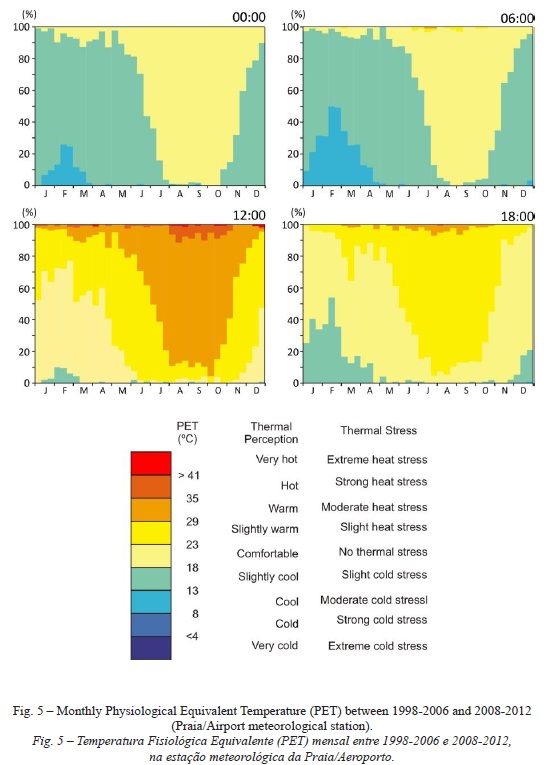
1. Thermal comfort and heat stress in the Praia regionthe regional thermal comfort in the Praia region is quite contrasted and can be divided into two annual and two daily categories (fig. 5): i) daytime (12:00h and 18:00h) of the dry season (from november to June) is dominated by “comfortable and slightly warm” thermal perception, although January and february have a fair frequency (40/50%) of “slight cold stress” in the beginning of the evening (18:00h); ii) during night time, a “moderate” to “slight cold stress” dominates the bioclimatic comfort; iii) the nights during the rainy season are, in general, comfortable; iv) however, during the day “moderate” to “strong heat stress” (PET between 29ºC and 40ºC) is the most common grade of physical stress perceived, with more than 90% of the occurrences from august to October; at sunset the environment becomes much more pleasant. it should be pointed out that these conditions are based on observations at the airport, out of town, without the effect of the city on air temperature and ventilation conditions.
2. Thermal comfort and heat stress in the “ planned” neighbourhood of Palmarejo
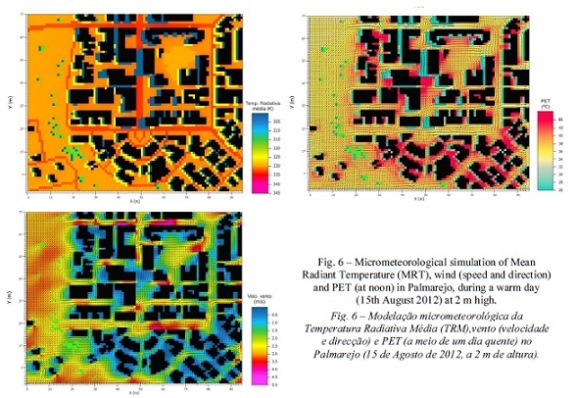
In this tropical region, thermal comfort is affected especially by solar radiation, air temperature and ventilation. Due to the high position of the sun in august at 12:00h, the pattern of Mean radiant temperature of the surfaces in the Palmarejo neighbourhood (fig. 6) is quite uniform (between 320K and 330K), except for the asphalted roads (> 330K) and shaded areas in the streets (< 297K). the general ne wind (4.6 m/s at the Praia/airport), at 2 m above ground, is less intense inside the streets (generally < 2 m/s) than in the more open spaces and W/e oriented streets (> 3 m/s). therefore, poor ventilation, high Mean radiant temperature and air temperature (≈ 300 K) are the main features that influence thermal comfort, that ranges from 27ºC to 35ºC in the sun exposed and poorly ventilated streets (the maximum PET value attains 38ºC in these spaces) and stays below 27ºC in the more ventilated open spaces. according to Matzarakis et al. (1999) most of the spaces where PET is greater than 35ºC lead to a “hot” and “very hot” thermal perception, corresponding to a “strong” and even “extreme heat” grade of thermal physiological stress. The open spaces, even with strong MRT but well ventilated correspond to warm with moderate heat stress (PET <35º C).
As was pointed out by Inocêncio (2012), the thermal comfort in the buildings of Cape Verdean cities can be achieved by optimizing the exposure to the sun trajectory and taking advantage of the prevailing winds, using passive cooling techniques, including natural ventilation and the thermal inertia of more traditional materials. as was shown in the present study, especially during daytime of the rainy season, Praia inhabitants feel a hot and humid sensation that combined with lower wind speeds, create a very strong heat stress (PET ranging from 29ºC to more than 41ºC) even in the open areas like the airport. During nigh time people feel some amelioration of thermal stress, especially in the hot and humid season.
In the less ventilated streets of city quarters with no shade or vegetation the heat stress can attain “extremely heat stress” levels, especially during very hot days as was shown in the micrometeorological simulation section. In order to avoid these extreme conditions in the urban environment the new building areas should be planned according to the best practices. Therefore, it is strongly advisable that the main streets should be planned with NE/SW orientation in order to take advantage of the trade winds’ regularity. As was shown by Lopes et al. (2011) for the Atlantic subtropical island of Madeira, the best measure to take advantage of sea breezes cooling effect in the areas near the shore, during very hot days, is to avoid the construction of buildings that act as barriers to the air flux from the sea. In addition to good ventilation conditions, another effective way to cool down urban areas is to plant trees as they create shaded areas and promote evapotranspiration. However, each situation should be carefully studied, because trees can obstruct the wind (probably retaining atmospheric pollutants as recent studies have shown, Vos et al., 2013) and can fall over people and assets during windstorms (Lopes et al., 2009).
If the heat stress can attain extreme values in the well ventilated neighbourhoods, like the one we studied here, the situation can be even worse in the non- planned “informal“ areas, most of them in the bottom of valleys, where most of the poor population live. Urban planning that takes into account the climate conditions is therefore of upmost importance, especially in the most populated areas of the archipelago of Cape Verde.
V. CONCLUSIONS
This research work is a first attempt to study the urban climate of an African coastal island city and to quantify the thermal stress that city dwellers are submitted to. Although the main research uses PET (Physiological equivalent temperature) to assess thermal stress, with classes well tested for European regions, this method was also tested in other African cities. It must be noted that Cape Verde has the advantage of being a well-known touristic destination and that the majority of its tourists originate from European countries. Nevertheless, our intention is to launch inquires in Cape Verde islands in the future, in order to adapt thermal sensation classes to the local population.
The first results indicate an extended period of severe heat stress from august to October, especially at noon, when 29ºC to more than 40ºC is the most common value of PET (more than 90% of the occurrences). Inside the so called “planned” neighbourhoods, like the one studied here (Palmarejo), the heat stress can be “ strong” and “extreme”, with PET values exceeding 40ºC in the less ventilated streets with little vegetation.
In order to validate 3D modelling and to know more precisely the thermal pattern distribution under thermal stress conditions near the buildings, a low cost urban mesoscale network of thermohygrometers should be implemented, similarly to what has been done in several cities around the world. This will improve our knowledge of the climatic changes in tropical cities.
As long as the lack of fine temporal and spatial resolution meteorological data persists, 3D modelling is a good alternative to obtain results in the microclimatic scale of analysis. Other possibilities (like radiative and sky view factor models) have to be implemented in order to ensure the improvement of urban climate studies in African cities as a tool to cope with future climatic changes.
As the population in these environments becomes more urbanized, urban planning is a fundamental part for the African urban sustainability. As shown by Oliveira et al. (2011 and this issue), green spaces in urban areas can create a cooling effect (park cool island) during hot and dry periods in cities with hot climate. Therefore, street trees and green parks (even small ones) providing evapotranspiration and shade, will contribute to mitigate global warming in cities. Furthermore, ventilation strategies, taking advantage of sea breezes and trade wind regularity, must be included in an overall assessment to improve urban environments and alleviate the thermal stress during hot period of the year (Lopes, 2009; Lopes et al., 2011). These simple measures can be very useful to diminish the adverse effects of heat in urban areas, and can be easily implemented through proper urban planning as was demonstrated by Alcoforado et al. (2005) and Alcoforado et al. (2009).
This preliminary analysis of the human bioclimatological assessment in Praia (Santiago island) highlights the importance to continue with this kind of research, which will include other weather types and atmospheric conditions, namely those with sahelian origin like the Harmatan and other extreme events.
In the future, new strategies to increment the quality of the urban environment in Praia, along with the creation of a new generation of guidelines for urban planning should be our concern. These guidelines should consider: i) climatic potentialities, like the wind to generate electricity locally to the dwellers (Lopes and Correia, 2012); ii) the risks associated with air pollution and falling elements during windstorms.
BIBLIOGRAPHY
Alcoforado MJ, Andrade H, Lopes A, Vasconcelos J (2009) application of climatic guidelines to urban planning. The example of Lisbon (Portugal). Landscape and Urban Planning, 90: 56-65. doi:10.1016/j.landurbplan.2008.10.006 [ Links ]
Alcoforado MJ, Lopes A, Andrade H, Vasconcelos J (2005) Orientações climáticas para o ordenamento em Lisboa. área de investiga ção em Geo-ecologia, 4, Centro de estudos Geográficos, Lisboa. [ Links ]
Ali-Toudert F, Djenane M, Bensalem R, Mayer H (2005) Outdoor thermal comfort in the old desert city of Beniisguen, Algeria. Climate Research, 1993: 243-256. [ Links ]
Balogun I, Balogun A (2014) Urban heat island and bioclimatological conditions in a hot-humid tropical city: the example of Akure, Nigeria. Die Erde, 145(1-2): 3-15. doi:10.12854/ erde-145-2 [ Links ]
Becker S (2000) Bioclimatological rating of cities and resorts in South Africa according to the Climate index. International Journal of Climatology , 20(12): 1403-1414. doi:10.1002/1097-0088(200010)20:12 [ Links ]
Bruse M, Fleer H (1998) Simulating surface–plant– air interactions inside urban environments with a three dimensional numerical model. Environmental Modelling & Software, 13(3-4): 373-384. doi:10.1016/s1364-8152(98)00042-5 [ Links ]
Eludoyin OM, Adelekan IO, Webster R, Eludoyin AO (2014) air temperature, relative humidity, climate regionalization and thermal comfort of Nigeria. International Journal of Climatology, 34(6): 2000-2018. doi:10.1002/ joc.3817 [ Links ]
Ferreira-Baptista L, De Miguel E (2005) Geochemistry and risk assessment of street dust in Luanda, Angola: a tropical urban environment. Atmospheric Environment, 39(25): 4501-4512. doi:10.1016/j.atmosenv.2005.03.026 [ Links ]
Gosling S, Bryce E, Dixon P, Gabriel K, Gosling E, Hanes J, Wanka E (2014) a glossary for biometeorology. International Journal of Biometeorology, 58: 277-308. doi:10.1007/ s00484-013-0729-9 [ Links ]
Haub C, Kaneda T (2013) World Population Data Sheet, Population reference Bureau, Washington, DC. [ Links ]
Höppe P (1999) The physiological equivalent temperature - a universal index for the biometeorological assessment of the thermal environment. International Journal of Biometeorology, 43(2): 71–5. doi:10.1007/s004840050118 [ Links ]
Höppe P (1993) Heat balance modelling. Experientia 49: 741-746.
INE-CV (2010) IV recenseamento Geral da População e de Habitação - censo 2010, instituto nacional de estatística de Cabo Verde. (Acessed on the 27 april, 2014) http://www.ine.cv/censo/censo2010.aspx [ Links ]
Inmg (2010) Segunda comunicação nacional de Cabo Verde sobre mudanças clim áticas. instituto nacional de Meteorologia e Geofísica, Praia.
Inocêncio D (2012) Construção e arquitectura sustentáveis em Cabo Verde. Estudo de Estratégias de Projecto Sustentável. ist, Lisboa. [ Links ]
Johansson E (2006) Influence of urban geometry on outdoor thermal comfort in a hot dry climate: a study in fez, Morocco. Building and Environment, 41(10): 1326-1338. doi:10.1016/j. buildenv.2005.05.022 [ Links ]
Köppen W (1936) Das geographische System der Klimate. Band I (Teil C): 44, Berlin. [ Links ]
Lin T-P, Matzarakis A (2008) Tourism climate and thermal comfort in sun Moon Lake, Taiwan. International Journal of Biometeorology, 52(4): 281-90. doi:10.1007/s00484-007-0122-7 [ Links ]
Liousse C, Assamoi E, Criqui P, Granier C, Rosset R (2014) Explosive growth in African combustion emissions from 2005 to 2030. Environmental Research Letters, 9: 1-10. doi:10.1088/1748-9326/9/3/035003 [ Links ]
Lopes A (2009) Sobreaquecimento das cidades. Causas e medidas para a mitigação da ilha de calor de Lisboa. Territorium, 15: 39-52. [ Links ]
Lopes A, Correia E (2012) a proposal to enhance urban climate maps with the assessment of the wind power potential. the case of Cascais Cascais Municipality (Portugal). In: Hájková L (ed.) International Scientific Conference “Bioclimate 2012 – Bioclimatology of Ecosystems: 68-69. Ústí nad Labem.
Lopes A, Lopes S, Matzarakis A, Alcoforado Mj (2011) The influence of the summer sea breeze on thermal comfort in Funchal (Madeira). A contribution to tourism and urban planning. Meteorologische Zeitschrift, 20(5): 553-564. doi:10.1127/0941-2948/2011/0248 [ Links ]
Lopes A, Oliveira S, Fragoso M, Andrade JA, Pedro P (2009) Wind risk assessment in urban environments: the case of falling trees during windstorm events in Lisbon. In: Střelcová K, Máty ás C, Kleidon A, Lapin M, Matejka F, Blaženec M, Holécy J (Eds.), Bioclimatology and Natural Hazards SE -:5 55–74. springer netherlands. doi:10.1007/978-1-4020-8876-6_5
Matzarakis A, Mayer H, Iziomon MG (1999) applications of a universal thermal index: physiological equivalent temperature. International Journal of Biometeorology, 43(2): 76-84. doi:10.1007/s004840050119 [ Links ]
Matzarakis A, Rutz F, Mayer H (2007) Modelling radiation fluxes in simple and complex environments-application of the rayMan model. International Journal of Biometeorology, 51(4): 323-34. doi:10.1007/s00484-006-0061-8 [ Links ]
Medina Do Nascimento J (2009) As relações entre o crescimento urbano e os sistemas de gestão e de planificação da cidade da Praia em Cabo Verde. in, 15º Congresso da aPDr - redes e Desenvolvimento regional, Praia.
Medina Do Nascimento J (2010) O crescimento urbano e os sistemas de gestão e de planificação na cidade da Praia, em Cabo Verde: proposta de uma nova abordagem na intervenção urbanística. Estudos Regionais, 24:5-21. [ Links ]
Mcsweeney C, New M, Lizcano G (2010) UNDP Climate Change Country Profiles: Cape Verde. http://country-profiles.geog.ox.ac.uk/ (accessed in 15 November 2013). [ Links ]
Nasir RA, Ahmad SS, Ahmed AZ (2012) Psychological adaptation of outdoor thermal comfort in shaded green spaces in Malaysia. Procedia-Social and Behavioral Sciences, 68: 865-878. doi:10.1016/j.sbspro.2012.12.273 [ Links ]
Ndetto E, Matzarakis A (2013a) Basic analysis of climate and urban bioclimate of Dares salaam, Tanzania. Theoretical and Applied Climatology, 114(1-2): 213-226. doi:10.1007/s00704012-0828-2 [ Links ]
Ndetto E, Matzarakis A (2013b) Effects of urban configuration on human thermal conditions in a typical tropical African coastal city. Advances in Meteorology, article iD 549096, 2013. doi:10.1155/2013/549096. [ Links ]
Oliveira S, Andrade H, Vaz T (2011) the cooling effect of green spaces as a contribution to the mitigation of urban heat: a case study in Lisbon. Building and Environment, 46(11): 21862194. doi:10.1016/j.buildenv.2011.04.034 [ Links ]
Omonijo AG, Adeofun CO, Oguntoke O, Matzarakis A (2013) relevance of thermal environment to human health: a case study of Ondo state, Nigeria. Theoretical and Applied Climatology, 113(1-2): 205-212. doi:10.1007/ s00704-012-0777-9 [ Links ]
Peel MC, Finlayson BL, Mcmahon TA (2007) Updated world map of the Koppen-Geiger cli-mate classification. Hydrol. Earth Syst. Sci. , 11: 1633-1644. doi:10.5194/hess-11-1633-2007 [ Links ]
Roth M (2007) Review of urban climate research in (sub) tropical regions. International Journal of Climatology, 27(14): 1859-1873. doi:10.1002/joc1591 [ Links ]
Vos PEJ, Maiheu B, Vankerkom J, Janssen S (2013) Improving local air quality in cities: to tree or not to tree? Environmental Pollution, 183: 113-22. doi:10.1016/j.envpol.2012.10.021
Zaninović K, Matzarakis A (2009) The bioclimatological leaflet as a means conveying climatological information to tourists and the tourism industry. Int. Journ. of Biometeorol. 53: 369-374. doi:10.1007/s00484-009-0219-2.
Received: April 2014. Accepted: October 2014.
ACKNOWLEDGEMENTS
The authors would like to thank the anonymous reviewers and the editor for their helpful and constructive comments that greatly contributed to improving the final version of this paper.
 All the contents of this journal, except where otherwise noted, is licensed under a Creative Commons Attribution License
