


Serviços Personalizados
Journal
Artigo
 Inglês (pdf)
 Artigo em XML
 Referências do artigo
 Enviar este artigo por email
Indicadores
-
 Citado por SciELO
 -
 Acessos
Links relacionados
-
 Similares em
SciELO
Similares em
SciELO
Compartilhar

 Permalink
Finisterra - Revista Portuguesa de Geografia
versão impressa ISSN 0430-5027
Finisterra no.95 Lisboa jun. 2013
ARTIGO ORIGINAL
Inundation and erosion susceptibility in wave dominated beaches
Suscetibilidade à inundação e à erosão aplicados a praias expostas
Jorge Trindade1; Ana Ramos-Pereira2
1Professor of the Open University (Universidade Aberta); Researcher at the CEG-IGOT-UL, Research Group SLIF - Coastal and Fluvial Systems: Dynamics, Environmental Changes and Management. E-mail: jorgetrd@uab.pt
2Associated Professor of IGOT-UL; Researcher at CEG-IGOT-UL, Research Group SLIF E-mail: anarp@campus.ul.pt
ABSTRACT
Hydrodynamic forces over the beach sediments are the main driving factors affecting the frequency and magnitude of morphological changes in beach systems. Most of the time, these driving factors act in a foreseeable way and do not represent any danger either to the coastal systems or to their population. However, hydrodynamic forces are also capable of inducing high morphodynamic behaviour on the beach profiles and very often in a short period of time; this endangers people and property and leads to system retreat. The most common consequences of the occurrence of this type of phenomena over the landforms are costal inundation and erosion. Still, many coastal systems, especially beach systems, have recovery mechanisms. Resilience levels have a very important role in the beach morphodynamic status and exposure to potential damaging event assessments. The Portuguese West coast has a high wave energetic environment during winter, where waves with 5 year recurrence period can reach 9.2m and storms are frequent. This research aims to access beach hazard and susceptibility to inundation and erosion. Three beach systems were selected and monitored applying sequential profiling methodology over a four year period (2004-2007). Sta. Rita, Azul and Foz do Lizandro beaches are representative systems of the coastal stretch between Peniche and Cascais, which is a cliff dominated coast. Results from the monitoring campaigns are presented including volume budgets, beach face slope changes, berm occurrence and heights and planimetric coastline dynamics. A hazard and susceptibility assessment diagram and zonation are proposed, including the parameterization of local flood (i.e. mean sea level maximum spring tides, and surge and run-up levels) and erosion potentials (i.e. volume budget and beach planimetric dynamics).
Keywords: Beach, susceptibility, inundation, erosion, index, extreme events.
RESUMO
Suscetibilidade à inundação e à erosão aplicados a praias expostas. A dinâmica de praia é predominantemente influenciada pelas forças hidrodinâmicas que atuam sobre os sedimentos e determinam quer o seu balanço volumétrico quer a sua dinâmica planimétrica. Estas forças definem a magnitude e a frequência das mudanças morfológicas registadas que, em boa parte do tempo, não implicam qualquer tipo de risco para o sistema ou para as populações. No entanto, as ondas associadas a temporais que incidem sobre as praias são também responsáveis por recuos extremos nos perfis de praia. Estes eventos originam perdas sedimentares muito significativas e o rápido recuo da linha de costa, colocando em risco infraestruturas, propriedades e pessoas. Este risco é frequentemente materializado através da exposição à inundação e à erosão de origem marinha. O litoral ocidental português tem elevada energia hidrodinâmica com ondas com 5 anos de período de retorno cuja altura significativa pode atingir 9,2m. O objetivo deste trabalho é avaliar a exposição de praias à inundação e à erosão, resultando da ocorrência de eventos hidrodinâmicos extremos. Apresentam-se os resultados da cartografia associada aos índices de potencial de inundação e erosão propostos para 3 sistemas de praia localizados no litoral entre Peniche e Cascais. Para o efeito foram estudadas e monitorizadas as de Sta. Rita, Azul e Foz do Lizandro com recurso à metodologia dos perfis de praia sequenciais durante 4 anos (2004-2007). Os resultados apresentados e a posterior modelação dos perfis em condições extremas de ondulação permitem apresentar um zonamento da suscetibilidade destes sistemas à inundação e à erosão.
Palavras-chave: Praia, suscetibilidade, inundação, erosão, índices, eventos extremos.
RÉSUMÉ;
Susceptibilite aux inondations et a l'erosion des plages exposees. La dynamique des plages est fortement influencée par les forces hydrodynamiques agissant sur les sédiments, ce qui détermine leur bilan volumétrique, ainsi que leur dynamique planimétrique. Ces forces sont responsables de l'ampleur et de la fréquence des modifications morphologiques enregistrées par les plages. Celles-ci, la plupart du temps, ne constituent aucun danger pour le système littoral, ni pour les habitants. Cependant, les houles associées aux tempêtes affectant le littoral, et surtout les plages, sont souvent responsables de retraits accentués des profils de plage, de pertes sédimentaires considérables et d'un recul rapide de la ligne de côte, mettant en danger infrastructures, biens et individus. Ce risque provoque souvent des inondations et des formes d'érosion d'origine marine. Le littoral occidental portugais connait un fort hydrodynamisme, avec des houles de tempête qui atteignent jusqu'à 9,2 m de hauteur significative, avec une période de récurrence de 5 ans. L'objectif de cette étude est d'évaluer l'exposition des plages à l'inondation et à l'érosion qui résultent des événements hydrodynamiques extrêmes. On présente les résultats cartographiques basés sur les indices de potentiel d'inondation et d'érosion, proposés pour 3 systèmes de plages, situés entre Cascais et Peniche. Les plages de Sta. Rita, Azul et Foz do Lizandro ont été étudiées et monitorisées, en utilisant la méthode de profils de plage séquentiels pendant une période de 4 ans (2004-2007). La modélisation ultérieure des profils en situation d'ondulation extrême a permis de cartographier le zonage de susceptibilité aux inondations et à l'érosion de ces systèmes littoraux.
Mots-clés: Plages, susceptibilité, inondation, érosion, indices, événements extrêmes.
I. INTRODUCTION
Beach systems are highly dynamic coastal systems. The main reasons that explain this behaviour are related to the non-cohesive nature of the sediments and their dependence on several triggering factors that have a high energetic potential.
Waves are the main triggering factor acting on the beach profile that produce morphological change through sediment transport.
This means that the main morphological changes associated with sudden sediment loss are, in most cases, attributed to the different types of storm events according to modal wave energy and direction in a short period of time.
Beach hazard assessment is an essential step for susceptibility analysis in these systems. Hazard is understood here as the changes in coastal processes on the beach profile in a frequency/magnitude time scale. However, it must be stressed out that, unlike cliffs, beaches are resilient systems, and their dynamic equilibrium is dependent on the balance between local vulnerability and their recovering capacity.
The most important consequences of extreme wave action over the beach profile are inundation of coastal areas by backshore overwash, erosion by sediment loss and coastline recession causing significant damage to natural systems and property.
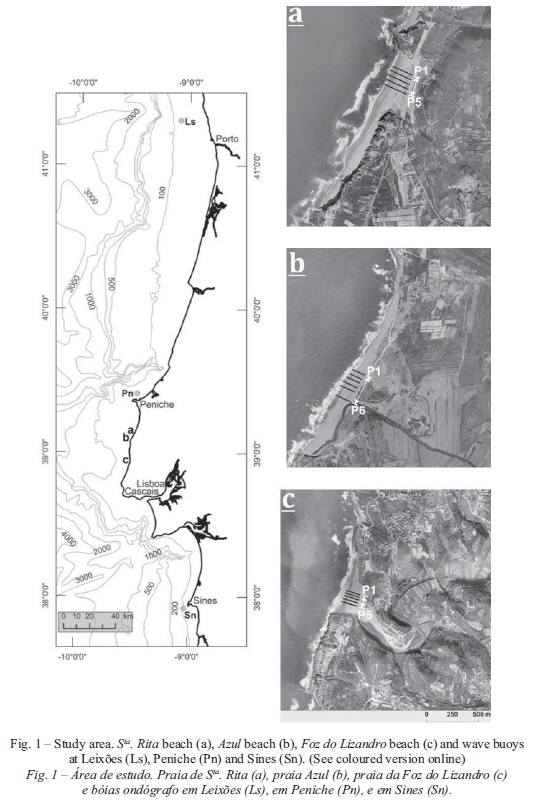
The aim of this study is to access beach susceptibility to inundation and erosion on the west coast of Portugal, between Peniche and Cascais (fig. 1). Beach susceptibility is understood as the spatial incidence of different types of hazard.
II. STUDY SITES
The western coast of Portugal has a semidiurnal mesotidal regime with maximum amplitude above chart datum of circa 4m. The coastal stretch between Peniche and Cascais is a wave dominated rocky coast, highly conditioned by the Atlantic atmospheric circulation. This results in a clear seasonal differentiation of wave patterns.
The mean annual wave height values registered on the west coast of Portugal vary between 1.8m and 2.4m (Carvalho and Baceló, 1966; Oliveira Pires and Pessanha, 1986; Costa, 1987; Teixeira, 1990; Soares, 1999) and have a clear seasonal differentiation. Winter wave heights reach 2.5m (Oliveira Pires and Pessanha, 1986) when the total west coast is considered. Vitorino et al. (2002), also stated that the mean summer wave significant height in the northwestern coast is between 1m and 2m; however, when the mean winter values are analysed this parameter reaches 3.5m. The dominant wave direction is NW (265 days/year, Costa, 1994).
A storm is defined to occur on the Portuguese West coast when a 5m offshore significant wave height (Hs) is registered (Pita and Santos, 1989; Costa, 1994; Gama et al., 1994).
The Peniche - Cascais coastal sector (fig. 1) is lacking in sediment supply from longshore drift and local sources because of: (i) the dominantly limestone nature of the cliffs; (ii) the presence of the Nazaré Canyon and the Peniche headland, two natural obstacles to sediment transport by longshore drift; (iii) the small sized river basins that are unable to effectively contribute to regional sediment budget.
In this coastal stretch beach systems are narrow, embayed and/or part of small estuaries.
The study sites of Sta. Rita, Azul and Foz do Lizandro beaches (fig. 1) are equally exposed W to NW waves but distinct in size, shape and type (table I).
Sta. Rita beach is a composite beach system with two components of beach-dune in its northernmost part and a beach-cliff system at the southern end. The dune field sub-component shows signs of heavy anthropogenic degradation, with a dense trampling network and abundant deflation surfaces. Cliff sub-component dynamics are mainly dependent on continental erosion processes (table I).
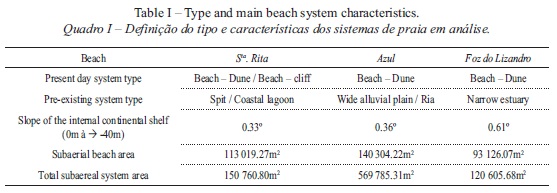
Azul beach-dune system is the largest system among the three study sites reaching 1900m along the coastline. Beach sub -component is widely exposed to NW dominant wave climate and to the W and SW storm waves, resulting in a modal steep slope profile. The dune field sub-component is the second largest in the Peniche-Cascais coastal stretch and occupies a wide alluvial plain (table I).
Foz do Lizandro beach is the smallest one and is a beach-dune system type with 600m of coastal length. Beach and dune components are highly anthropogenic intervened (table I).
III. METHODOLOGY
1. Susceptibility analysis conceptualization
Inundation and erosion of coastal areas are among the most frequent problems that stakeholders have to deal with and, generally, a spatial definition of exposed areas to hazard (susceptibility analysis) is needed in the integrated coastal zone management process.
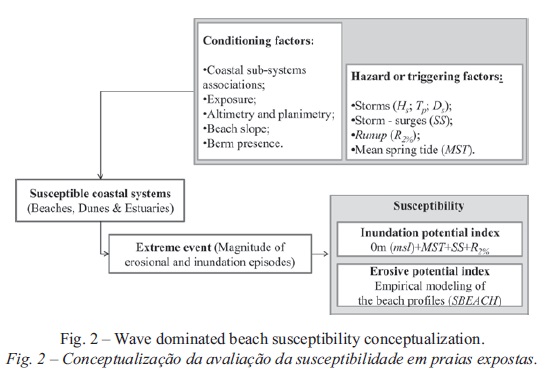
Susceptibility analysis is calculated and mapped based on the inundation potential index and on the erosion potential index (fig. 2) (Trindade, 2010). The main conditioning and triggering factors are taken into account, in particular those related with marine hydrodynamics, system morphodynamics and sediment characteristics.
1.1. Inundation potential index
Beach and backshore flooding are triggered in the first place by overwash events that can last from minutes or hours to days, according to the storm energetic content and period. Overwash occurrence is dependent on incident wave characteristics, tide height, storm surge height, runup levels and, ultimately and of most importance, beach slope and berm presence (fig. 2).
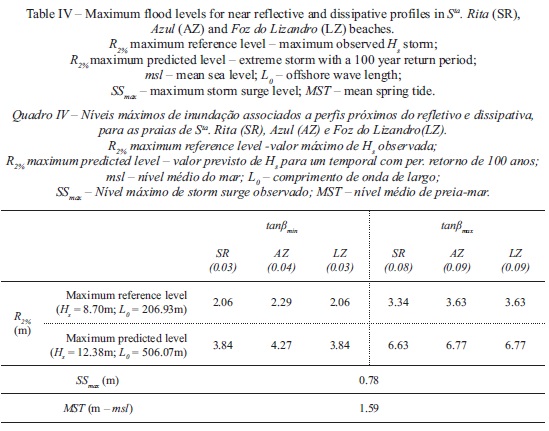
Inundation potential (IPI) was calculated for the three beach systems (eq. 1) by successively summing the different water levels in near reflective (tanβmax) and dissipative (tamβmin) profiles morphology. Water levels considered are the following:
(i) Mean sea level (0m msl) which is the reference base level obtained in the Cascais tide gauge;
(ii) Mean spring tide (MST) obtained from one year measurements in the Cascais tide gauge;
(iii) Storm surge maximum levels (SSmax) calculated from the differences between the high accurate records of water levels (3 minutes frequency) from the Portuguese Geographical Institute in the Cascais tide gauge and the predicted tides for the same area from the Hydrographic Institute, over the reference period (January 2004 - July 2007);
(iv) Runup values (R2%) are calculated with Stockdon et al. (2006), formulations for intermediate to reflective profiles (eq. 2;ξ0>3) and dissipative profiles (eq. 3; ξ0 <3), in every beach profile campaigns. For ξ0 values and beach morphodynamic classification the eq. 4 is applied.

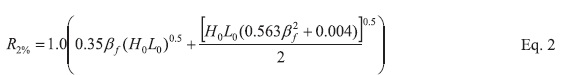


were H0 is the offshore mean significant wave height of the weekly period prior to each campaign, L0 is the correspondent wave length, βf is the mean beach face and low tide terrace slope, because these are the most exposed morphological elements of the beach profile to waves and currents.
1.2. Erosion potential
Beach erosion phenomena can be attributed to natural or anthropogenic causes, acting in very short time scales (storms or tsunamis) or more long -term trends (sea level rise). One of the most important triggering factors for fast sediment loss in the beach systems are extreme events such as storms, because of the associated high frequency and magnitude. Coastline recession, foredune erosion and beach and dune crest lowering are among the most important consequences of these episodes.
Highly accurate and reliable measurements of the beach response to these extreme energetic events are crucial for mean behaviour characterisation and extreme erosional response prediction, through numerical modeling of the profile morphological modifications.
In this study we use SBEACH numerical model (Larson and Kraus, 1989; Larson et al., 1990; Rosati et al., 1993; Wise et al., 1996 and Larson and Kraus, 1998) for extreme beach profile behaviour prediction, allowing assess to coastline recession over a 100 year return period storm. SBEACH is an empirical based numerical model which allows the use of calibration parameters (K and Є) for best fitting model results to local conditions of sediment transport and incident wave field. Model application follows in a two moment basis, with a first calibration approach and a second validation process. This model is also frequently used to predict erosion over the beach profile under extreme wave occurrence (Farrar et al., 1994; Schoonees and Theron, 1995; Zheng and Dean, 1997; Carley et al., 1999; Fauver, 2005; Tinh, 2006; Fauver et al., 2007; King Jr., 2007; Canizares and Irish, 2008; Creed and Reilly, 2008; Ponce, 2008; Corbau et al., 2009; Jimenez et al., 2009).
Before and after storm profiles are required for model calculations, as well as wave and tide data.
Two storm events per beach were chosen for model calibration and validation, allowing to access SBEACH performance both spatially, with the validation results for each profile in each beach, and in time. A total of 10 profiles in Sta. Rita, 12 in Azul and 10 in Foz do Lizandro, where used in this process.
The calibration process was applied only to the first profile in each beach (P1 - fig. 1) and to the first storm event, using morphodynamic and hydrodynamic reference terms to locally calibrate the empirical model parameters K (transport rate) and (slope dependent term).
The validation process consisted in the systematic application of calibrated K and Є values to predict volume loss from the remains profiles (P2 to P5 or P6 - fig. 1) in each beach and the comparison of predicted volumes with measured ones.
2. Data acquisition
A systematic beach profile survey was carried out over a four year period (2004-2007), resulting in 279 topographic transepts distributed over the three beach systems including emerged beaches and foredune subsystems. The total number of profiles ready for survey in each beach system per campaign is: Sta. Rita beach 5 profiles; Azul beach 6 profiles, Foz do Lizandro beach 5 profiles (fig. 1). Berm and beach face dynamics, including crescentic beach morphology, deter-mined the profiles spacing and position.
dGPS and total station were used in fixed beach profile monitoring and an overlap of the transepts over time was assured. The differences between measurements acquired by both equipments proved to be negligible in this dynamic context (Trindade et al., 2007).
Between September 2005 and July 2006, the surveys were preformed bimonthly, allowing the detailed record of several pre- and post-storm morphology data. This is essential for the assessment and modeling of the system response to high energetic events in terms of volumetric budget and planimetric dynamics. Measured volumetric budget was calculated above mean sea level and bellow the point of no relative hydrodynamic sand movement, excluding dune morphology changes due to aeolian transport.
Superficial sediment sampling was performed as part of each campaign data collection in order to evaluate the characteristic grain size of each system. Samples were collected from the most dynamic morphological elements of the beach profile, namely the berm, the beach face, the base of the beach face and the low tide terrace. Approximately 60g of sediment was washed and dry-sieved; sand statistics parameters were calculated according to the logarithmic method of the moments with Gradistat spreadsheet (Blott and Pye, 2001). Sediment size is a very important parameter in beach profile modeling because it defines beach slope and infiltration/exfiltration processes in the beach profile.
Wave parameterization based on significant heights (Hs), periods (Ts) and directions (Ds) was only available from the two west coast wave buoys still functioning, the Leixões and Sines buoys (fig. 1). This data was used to assess storm frequency and magnitude during the monitoring period, establishing the basic hydrodynamic parameterization for profile model calibration and validation. Significant wave return periods were calculated from the nearest Peniche wave buoy 1980 - 1985 time series (fig. 1), using generalised extreme value distribution with R© open source software.
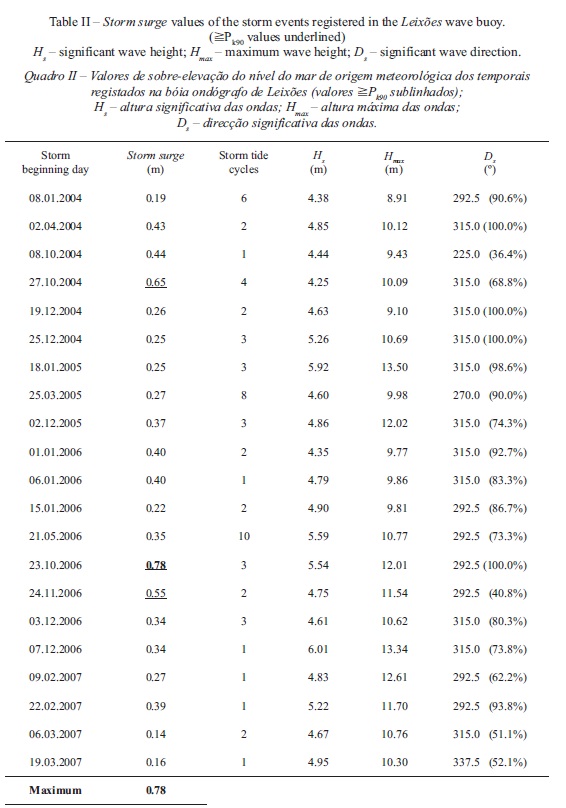
Tide data was obtained from public secular data series of water heights at the Cascais tide gauge. Storm surge values were evaluated using the difference be-tween the Portuguese Geographical Institute measured Cascais tide gauge records and the Hydrographic Institute tide height predictions for every storm event registered in the Leixões and Sines wave buoys during the reference period (January 2004 to July 2007, table II and table III). Both data series are referenced to the Cascais Datum which means that sea level changes in the last decades (~~1,9mm yr-1, Antunes and Taborda, 2009) is not considered in this study. Consequently, modeled water level calculations may express a slight underestimation.

IV. RESULTS
Hydrodynamic, morphodynamic and sediment data is now presented following the conceptual model described above.
1. Inundation potential index
1.1. Storm surge levels
It was found that both the values above the 90th percentile and the maximum storm surge values (table II and table III) were very high when compared to other reference studies in this area (Taborda and Dias, 1992 - 0.50m; Gama et al., 1994 - 0.52m).
Storm surge data analysis revealed that these events lasted no longer than 10 tide cycles (approximately 5 days). Considering the most extreme events (Pk90 = 0.55m), storm surge can be considered a very brief episode lasting no longer than 4 tide cycles.
No correlation was found between storm waves and storm surge magnitudes.
1.2. Runup levels
Runup levels (eq. 2 and 3) were calculated as a function of the maximum observed wave data during the reference period (maximum reference level, table IV) and based on a 100 year return period storm data (maximum predicted level, table IV) for the lower and higher slope values registered during the monitoring campaigns (table IV). As expected the higher runup levels are associated to near reflective behaviour of the beach profile. In these type of profiles energy dissipation occurs near the coastline leading to higher levels of setup and runup. The discriminated calculation of levels according to the morphodynamic state of the beach is, therefore, essential for susceptibility analysis.
2. Erosion potential index
2.1. Morphodynamic and hydrodynamic reference values for model calibration and validation
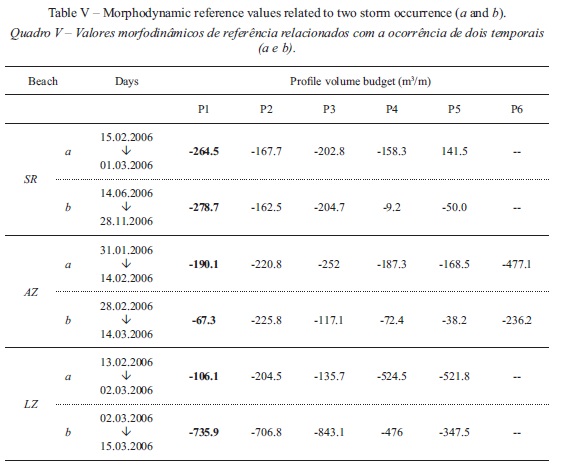
Two episodes per beach system of measured significant sediment loss in a short period (typically 15 days) were selected as a morphodynamic reference basis for model testing. Volume budgets per profile are almost always negative and this is more evident in the Foz do Lizandro system (table V).
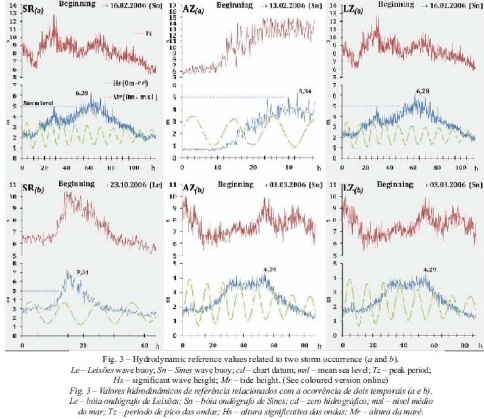
Hydrodynamic reference values per beach show very distinct episodes in the duration of events and significant wave height distribution over time (fig. 3).
Reference storms for Sta. Rita beach were the most severe, with Hs reaching 7.34m.
2.2. Model calibration
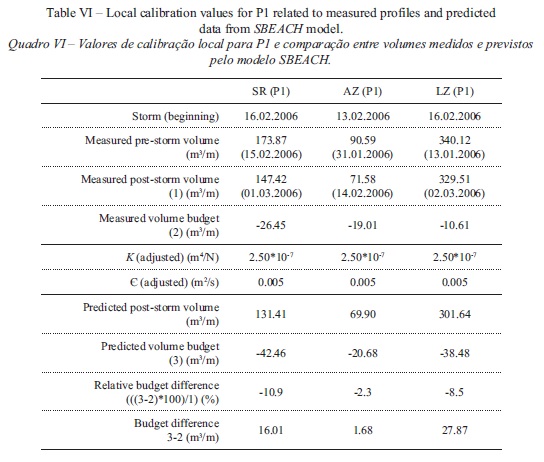
The calibration process involved the successive adjustment of the K (transport rate term) and (slope dependent term) for P1 in each beach system and on the first storm event to best fit measured results. Default values of K and were then replaced by better fitted ones and results are expressed in table VI. In the worst case scenarios, which are the results of Sta. Rita beach, the model explains over 89.1% of the measured profile, leaving 10.9% of unexplained volume change data (table VI).
2.3. Model validation
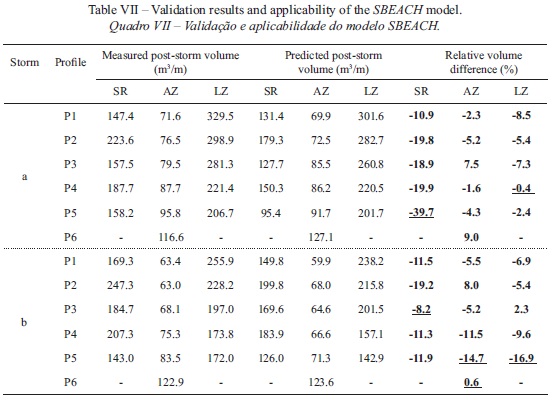
K and calibrated values were then systematically applied to the rest of the 29 profiles in the three beach systems to access model performance and results validation. Results are shown in figure 4 and table VII.
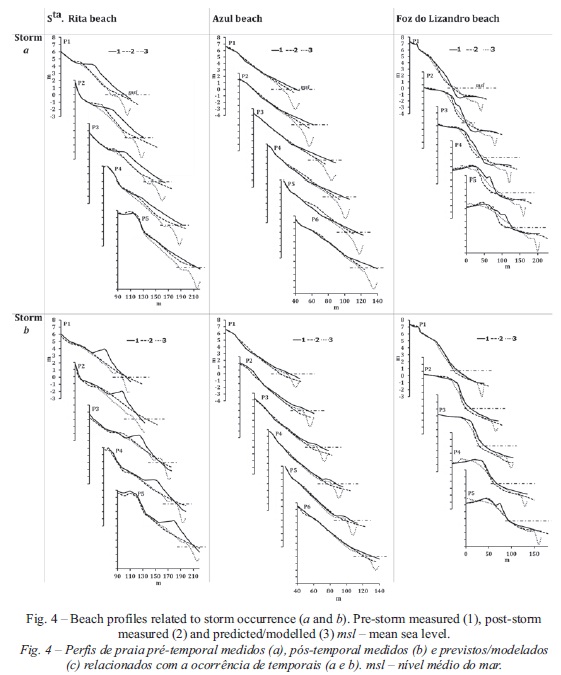
The profile modeling results (fig. 4) show good corresponding results above msl considering the measured post-storm and the predicted profiles. Poor correspondence below msl is related to lack of bar morphodynamic data and for this reason volume change was systematically calculated above msl. The Foz do Lizandro beach shows a slight erosion overestimation on berm morphology. The same slight erosion overestimation occurs in Sta. Rita beach on P5 (storm a) and on P2 (storm b).
The relative volume difference between post-measured and predicted volumes can be assumed as a significant level parameter. In general we can assume the good performance of the model (table VII - relative volume difference). In most cases (20 profiles in 32) the relative volume difference does not exceed 10%, which means that the model is explaining in most cases more than 90% of the measured changes due to storm events. The maximum relative difference value is -39.7%.
V. BEACH SUSCEPTIBILITY MAPPING FOR WAVE DOMINATED BEACHES
Mapping beach susceptibility to erosion and flooding based on field data measurements and profile modeling revealed different results in the three beach systems. Results of predicted flooding areas and beach recession are analysed within the system limits.
1. Sta. Rita beach
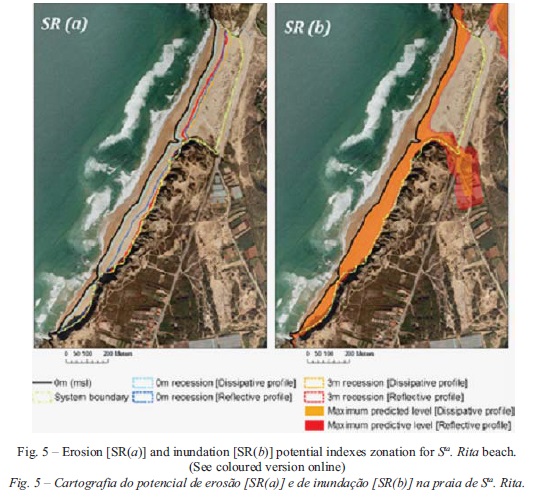
Coastline recession in the two proposed scenarios (initial dissipative or reflective profiles) have slight consequences on the beach dune component of the system (fig. 5a). Even the 3m contour recession, which may be assumed as the berm crest or the boundary between the foreshore and the backshore, have no significant consequences in the dune sub-system, considering a 100 year storm return period. Unlike this system component, the southernmost beach-cliff sector may experience severe erosion caused by beach vanishing. Continental predominant geomorphologic processes may be replaced by marine erosion. Predicted flooding levels also have no important impact neither inside nor outside the system boundaries (fig. 5b). Contrasted flooding areas between the north and the central sectors of this beach system are due to the presence and morphology of the dune field in the northern sector. The central sector of the Sta. Rita beach system is occupied by a very small and narrow alluvial plain (Sorraia brook), which conditions the inland extent of the predicted flood area.
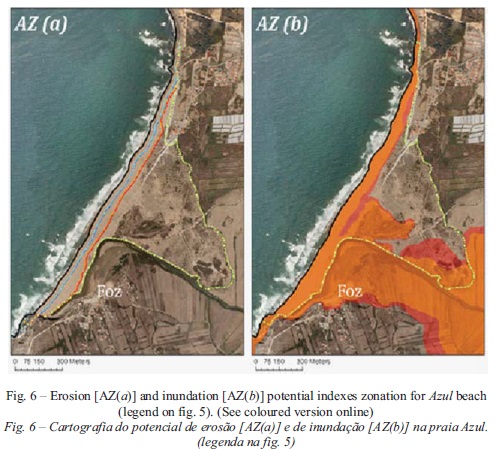
2. Azul beach
Predicted erosion and coastline recession will cause the disappearance of the emerged beach, with extreme foredune erosion (fig. 6a). This is particularly problematic because the southernmost spit sector will probably be replaced by an open estuary endangering the Foz locality. Extreme inundation levels confirm the high risk exposure of this locality to generalized overwash processes and direct wave damage (fig. 6b).
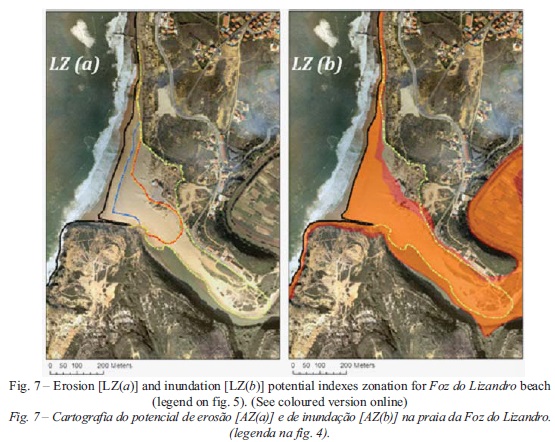
3. Foz do Lizandro beach
Severe berm level recession will replace the present closed estuary system with an open one with consequences in the actual beach support structures (fig. 7a). The beach sub -system area will be drastically reduced, but the small dune field is well protected from erosion due to its sheltered position. Extreme flood levels associated with marine hydrodynamics will affect the total area of the estuary floodplain (fig. 7b), with high potential of risk to the local population and properties.
VI. CONCLUDING REMARKS
Like other systems in wave dominated costal environments, beaches are exposed to extreme hydrodynamic events that can cause sudden remarkable modifications in the morphology, often causing a high magnitude of sediment loss and coastline retreat. Predicting this extreme system behaviour, through erosion or inundation processes, can prevent infrastructure and property damage and, in limited situations, loss of life.
Susceptibility mapping methodology of the predicted areas of extreme erosion (coastline retreat) and inundation proved to be applicable to the studied beach systems.
The inundation potential index show that a series of marine water levels can be combined based on the existing time series of waves to achieve a 100yr return period levels. Because runup levels are slope dependent, it is of fundamental interest to map the inundation parameters associated with dissipative and reflective profiles. It was shown that results can be considerable different according to the initial type of beach profile.
The erosion potential index revealed the importance of the beach extreme profile behaviour modeling and empirical adjustment. The application of the SBEACH model proved to be a very versatile tool for extreme beach retreat prediction. The calibration process and especially the validation results show good adjustment between predicted and measured values of beach retreat under storm conditions.
ACKNOWLEDGMENTS
The authors would like to express their sincere thanks to the scientific referees for their insights and suggestions that greatly improved the quality of the article.
[ Links ]
Blott S J, Pye K (2001) Gradistat: a grain size distribution and statistics package for the analysis of unconsolidated sediments. Earth Surf. Pro-cess. Landforms 26: 1237-1248. [ Links ]
Canizares R, Irish J (2008) Simulation of storm-induced barrier island morphodynamics and flooding. Coastal Engineering, 55: 1089-1101. [ Links ]
Carley J, Turner I, Couriel E, Jackson L, Mcgrath J (1999) The practical application of four commercially available numerical beach morphology models on a high energy coastline. Proceedings of Coasts and Ports '99, Perth, Australia. Institute of Engineers, Australia: 101-106. [ Links ]
Carvalho J, Barceló J (1966) Agitação marítima na costa W de Portugal. Memórias do L.N.E.C., 290. [ Links ]
Corbau C, Simeoni U, Archetti R, Peretti A, Farina, M (2009) Winter sandy protections of the Northern Adriatic coast against flooding: preliminary results. Journal of Coastal Research, SI56: 1194-1198. [ Links ]
Costa M (1994) Agitação marítima na costa portuguesa. Anais do Instituto Hidrográfico, 13: 35-40. [ Links ]
Costa M (1987) Análise de um ano de dados de agitação marítima na Figueira da Foz. Anais do Instituto Hidrográfico, 8: 23-28. [ Links ]
Creed C, Reilly W (2008) Site-Specific Calibration of the SBEACH Model for a Southeast Florida Beach. Proceedings from the 21st National Conference on Beach Preservation Technology. Sarasota, Florida. [ Links ]
Farrar P, Borgman L, Glover L, Reinhard R, Pope J, Swain A, Ebersole B (1994) Storm impact assessment for beaches at Panama City, Florida. Technical Report CERC-94-11, U.S. Army Corps of Engineers, Vicksburg, U.S.A. [ Links ]
Fauver L (2005) Toward predicting barrier island vulnerability: simple models for dune erosion. MSc thesis, College of Marine Science, University of South Florida. [ Links ]
Fauver L, Thompson D, Sallenger A (2007) Modeling dune response using measured and equilibrium bathymetric profiles. Proceedings of the 6th International Conference on Coastal Sediments, ASCE, New Orleans: 897-910. [ Links ]
Gama C, Dias J, Ferreira Ó, Taborda R (1994) Analysis of storm surge in Portugal, between June 1986 and May 1988. Proccedings of Littoral, 94: 26-29. [ Links ]
Jimenez J, Ciavola P, Balouin Y, Armaroli C, Bos-com E, Garvais M (2009) Geomorphic coastal vulnerability to storms in microtidal fectch-limited environments: application to NW Mediterranean & N Adriatic seas. Journal of Coastal Research, SI56: 1641-1645. [ Links ]
King J R (2007) Wave and beach processes modeling for Sabine pass to Galveston Bay, Texas, Shoreline erosion feasibility study. ERDC/ CHL TR-07-6, Coastal and Hydraulics Laboratory, U.S. Army Engineer Research and Development Center, Vicksburg. [ Links ]
Larson M, Kraus N (1998) Numerical model for simulating storm induced beach change. Re-port 5: Representation of nonerodible(hard) Bottoms. Technical Report CERC-89-9, U.S. Army Corps of Engineers, Vicksburg, U.S.A. [ Links ]
Larson M, Kraus N (1989) Numerical model for simulating storm induced beach change. Re-port 1: Empirical foundation and model development. Technical Report CERC-89-9, U.S. Army Corps of Engineers, Vicksburg, U.S.A. [ Links ]
Larson M, Kraus N, Byrnes M (1990) Numerical model for simulating storm induced beach change. Report 2: Numerical formulation and model tests. Technical Report CERC-89-9, U.S. Army Corps of Engineers, Vicksburg, U.S.A. [ Links ]
Oliveira Pires H, Pessanha V (1986) Wave power climate of Portugal. Proceedings IUTAM Symposium, Hidrodynamics of ocean wave-energy utilization: 157-167. [ Links ]
Oliveira Pires H, Pessanha L (1982) Características direccionais da agitação marítima na região de Sines. Instituto Nacional de Meteorologia e Geofísica, Lisboa. [ Links ]
Pita C, Santos J (1989) Análise dos temporais da costa oeste de Portugal Continental. Report 1/89-A, Instituto Hidrográfico/L.N.E.C., Lisboa. [ Links ]
Ponce E (2008) Coastal vulnerability to storms in the Catalan coast. PhD thesis, Laboratori d' Enginyeria Maritima, Universitat Politecnica de Catalunya.
Rosati J, Wise R, Kraus N, Larson M (1993) Numerical model for simulating storm induced beach change. Report 3: User's Manual. Technical Report CERC-93-2, U.S. Army Corps of Engineers, Vicksburg, U.S.A. [ Links ]
Schoonees J, Theron A (1995) Evaluation of 10 cross-shore sediment transport/morphological models. Coastal Engineering, 25: 1 -41. [ Links ]
Soares A (1999) Caracterização do clima de agitação marítima em Portugal continental utilizando os resultados do modelo numérico MAR3G.2. Nota técnica VAM2 - 2/99, Instituto de Meteorologia.
Stockdon H, Holman R, Howd P, Sallenger J R A (2006) Empirical parameterization of setup, swash, and runp. Coastal Engineering, 53: 573-588. [ Links ]
Taborda R, Dias J (1992) Análise da sobreelevação do mar de origem meteorológica durante os temporais de Fevereiro/Março de 1978 e Dezembro de 1981. Geonovas, 1: 89-97. [ Links ]
Teixeira S (1990) Dinâmica das praias da Península de Setúbal (Portugal). Dissertação de Mestrado, Universidade de Lisboa.
Tinh N (2006) Modelling of coastal overwash. Review and application of state-ofart empirical, numerical and analytical methods. MSct Thesis, Lund Institute of Technology/Lund University.
Trindade J (2010) Dinâmica morfossedimentar de praias dominadas por sistemas de arriba (Peniche-Cascais). Tese de Doutoramento em Geografia, especialidade de Geografia Física, Universidade Aberta, Lisboa. [ Links ]
Trindade J, Ramos-Pereira A, Neves M, Borges B, Paixão R (2007) Monitorização da morfodinâmica de praias com dGPS e Estação Total. Comparação de resultados. Publicações da Associação Portuguesa de Geomorfólogos, V: 293-301. [ Links ]
Vitorino J, Oliveira A, Jouanneau J, Drago T (2002) Winter dynamics on the northern Portuguese shelf. Part 1: physical processes. Progress in Oceanography, 52: 129-153. [ Links ]
Wise R, Smith S, Larson M (1996) SBEACH: Numerical model for simulating storm-induced beach change. Report 4: Cross-shore transport under random waves and model validation with SUPERTANK and field data. Technical Report CERC-89-9, US Army Corps of Engineers, Vicksburg, U.S.A. [ Links ]
Zheng J, Dean R (1997) Numerical models and intercomparisons of beach profile evolution. Coastal Engineering, 30: 169-201. [ Links ]
Recebido: Junho 2012. Aceite: Março 2013
 Todo o conteúdo deste periódico, exceto onde está identificado, está licenciado sob uma Licença Creative Commons
