


Serviços Personalizados
Journal
Artigo
 Inglês (pdf)
 Artigo em XML
 Referências do artigo
 Enviar este artigo por email
Indicadores
-
 Citado por SciELO
 -
 Acessos
Links relacionados
-
 Similares em
SciELO
Similares em
SciELO
Compartilhar

 Permalink
Ciência e Técnica Vitivinícola
versão impressa ISSN 0254-0223
Ciência Téc. Vitiv. vol.26 no.2 Dois Portos 2011
Public instruments for business management in Chilean wine industry: A comparative analysis of discrete choice models
Germán Lobos1, Jean-Laurent Viviani2, Berta Schnettler3, Tamara Tigero4, Ángela Reyes5
1Ph.D. Universidad de Talca, Escuela de Ingeniería Comercial, 2 Norte 685, 3465548 Talca, Chile. Tel: 56 71 200330; globos@utalca.cl
2Ph.D. Université Montpellier 1 Institut des Sciences de L'Entreprise et du Management (ISEM), Centre de Recherche sur le Management et les Marchés (CR2M), Espace Richter - Bât. B - Rue Vendémiaire - CS 19519 - 34960 Montpellier cedex 2 , France. Tel: 33499 130245; jviviani@univ-montp1.fr
3Ph.D. Universidad de La Frontera, Departamento de Producción Agropecuaria, Avenida Francisco Salazar 01145, 4780000 Temuco, Chile. Tel: 56 45325655; bschnett@ufro.cl
4M.Sc. Universidad de Talca, Escuela de Ingeniería Comercial, 2 Norte 685, 3465548 Talca, Chile. Tel: 56 71 200323; ttigero@utalca.cl
5Ingeniero Comercial, Universidad de Talca, areyes.ic@gmail.com
SUMMARY
In Chile there is a wide availability of public instruments to promote productivity in business management, which in practice serve as financial hedge instruments. Based on multivariate analysis the authors estimate the probability of using public instruments in Chilean wine industry comparing logit and probit models. Results indicate that probability depends on different socioeconomic variables and sources of risk. The global correct prediction was estimated in 80.5% through ROC curve analysis.
Key words: financial hedge instruments, multivariate analysis, sources of risk, ROC curve.
Instrumentos públicos de gestão de negócios na indústria vínicola Chilena: Uma análise comparativa de modelos de escolha discreta
RESUMO
No Chile, existe uma ampla disponibilidade de instrumentos públicos para promover a produtividade na gestão dos negócios, que na prática funcionam como instrumentos de hedge financeiros. Com base em análise multivariada, os autores estimam a probabilidade de utilização de instrumentos públicos na indústria vinícola chilena, comparando a avaliação de modelos logit e probit. Os resultados indicam que a probabilidade depende de diversas variáveis socio-económicas e das fontes de risco. A previsão global correta foi estimada em 80,5%, através de análise da curva ROC.
Palavras-chave: Instrumentos hedge financeiros, análise multivariada, fontes de risco, curva ROC.
INTRODUCTION
In Chile there is a wide variety of public instruments to promote productivity in business management, especially in risk management and innovation. In practice, they play a role as financial hedge instruments, such as insurances, futures and derivates. The effectiveness of these instruments, in terms of the impact on companys investments returns, entrepreneurship and creation of new business, job generation, or the impact on the economys GDP (Gross Domestic Product), is still a topic in discussion. From a risk management point of view, empirical evidence shows that the majority of farmers are risk-averse (Binswanger, 1981; Antle, 1987; Bardsley & Harris, 1987; Binswanger & Deininger, 1997; Anderson & Hardaker, 2003) when facing economic or production decisions.
Different to other markets, incomplete markets are observed in the agricultural sector due to the relative shortage of uncertainty and risk management instruments, such as insurances, loans, futures and derivates. According to Skees and Barnett (1999), as risk coverage is clearly less than the social optimum, an economic efficiency loss is incurred. The poor development of financial coverage instruments is usually used as an argument to justify government intervention in agriculture. For example, extraordinary aids are required in emergency situations that emerge in agricultural economic crisis (Díaz-Caneja, 2004), which originates an inevitable economic policy where the optimum is the establishment of ex ante government policies instead of this more expensive ex post aid (Innes, 2003). On the other hand, Meuwissen et al. (1999) justify government intervention through risk reduction public instruments or through aids when risk has more systemic characteristics.
Anderson (2003) argues that farmers are exposed to many risks, and there is often a lack of instruments to manage them correctly. The solution to this problem implies many strategies (prevention, mitigation, adaptation) and dispositions (informal, market based, public) to face risk, and the instruments have to consider the sources and characteristics of agricultural risk. Innes (2003) and Hardaker et al. (2004) suggest considering first auto selection as a mechanism to manage risk, which is conceived as the farmers´ acceptation of real or subjective risks. Innes (2003) concluded that aids or ex ante compensations contribute better to select those producers who assume risk and improve efficiency of public spending, in comparison to those that guarantee a generalized support once the event has occurred. Auto selection is a useful filter to select farmers with the right of being supported by the government in developed economies, avoiding the excessive risks of those who are drawn from being recipients of such support (ENESA, 2004).
The multivariate analysis techniques (McFadden, 1974; Altman et al., 1981; Jobson, 1992) are widely used among diverse disciplines such as financial economy, biotechnology, environment, agronomy, chemistry and software engineering. In financial economy, research is focused in predicting the probability of bankruptcy in financial markets (Johnsen and Melicher, 1994; Lennox, 1999; Westgaard and Wijst, 2001; Grunert et al., 2005; Bandyopadhyay, 2006; Chi and Tang, 2006). In the wine industry, discrete choice models are centered in consumers preferences and purchase choice (Morey et al., 2002; Skuras and Vakrou, 2002; Ho and Gallagher, 2005; Rodríguez et al., 2009). Using a sample of 104 wineries and restrained to logit models, Lobos and Viviani (2008) and Lobos (2009) propose a model to predict the probability to use public instruments in Chilean wine industry.
This research is an extension of previous works and its contribution lies in the generation of logit and probit models comparing the Chilean wine producers willingness to use these public instruments for a smaller sample. The main objective of this study is to identify the variables that influence the probability to use public instruments in Chilean wine industry, through comparative analysis of logit and probit models.
MATERIALS AND METHODS
The sample
The data used in this research was compiled between January and October of 2007 through the application of a questionnaire about risk sources in Chilean wine industry (see Lobos, 2009). The questionnaire has seven sections and was applied in companies located in most of the wine producing valleys of Chile. Each measurable variable was captured through indicators, which were measured using Likert type scales of five and seven points. In other cases open and closed questions were used (dichotomic and multiple options), and interval and nominal scales. In this investigation a sample of 84 wineries was used, smaller than the one used in Lobos and Viviani (208) and Lobos (2008) works. Wineries not included in Chilean Wine Industry Directory(CCV, 2010), were eliminated from the original sample. The data was processed using EViews 6 and SPSS 15.
Dependent and explanatory variables
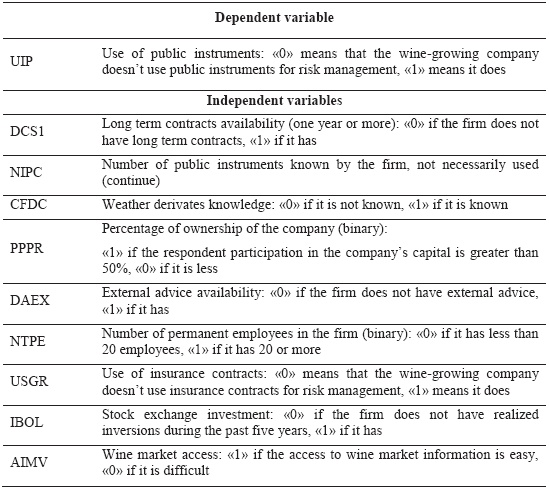
With the objective of contrasting the influence of the principal explanatory variables over the decision of using public instruments, the models binomial logit and probit were considered, in which the use of public instruments was introduced as dependent variable, and various socioeconomic variables and sources of risk were introduced as explanatory variables (see Table I).
TABLE I
Definition of the dependent and independent variables in the logit and probit models
Definição das variáveis dependentes e independentes nos modelos logit e probit
The model
The logit and probit models are usually estimated by the method of maximum likelihood (Greene, 1999; Wooldridge, 2006) originally proposed by Fisher (1922) as a ical estimation method of the parameters associated with density functions or random variables probability. Let Υi be defined as a random variable with probability function f(y;β) where β is an unknown parameter. In a binary choice model Υi takes only two values: 1 if there is success and 0 otherwise. We are interested in the response probability (Lobos et al., 2010):
 (1)
(1)
In expression (1), X is a vector of explicative variables and β' is a vector of parameters which includes the intercept. Function G takes only values between zero and one 0<G(z)<1, where Z is a real number obtained from Z = β'x = β0+β1x1+...+βkxk . In the logit model function G is the cumulative distribution function (CDF) of the standard logistics:
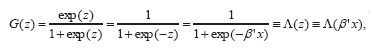 (2)
(2)
In the probit model, function G is the cumulative distribution function (CDF) of a normal random variable:
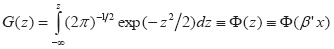 (3)
(3)
To evaluate the goodness-of-fit of the models different statistical tests were used: McFaddens R2 (McFadden, 1973), Pearsons chi-square (Hosmer and Lemeshow, 1980), Akaikes Information Criterion, AIC (Akaike, 1974), Bayesian Information Criterion, BIC, or Schwarz Criterion (Schwarz, 1978), Hannan-Quinn Criterion, HQC (Hannan and Quinn, 1979), Likelihood Ratio (LR), -2 Logarithm of the Likelihood (-2LL), Cox & Snell R2 and Nagelkerkes (1991) adjusted R2.
It is possible to evaluate the global predictive power of the logit and probit models using Receiver Operating Characteristic (ROC) curve analysis (Lloyd, 1998; Cai and Pepe, 2002; Zhou and Castelluccio, 2003). The area under the ROC curve can then be interpreted as the probability that in the presence of a couple of observed cases like 1 and 0 the test would classify them correctly (Hanley and McNeil, 1982).
Characteristics of the companies in the sample
The sample includes wineries located in the main wine producing valleys of Chile: Aconcagua, Maipo, Rapel, Curicó and Maule. In 32 companies there were less than 12 permanent workers and in 52 there were more than 12 workers. 51 companies showed sales for less than US$ 1 million and 29 declared sales for more than US$ 1 million. 21% of the small wineries have used public programs or instruments of development, while on the other hand 79% of the large wineries have used them (see Table II).
TABLE II
Characteristics of the wine-growing companies included in the sample
Características das empresas vitícolas incluídas na amostra
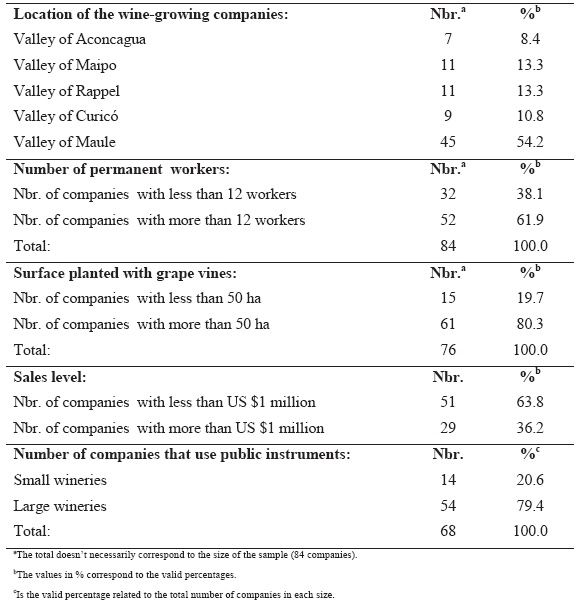
In this research companies were grouped in small and large wineries: less than 50 ha and more than 50 ha, according Servicio Agrícola y Ganaderos ification of a vineyard considering surface planted with grape vines (SAG, 2007). In addition wineries were grouped according sales level (less or more than US $1 million) and number of permanent workers (less or more than 12 workers). To measure linear relation between surface planted and sales level, and surface planted and number of permanent workers, Spearmans rho correlation coefficient was applied. Considering that a significative correlation was observed (p<0.01) then three criteria of ification might be considered to be substitutes.
RESULTS
Significant variables were long term contracts availability (DCSI) and the number of public instruments known by the firm (NIPC), weather derivates knowledge (CFDC), Percentage of ownership of the company (PPPR), external advice availability (DAEX) and number of permanent employees in the firm (NTPE). Use of insurance contracts for risk management (USGR), stock exchange investment (IBOL) and access to wine market information (AIMV) turned out to be not significant variables.
The estimated parameters and the results of z-statistic of all the variables included in the models generated are shown in Table III. The sign on DCSI is positive and significant at the 1% level. This result suggests that winegrowers are more willing to use public instruments when the vineyard has long term contracts availability. The sign on NIPC is positive and significant at the 1% level, which indicates that winegrowers perceive more the need of using public instruments when the number of known instruments is higher. The sign on CFDC is negative and significant at the 5% level, suggesting that if winegrowers think to have weather derivates knowledge, they will be less willing to use public instruments. The sign on PPPR is positive and significant at the 5% level, indicating that if winegrowers ownership is higher to 50%, they are more willing to use these instruments. The sign on DAEX is positive and significant at the 5% level, implying that winegrowers are more willing to use public instruments when the company has access to external advice. Finally, the sign on NTPE is positive and significant at the 5% level, indicating that if the number of permanent employees is more than 20, then winegrowers are more willing to use public instruments.
TABLE III
Results of the multiple regression models estimated via Maximum Likelihood (ML)
Resultados dos modelos de regressão múltipla estimados pelo método Maximun Likehood (ML)
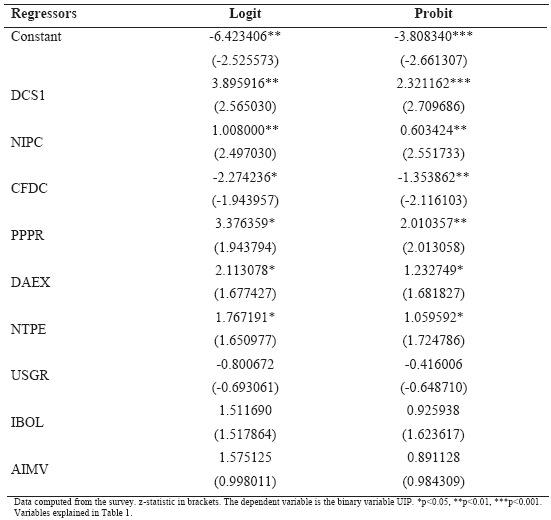
The sign on USGR is negative in logit and probit models. This result, even though it is not statistically significant, indicates that winegrowers are less willing to use public instruments when the company is using insurance contracts. The positive sign on IBOL indicates an increase in the probability of using public instruments if the company has made investments in stock exchange markets during the past five years. Lastly, the positive sign on AIMV suggests that if winegrowers perceive that the access to wine market information is easy, then the probability of using public instruments would increase.
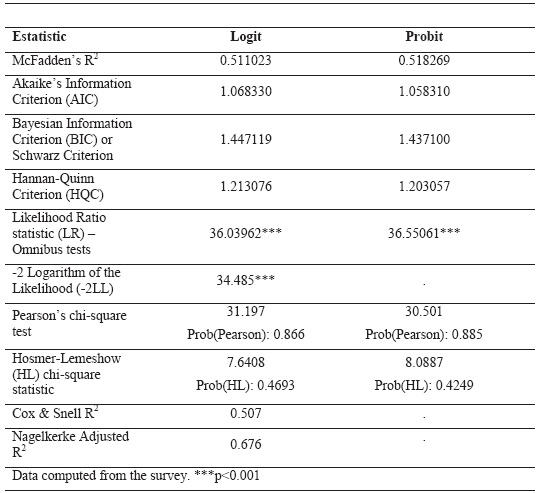
The highest pseudo McFaddens R2 and the lowest values of the AIC, BIC, HQC criteria suggest that the probit model is more suitable than the logit model to explain the willingness to use public instruments to promote productivity in the Chilean wine industry. The LR and -2LL statistics indicate that the logit and probit estimations are statistically significant to the value p<0.001. The value chi-square calculated is not significant for Pearsons chi-square test and Hosmer-Lemeshow (HL) for the logit and probit models, indicates that the fit of both models is adequate to predict values that are not significantly different from the observed values. Finally, the values in Cox & Snell R2 and adjusted R2 Nagelkerke indicate that in the logit model an important percentage of the variance is explained by the variables of the model (see Table IV).
TABLE IV
Goodness-of-fit evaluation of the models estimated via Maximum Likelihood (ML)
Avaliação do ajustamento dos modelos estimados pelo método Maximum Likehood (ML)
The results shown in Table V indicate that the comparison of the forecasted results with the data observed through a ification table implies that the global correct prediction is 84.31% for logit and probit models. On the other hand, the sensitivity (82.76%) is lower than the specificity (86.36%) for the cut-point of 0.50. The area under the ROC curve suggests that there is a probability of 84.60% that considering two companies, one using public instruments and the other not, the test will ify them correctly. Fig. 1 shows the ROC curve for the logit and probit models estimated.
TABLE V
Expectation-Prediction evaluation for binary specification of the models estimated via Maximum Likelihood (ML) method
Avaliação do expectativa-previsão para especificações binárias pelo método Maximum Likehood (ML)
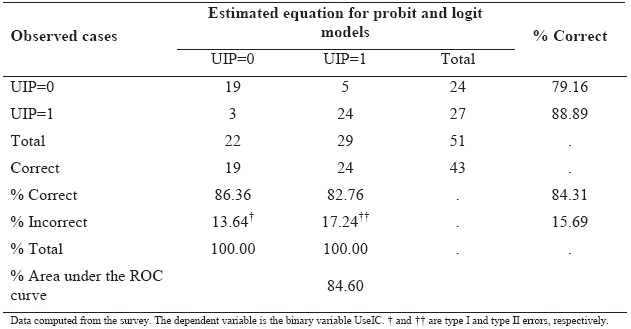
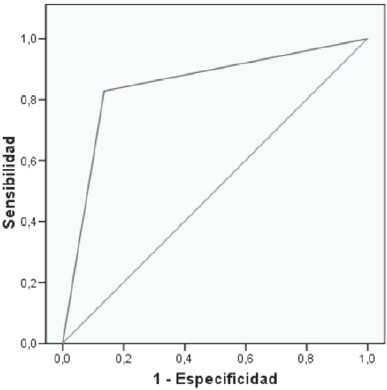
Figure 1.ROC curve for binary specification of the models estimated via Maximum Likelihood (ML) method.
Curva ROC para especificação binária dos modelos estimados pelo método Maximum Likehood (ML)
DISCUSSION
The main contribution of this study is to facilitate business management in the wine industry, through an empirical investigation that allows to model Chilean vineyard growers behavior respect to the use of public instruments to promote productivity. The study is necessarily exploratory, as like most exploratory studies the results are based on a sub-optimal sample. The sample used here is small (N=84) but fairly homogenous in terms of characteristics such as production processes, location and markets for the wine.
This investigation has also shown the usefulness of discrete choice models (logit and probit) in identifying the individual characteristics that influence the probability of using public instruments in the wine-growing industry management. The analysis allows inferring about the influence of a set of socioeconomic variables and the winegrowers own perceptions have on the willingness to use public instruments. As it is suggested in the literature (Amemiya, 1981; Maddala, 1996) the coefficients of probit model are related to approximately 0.6 of the logit estimators.
In general, the sign of the coefficients confirm the previous perception about the factors that positively influence on the probability of using public instruments. This is, there is more willingness to use these instruments when wineries have long term contracts with their clients (one year or more), when the number of public instruments known by the firm is higher, when the percentage of ownership of the winegrower is more than 50%, when the firm has access to external advice and when there are more than 12 permanent employees in the firm. The relations described seem to agree with previous perception and economic theory. The existence of contracts with longer durations decreases risk and the uncertainty over future cash flows, allowing increasing the willingness to use public instruments to improve management in middle term. In the case of the number of instruments known by the firm, the better the perception about their utility, the greater the disposition to use them. The positive relation between the willingness to use public instruments and the winegrowers ownership of the firm could be reflecting an Agency Problem, or a conflict of interest arising between shareholders and managements because of differing goals. The access to external advice allows decision makers to be more informed about the variety and availability of these instruments for business management, contributing positively to the use of them. Finally, wineries with more than 12 permanent employees are the biggest ones, and have more access to information and public and private nets, which impacts positively a conjoint formulation and postulation to some instruments specially those related to technological visits, access to international wine fairs, experts visits and assistance to international congresses.
The knowledge of weather derivates functioning influences negatively on the probability of using public instruments. This could be explained because weather derivates are relatively new instruments for financial coverage, and those who normally know them are decision makers from wineries that have a business management more oriented to market instruments, and usually participate in insurance contracts and forward transactions. The variables use of insurances for risk management (USGR), stock exchange investment (IBOL) and access to wine market information (AIMV) turn out to be not significant in the models.
The results of the goodness-of-fit indicate that in all the evaluated models of regression a good global fit is achieved, with a preference towards the probit over the logit model. Nevertheless, both the indicators of the ification table and the area under the ROC curve allow to deduce that the global predicting power of the logit and probit models is high.
References
Akaike H., 1974. A new look at the statistical model identification.IEEE Transactions on Automatic Control, 19, 716-722. [ Links ]
Altman E.I., Avery R.B., Eisenbeis R.A., Sinkey J.F., 1981. Application of classification Techniques in Business, Banking and Finance. J.A.I. Press Greenwich CONN, USA. [ Links ]
Amemiya T., 1981. Qualitative response models: a survey. Journal of Economics History, XIX, 1483-1536. [ Links ]
Anderson J.R., 2003. Risk in rural development: challenges for managers and policy makers. Agricultural Systems, 75, 161-197. [ Links ]
Anderson J.R., Hardaker J.B., 2003. Risk aversion in economic decision making: pragmatic guides for consistent choice by natural resource managers. In: Wesseler, J., Weikard, H.P., and Weaver, R. (eds.) Risk and Uncertainty in Environmental and Natural Resource Economics, Edward Elgar, Cheltenham, p. 171-188. [ Links ]
Antle J.M., 1987. Econometric estimation of producers' risk attitudes. American Journal of Agricultural Economics, 69, 3, 509-522. [ Links ]
Bandyopadhyay A., 2006. Predicting probability of default of Indian corporate bonds: logistic and Z-score model approaches. The Journal of Risk Finance, 7, 255-272. [ Links ]
Bardsley P., Harris M., 1987. An approach to the econometric estimation of attitudes to risk in agriculture. Australian Journal of Agricultural Economics, 31, 112-126. [ Links ]
Binswanger H.P., 1981. Attitude toward risk, theoretical implications of an experiment in rural India. Economic Journal, 91, 867-890. [ Links ]
Binswanger H.P., Deininger K., 1997. Explaining agricultural and agrarian policies in developing countries. Journal of Economic Literature, 35, 1958-2005. [ Links ]
Cai, T., Pepe M.S., 2002. Semiparametric receiver operating characteristic analysis to evaluate biomarkers for disease. Journal of the American Statistical Association, 97, 1099-1107. [ Links ]
CCV., 2010. Directorio de la Industria Vitivinícola Chilena 2009/2010. Corporación Chilena del Vino / Vendimia, 232 pp. [ Links ]
Chi L.C., Tang T.C., 2006. Bankruptcy prediction: application of logit analysis in export credit risks. Australian Journal of Management, 31, 17-27. [ Links ]
Cox D.R., Snell E.J., 1968. A general definition of residuals (with discussion). J. R. Stat. Soc., 3, 248-275. [ Links ]
Díaz-Caneja M.B., 2004. Instrumentos de gestión del riesgo de mercado, aplicación al sector de la patata.Tesis Doctoral. Madrid, España. Universidad Politécnica de Madrid. 216 pp. [ Links ]
ENESA., 2004. Gestión del riesgo agropecuario en América Latina y El Caribe. Entidad Estatal de Seguros Agrarios. Ministerio de Agricultura, Pesca y Alimentación. Madrid, España. 225 pp. [ Links ]
Fisher R.A., 1922. On the mathematical foundations of the theoretical statistics. Philos. Trans. Roy. Soc. London, 222, 309-368. [ Links ]
Greene W.H., 1999. Análisis econométrico. 3ª ed., Prentice Hall, España. [ Links ]
Grunert J., Norden L., Weber M., 2005. The role of non-financial factors in internal credit ratings. Journal of Banking and Finance, 29, 509-531. [ Links ]
Hanley J.A., McNeil B.J., 1982. The meaning and use of the area under a receiver operating characteristic (ROC) curve. Radiology, 143, 29-36. [ Links ]
Hannan E.J., Quinn B.G., 1979. The determination of the order of an autoregression. Journal of the Royal Statistical Society, 4, 190-195. [ Links ]
Hardaker J.B., Huirne R.M.B., Anderson J.R., Lien G., 2004. Coping with risk in agriculture. 2nd ed., CABI Publishing, Cambridge MA, USA. [ Links ]
Ho F.N., Gallagher M.P., 2005. The impact of wine tasting on wine purchases: evidence from Napa, California. International Journal of Wine Marketing, 17, 44-53. [ Links ]
Hosmer D.W., Lemeshow S., 1980. A goodness-of-fit test for the multiple logistic regression model. Communications in Statistics, A10, 1043-1069. [ Links ]
Innes R. 2003., Crop insurance in a political economy: an alternative perspective on agricultural policy. American Journal of Agricultural Economics, 85, 318-335. [ Links ]
Jobson J.D., 1992. Applied multivariate data analysis. Vol. II: Categorical and multivariate methods, Springer–Verlag, New York, USA. [ Links ]
Johnsen T., Melicher R.W., 1994. Predicting corporate bankruptcy and financial distress: information value added by multinational logit models. Journal of Economics and Business, 46, 269-286. [ Links ]
Lennox C., 1999. Identifying failing companies: a re-evaluation of the logit, probit, and DA approaches. Journal of Economics and Business, 51, 347-364. [ Links ]
Lloyd C. J., 1998. Using smoothed receiver operating characteristic curves to summarize and compare diagnostic system. Journal of the American Statistical Association, 93, 1356-1365. [ Links ]
Lobos G., Viviani J. L., Schnettler B., Muñoz N., Reyes Á., 2010. Predicting probability to purchase insurance contracts in the Chilean wine industry: a logit and probit comparative analysis. Ciência e Técnica Vitivinícola, 25, 2, 41-51. [ Links ]
Lobos G. 2009. La gestion du risque dans lindustrie vitivinicole du Chili: modélisation logistique et simulation des risques specifiques. Thèse de Doctorat. Université Montpellier 1. [In French]. [ Links ]
Lobos G., Viviani J. L., 2008. Factores determinantes de la utilización de instrumentos públicos para la gestión de riesgos en Chile: un modelo logit binomial. Lecturas de Economía, 69, 2, 63-83. [ Links ]
Maddala G., 1996. Introducción a la econometría. 2ª ed. Prentice-Hall, México. 715 pp. [In Spanish]. [ Links ]
McFadden D., 1973. Conditional logit analysis of qualitative choice behavior. In: P. Zarembka (ed.), Frontiers in Econometrics, Academic Press, New York, USA. pp. 105-142. [ Links ]
Meuwissen M.P.M., Huirne R.B.M., Hardaker J.B., 1999. Income insurance in European agriculture. In: European Economy, European Commission, Directorate-general for economic and financial affairs, Reports and Studies, n°2, Luxembourg. pp. 1-15. [ Links ]
Nagelkerke N.J.D., 1991. A note on a general definition of the coefficient of determination. Biometrika, 78, 691-692. [ Links ]
Morey R.C., Sparks B.A., Wilkins H.C., 2002. Purchase situation modelling in wine selection: an evaluation of factors in an Australian context. International Journal of Wine Marketing, 14, 41-64. [ Links ]
Rodríguez M.C., Cáceres J.J., Guirao G., Cano V.J., 2009. Individual profiles and wine consumption patterns in Tenerife. A multinomial logit model. Spanish Journal of Agricultural Research, 7, 759-769. [ Links ]
SAG., 2007. Catastro vitícola nacional. Servicio Agrícola y Ganadero, http://www.sag.cl, 23 julio 2009. [ Links ]
Schwarz G.E., 1978. Estimating the dimension of a model. Annals of Statistics, 6, 461-464. [ Links ]
Skees J.R., Barnett B.J., 1999. Conceptual and practical consideration for sharing catastrophic/systemic risks. Review of Agricultural Economics, 21, 424-441. [ Links ]
Skuras D., Vakrou A., 2002. Consumers willingness to pay for origin labelled wine: a Greek case study. British Food Journal, 104, 898-912. [ Links ]
Westgaard S., Wijst N.V., 2001. Default probabilities in a corporate bank portfolio: a logistic model approach. European Journal of Operational Research, 135, 338-349. [ Links ]
Wooldridge J.M., 2006. Introducción a la econometría: un enfoque moderno. Segunda edición. Thomson: Madrid, España. 960p. [ Links ]
Zhou X., Castelluccio P., 2003. Nonparametric analysis for the ROC areas of two diagnostic test in the presence of nonignorable verification bias. Journal of Statistics Planning and Inference, 115, 193-213. [ Links ]
Acknowledgements
The authors acknowledge financial support from the Dirección de Investigación (DI) of the Universidad de Talca to the project nº E000382-2009 (Enlace Fondecyt), under the title « Modelando la percepción de los riesgos en la industria vitivinícola chilena ». They also appreciate the contribution of Marcelo Herrera, investigation assistant.
(Manuscrito recebido em 18.10.11. Aceite para publicação em 09.12.11)
