


Serviços Personalizados
Journal
Artigo
 Inglês (pdf)
 Artigo em XML
 Referências do artigo
 Enviar este artigo por email
Indicadores
-
 Citado por SciELO
 -
 Acessos
Links relacionados
-
 Similares em
SciELO
Similares em
SciELO
Compartilhar

 Permalink
Finisterra - Revista Portuguesa de Geografia
versão impressa ISSN 0430-5027
Finisterra no.108 Lisboa ago. 2018
https://doi.org/10.18055/Finis14723
ARTIGO ORIGINAL
Mainstreaming climate adaptation in spatial planning: the case of Baixa Pombalina in Lisbon
A integração da adaptação às alterações climáticas no planeamento: o caso da Baixa Pombalina de Lisboa
Comment inserer les modifications climatiques dans la planification: le cas de la Baixa Pombalina a Lisbonne.
Patrícia Ribeiro1; João Ferrão2; Júlia Seixas3
1PhD, Centro de Investigação em Ambiente e Sustentabilidade (CENSE), Departamento de Ciências e Engenharia do Ambiente, Faculdade de Ciência e Tecnologia, Universidade Nova de Lisboa, Quinta da Torre, Campus Universitário, 2829-516, Caparica, Portugal. E-mail: cpr@campus.fct.unl.pt
2Senior Researcher, Instituto de Ciências Sociais, Universidade de Lisboa, Lisboa, Portugal. E-mail: joao.ferrao@ics.ulisboa.pt
3Professor, Centro de Investigação em Ambiente e Sustentabilidade (CENSE), Departamento de Ciências e Engenharia do Ambiente, Faculdade de Ciência e Tecnologia, Universidade Nova de Lisboa, Lisboa, Portugal. E-mail: mjs@fct.unl.pt
ABSTRACT
Baixa Pombalina is the historical downtown area of Lisbon city, close to the Tagus estuary, accommodating many economic activities namely tourism. This paper assesses and maps the vulnerability of the area, at the neighbourhood scale, to flood episodes and sea level rise. The methodology outlines how the different components of vulnerability are tackled, while considering the importance of the local context in the definition of composite indexes. Twenty-two vulnerability hotspots were found, for which six adaptation options are proposed to be embedded into the Plano de Pormenor currently in place.
Keywords: Vulnerability assessment; sea level rise; urban floods; spatial planning; adaptation options.
RESUMO
A Baixa Pombalina é uma área histórica central da cidade de Lisboa, situada junto ao estuário do Tejo, onde se concentram diversas atividades económicas nomeadamente turísticas. Neste artigo é analisada e mapeada a vulnerabilidade desta área, ao nível da subsecção estatística, à ocorrência de inundações e à subida do nível médio das águas do mar. A metodologia usada mostra como foram determinadas as diferentes componentes da vulnerabilidade, assim como a importância do contexto local para a definição dos índices compósitos. Como resultados, obtiveram-se vinte e dois hotspots de vulnerabilidade, tendo sido propostas seis opções de adaptação a integrar no Plano de Pormenor em vigor para aumentar a resiliência deste território.
Palavras-chave: Análise de vulnerabilidade; subida do nível médio do mar; inundações urbanas; planeamento; opções de adaptação.
RESUMÉ
Ce centre historique de Lisbonne, où diverses activités économiques et touristiques se concentrent, ouvre directement sur l’estuaire du Tage. On analyse ici sa vulnérabilité par rapport aux inondations fluviales et à la possibilité d’une hausse du niveau marin. On montre comment ont été déterminées les diverses composantes de sa vulnérabilité, en distinguant vingt-deux aspects possibles et en proposant six options à intégrer au Plan détaillé en cours d ’élaboration, qui permettraient d’améliorer sa résilience.
Mots clés: Analyse de vulnérabilité; hausse du niveau de la mer; inondations urbaines; planification spatiale; options d’adaptation.
I. INTRODUCTION
Global climate change is altering the intensity and frequency of extreme events. According to IPCC (2012), climate modelling projects more frequent, longer and / or more intense heat waves or warm spells and more frequent warms days and nights, occurring in all parts of Europe but with the greatest increase in Southern and Central Europe. Concerning extremes in precipitation, more frequent events of high precipitation and fewer events of moderate or low precipitation are expected across Europe with drier conditions in the South and wetter in the North. An increase of extreme coastal events from sea level rise (SLR) and flash floods are expected to affect several European cities. Without adaptation, coastal flooding in the 2080s is projected to affect 5.5 million people per year in the EU27, with the Southern European region being one of the most affected (IPCC, 2014).
Cities face specific impacts depending on the way they are designed and the types of activities dominant within their boundaries. Urban centres, namely those located at low-lying areas such as Lisbon, with dense urban structures occupied by assets and population, are expected to deal with very high costs from these impacts if no adaptation options are considered. Our case study, Baixa Pombalina, is a central historical area of Lisbon, highly exposed to the impacts of SLR and urban floods, but the Plano de Pormenor (PP) (Urban Detailed Plan) in place does not consider specific adaptation options to cope with these phenomena.
Mainstreaming climate adaptation options into municipal spatial planning is a new policy domain that deserves special attention, because of its current non-mandatory condition, the lack of guidelines from the upper levels of the administration, as well as few scientific insights on how the options can be incorporated. Beyond this, local authorities have frequently insufficient finance mechanisms and technical expertise to invest in new fields of knowledge.
This paper aims to advance on how to integrate climate adaptation options into local spatial plans, supported by analytical assessment and policy procedures, with Baixa Pombalina as our case study. The hotspots of vulnerability to SLR and to the occurrence of urban floods are identified and mapped, using a Geographic Information System (GIS), and following the methodological framework from exposure, to sensitivity, to potential impacts and to adaptive capacity. Adaptation options focused on the hotspots at the neighbourhood level are delineated and the processes to integrate them into PP are proposed. We aim to contribute to the scientific debate on how mainstreaming adaptation options into municipal plans, through its material and documental content, using the results of a vulnerability assessment, while underlining the interactions among local spatial plans.
The article contains six sections. Section I introduces the problem and sectionII explains the main concepts underlying our research, while section III describes the study area. Section IV presents the methodology and the results on the vulnerability assessment for the Baixa Pombalina area to SLR and urban floods and section V elaborates on how to mainstream adaptation into the PP of the study area. Section VI presents the main conclusions and discusses some limitations of the analysis while further work is mentioned.
II. MAINSTREAMING CLIMATE CHANGE ADAPTATION IN MUNICIPAL SPATIAL PLANNING
The integration of climate adaptation policies and measures into spatial planning and decision-making processes is often referred to as “mainstreaming ”. In practice, this means that actors are searching for solutions that incorporate the adaptation into existing policy tools, e.g., taking into account the effects of climate change and deciding on the implementation of measures to increase the adaptive capacity in specific areas. Mainstreaming is considered as promoting more sustainable, effective and efficient use of resources than designing and managing policies separately from ongoing activities (Uittenbroek, Janssen-Jasen, & Runhaar, 2012). The incorporation of information and knowledge from vulnerability assessment into spatial planning should occur at all steps of the planning process (Manitoba Government, 2011): establishing a vision, setting goals, developing and implementing policies, stakeholders’ consultation and reviewing. Either the comprehensive spatial plans or the urban detailed plans can be used to achieve this, although in a complimentary way.
1. Pathway of change and land occupation strategies
Two important pathways of change can be considered to mainstream climate adaptation into spatial planning: incremental and transformational change (Roggema, Vermeend, & Dobbelsteen, 2012). Since incremental change focuses on actions aiming to maintain the essence and integrity of a system or a process at a given scale (IPCC, 2014), it slightly modifies the landscape. However, this change may not be sufficient to reach successful results. In these circumstances, a transformative pathway is required to change the fundamental attributes of a system to respond to climate impacts (IPCC, 2014). As it is too disruptive, these decision-making processes tend not to stay in “ transformational” mode for long periods of time.
According to Roggema (2009), two land occupation strategies, avoidance and minimisation, can be considered in spatial planning when adapting to climate change. In the first case, the location choice is the primary argument chosen to adapt to climate change, e.g. restrain land-use functions in areas with a higher exposure to the impacts of climate change, while in the second case other criteria than climate change, such as economic development, connectivity or attractiveness, are also considered.
At the municipal level, there are two fundamental approaches to spatial planning. A strategic approach concerned with the development of framework instruments for the entire municipality and a detailed planning approach dedicated to the development of specific areas within the municipality. Through the combination of these two approaches to spatial planning with the two types of land occupation strategies, Davidse, Othengrafen, and Deppisch (2015) argue that the comprehensive plans should focus on decisions about avoidance, while the detailed plans should deal with issues at a smaller geographical scale, since it is difficult in this case to include avoidance strategies. The detailed plans have the highest potential to incorporate minimisation strategies, by optimising the design to lower the sensitivity of functions to the impacts of climate change and adjusting physical circumstances to enable projected developments to adopt technical measures.
2. Barriers to mainstreaming climate change adaptation into local spatial plans
There are several barriers to the inclusion of adaptation options into spatial municipal plans, including its non-mandatory condition, the uncertainty associated with the downscaling of climate change scenarios, the scarce scientific insights on how adaptation can be integrated into planning tools, the inexistence of guidelines from central government and lack of political will for change, the urban planning traditions that ignore the issue of climate, a predominant culture of reactive management and insufficient technical skills and financing mechanisms (Measham et al., 2011; Lebel et al., 2012; IPCC, 2014; Davidse et al., 2015).
As noted by Measham et al. (2011), an important challenge for cities is the lack of scaled-down climate change information, as planners frequently do not have projections at the city scale and do not know how to deal with uncertainty. Also, relevant information about territorial vulnerability within municipalities to climate impacts is scarce. Mainstreaming adaptation requires awareness-raising and interaction with relevant stakeholders, so experts and planners need to build mutual trust and involve all the interested parts, in order to legitimate the adaptation options. Finally, from the perspective of the local municipal council the high number of demands placed by the population to the local executives can hinder important issues, such as climate adaptation. Besides, political decision-making is often made on short term interests. Regarding financial aspects, municipalities are often highly constrained in terms of their capacity given the wide range of activities in which they are involved (Measham et al., 2011).
The use of a GIS tool to identify the vulnerability hotspots at the neighbourhood level for Baixa Pombalina to SLR and urban floods showed a clear contribution to overcome some of the current obstacles to mainstream climate adaptation into local spatial plans, by (i) facilitating the spatial data clearance with interest to assess the impacts and the adaptive capacity of the area, regarding different components from social to economic to cultural; (ii) understanding the drivers beyond the critical impacts and the lack of adaptive capacity at each spatial unit; (iii) allowing the visualisation of the spatial distribution of impacts and adaptive capacity at a very detailed unit, highlighting critical areas of intervention while taking into account its context; (iv) raising the planners' and policy makers’ awareness and confidence for local-specific adaptation responses, avoiding ineffective measures. After implementation of adaptation options, GIS tools may also be used to monitor how the vulnerability of the area is evolving.
3. Adaptation options to sea level rise and urban floods
Central governments can help local authorities to integrate SLR into their comprehensive plans in several ways, namely: authorizing or requiring local governments to consider climate impacts in spatial plans; encouraging or demanding municipalities to use an extended planning time frame, as the effects of SLR may not be felt for decades (e.g., planning for future development over the next 50 years, rather than the current practice of planning for the next 10 or 20 years); providing guidance about strategies to be considered in these plans, and establishing regional estimates of projected SLR over specific time-frames. Since local governments use zoning in municipal spatial plans to control development, this approach may act as powerful regulation creating a “SLR overlay zone” for most vulnerable areas to the impacts of SLR. Overlay zoning is a tool that establishes an additional layer of regulation within an existing base zone, considering the specific characteristics of that zone (Grannis, 2011). Overlays could impede or limit the expansion of operating infrastructures, prohibit or condition the rebuilding of damaged structures, or require that rebuilt structures should be elevated. It can be created based upon government’s adaptation goals to SLR, e.g., protection, accommodation and conservation. A protection zone can be conceived for areas with critical infrastructure and dense development, having few options for adaptation like Baixa Pombalina (Ambrette, 2013).
Concerning flooding, zoning can either be used to relocate infrastructures, minimizing the disruption during floods or ensuring that the emergency services facilities are designed to be operational (Manitoba Government, 2011). Municipalities can regulate floodplains in order to control development and implement adaptive measures. The floodplain must have good management practices, e.g. limit the uses allowed, plan for infrastructures to cope with floods, impose design requirements on development (structures elevated, anchored and constructed in materials resistant to water), detail the permissible uses and other activities that can be implemented to increase the resilience to flood impacts, like adequate green space, in order to facilitate drainage (Grannis, 2011).
Summarizing, mainstreaming climate change adaptation into spatial planning is a recent policy domain, especially at the municipal level, needing to be fully developed. Different adaptation approaches can be followed depending on the characteristics of the study area. In urban coastal areas - including historic districts, usually the adaptation goal is to protect.
III. STUDY AREA: BAIXA POMBALINA
Lisbon is situated at the western coast of the country, close to Tagus Estuary with a 19km riverfront. The Lisbon waterfront is highly exposed to the occurrence of several phenomena, namely floods, especially flash floods and river floods that may be aggravated when combined with SLR phenomenon (CML, 2012). Baixa Pombalina is an historical area located near the Tagus Estuary. It is densely occupied with classified buildings and strategic infrastructures and facilities such as public squares, one fluvial station and several underground stations, ministries buildings, many tourist facilities and shopping, that can be seriously threatened by the impacts of climate change.
In 2004 and 2016, Baixa Pombalina was included in the Portuguese tentative list to the World Heritage Committee. Presently, the area is included in the Conjunto de Interesse Público da Lisboa Pombalina (Public Interest Area of Lisboa Pombalina), a broader classified area with very strict requirements regarding intervention.
The study area has two municipal spatial plans that cover its territory: the Plano de Pormenor (PP) and the Lisbon Plano Diretor Municipal (PDM). The Municipality of Lisbon developed the PP in 2011 focused exclusively on this area of the city. This plan identifies the risk of SLR and urban floods, but does not consider any adaptation option to face the impacts under different climate scenarios. The Lisbon PDM, a comprehensive plan in force since 2012, included some adaptation measures mostly related with the retention of water upstream and to promote the infiltration capacity of the soil, in order to avoid the flooding of the sewage system. However, these measures are not local-specific for Baixa Pombalina area.
Lisbon has also a Municipal Strategy for Climate Change Adaptation (EMAAC), approved in July 2017. The EMAAC contains adaptation options to be considered at the municipal level and refers, for the Urban Detailed Plans in force before 2012 (date of the Lisbon PDM approval), that some adaptation options must be integrated in these plans when changing or revising it. Three generic adaptation options from the EMAAC must be considered to tackle the impacts of SLR and urban floods in the Baixa Pombalina area, namely: study the storm surge effect and adapt the riverfront; provide solutions to control the pluvial water at the origin and adopt solutions that increase the permeability of the soil.
Figure 1 illustrates the Baixa Pombalina downtown area with contour curves divided at the subsection statistical level (79 polygons).
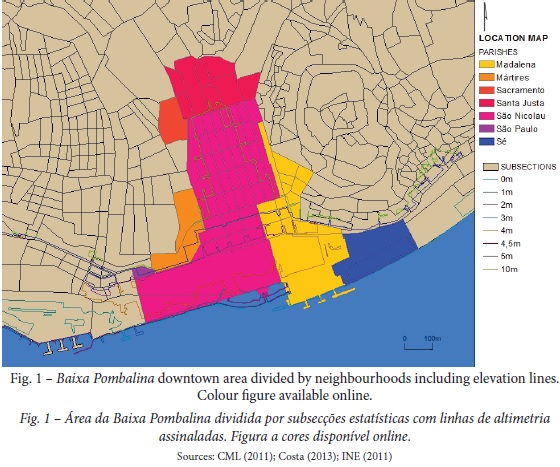
We have considered this micro level spatial unit, which is the smallest area with national census data, to tackle the local context of climate change impacts and adequate adaptive capacity, in order to consider specific adaptation options to integrate in the PP. This research is the first attempt to identify areas highly vulnerable to the impacts of SLR and urban floods, at the neighbourhood level, in Baixa Pombalina and to define adaptation options to incorporate into the PP.
IV. MAPPING VULNERABILITY HOTSPOTS
1. Methodology
Several studies have determined and mapped the vulnerability of territorial areas to climate change (UNDP, 2010; Rød et al., 2012; Fritzsche et al., 2014; Carter et al., 2016), with a view to support planners to identify hotspot areas to the impacts of climate change. In these studies, the geographical scale of analysis usually varies from the regional to the municipal level. Based on the vulnerability assessment, planners can tailor specific adaptation options to cope with the impacts and support effective decision-making. We adopt the concept of vulnerability defined in the 4th Assessment Report of the International Panel of Climate Change (IPCC, 2007) as the degree to which a system is susceptible to, and unable to cope with, adverse effects of climate change, including climate variability and extremes. Three main components contribute to vulnerability: sensitivity, exposure and adaptive capacity. The aggregation of sensitivity and exposure components determines the potential impact. Increasing the adaptive capacity of a system to the climate change impacts reduces its vulnerability.
Each component may be described by several indicators and combined into a composite index. An index may result from the numerical summarisation of vulnerability components of each spatial unit with the purpose of ranking the spatial units according to the level of vulnerability (Rød et al., 2012). It is a good practice to adjust the indicators to standard units through a standardization procedure, due to the very different nature of the underlying indicators, for example numerical versus categorical indicator values.
The aggregation method of the standardized indicators selected to characterize the sensitivity and adaptive capacity components consists of an un-weighted arithmetic aggregation, where indicators are summed and divided by the number of indicators to calculate the composite index as follows (formulas (1))(Fritzsche et al., 2014):
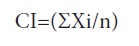
Where:
Xi represents the standardized values of each indicator
n the number of indicators and
CI the composite index of sensitivity or adaptive capacity
On the other hand, the exposure is determined by attributing the highest exposure score, per neighbourhood, from the two indicators, chosen to characterize it. Following the methodology applied by Fritzsche et al. (2014) and Carter et al. (2016), a vulnerability index is constructed as the un-weighted average of its components. Firstly, the arithmetic aggregation of sensitivity and exposure to calculate the potential impact component and lastly, also to adaptive capacity, to arrive at a composite vulnerability index [formulas (2), formulas (3)]:
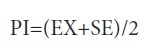
Where:
PI the potential impact
EX the exposure and
SE the sensitivity
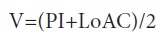
Where:
V is the vulnerability index
PI the potential impact
LoAC the lack of adaptive capacity
We use the lack of adaptive capacity (e.g. the values of adaptive capacity inverted) to determine the vulnerability index, since we aim to stress the vulnerability index as the current deficiencies and limitations of the society to cope with climate change. Afterwards, the results gathered at each spatial unit are mapped using a GIS, which is particularly recommended (UNDP, 2010) due to the advantages of the visual representation of the spatial distribution of the different vulnerability components. GIS mapping allows underlining the most vulnerable areas, designated as vulnerability hotspots, which is of utmost importance to assist organizations with responsibilities setting priorities and developing strategic planning concerning climate adaptation options. All this process must be transparent in terms of purpose, data and assumptions.
2. Application to Lisbon downtown
In order to determine the vulnerability of the Baixa Pombalina downtown area of Lisbon, at the neighbourhood level, the following steps were developed: (1) collection of information at the subsection statistical level; (2) definition of each indicator and data standardization; (3) aggregation of the indicators and determination of the vulnerability components and vulnerability composite index; and (4) mapping of the vulnerability hotspots using a GIS.
2.1. Selecting indicators
The literature review allowed for the identification of the various aspects that could influence the vulnerability to climate change of the Baixa Pombalina area (CML/DMEI/DEEE, 2010; CML, 2011; INE, 2011; CML/DMEI/DEP, 2013; Costa, 2013; RSB/SALOC, 2015). The identification of appropriate indicators covering key aspects of vulnerability is a great challenge, especially at neighbourhood level, where privacy concerns limit the access to data.
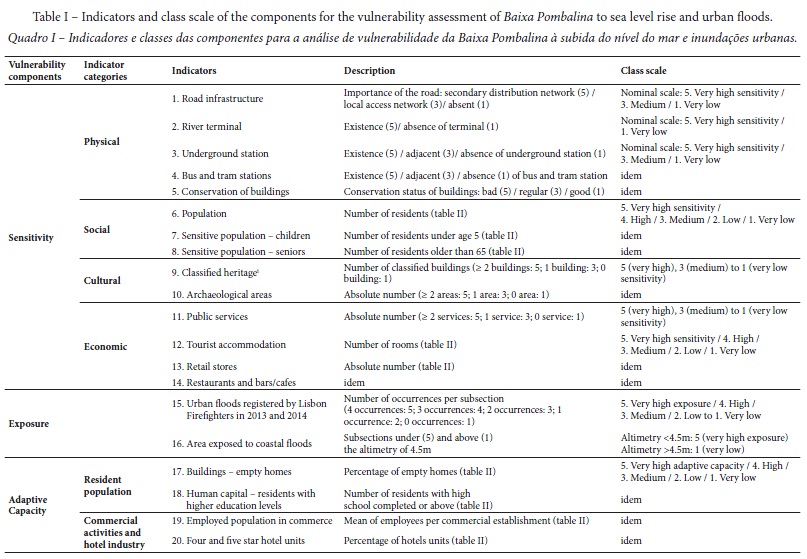
Taking the local context and data availability at subsection unit, twenty indicators were selected as the most relevant for the case study, covering the different components of vulnerability, as presented in Table I.
The sensitivity component includes fourteen indicators distributed in four categories: physical, social, cultural and economic. The sensitivity indicators were chosen considering the likely most affected users or assets of the area in case of an extreme event.
The exposure component comprises two indicators related to two phenomena: SLR and urban floods. A recent study elaborated for the Lisbon waterfront (Costa, 2013) cites a risk of flooding up to an elevation of 4.5m in 2100 in our study area. This elevation was estimated adopting the tipping points methodology, in the scope of the project “Urbanized Estuaries and Deltas. In search for a comprehensive planning and governance. The Lisbon case”. To determine the 4.5m tipping point, the convergence of various phenomena was considered namely: rising of sea level, storm surges, effects of progressive Tagus floods, and flash floods events within coastal lines that accommodate urban contexts. Besides these phenomena, other factors were also taken into account such as: tidal cycle effects, undulation and topographic correction of cartography. We adopted this tipping point because it has already been reached occasionally in the last years, namely in 2014.
The PDM of Lisbon classified the whole Baixa Pombalina area as having very high vulnerability to inundation risk (CML, 2012). Since we intend to distinguish the degree of exposure to flood episodes at the neighbourhood scale, the Lisbon Firefighters were asked for data on episodes of urban floods in order to identify the most affected subsections. The information available relates the number of occurrences per neighbourhood verified in 2013 and 2014, which required the intervention of the Lisbon Firefighters. Based on this information we have chosen two indicators for the exposure component: the location of the subsections in relation to the 4.5m curve of altimetry and number of occurrences of urban floods per subsection.
Several authors (UNDP, 2010; Carter et al. , 2016) have stated the adaptive capacity is far the most difficult one to be measured of the three components of vulnerability, because it varies at the micro scale and very often the indicators data are not available. We adopted a practical approach looking at the capacity to implement measures necessary for the reduction of the identified impacts. Taking the data available at the neighbourhood level, four indicators were selected, two related with the resident population and two associated with the economic capability of commercial activities and hotel industry situated in the study area.
The indicators for the resident population included: (i) the share of empty homes, as if buildings are unoccupied, people cannot intervene if an inundation occurs and third parties, like neighbours, may be seriously affected and (ii) the number of residents with high education levels, e.g., potentially better prepared to act in front of an extreme event. In fact, high education levels are considered to contribute positively to awareness of climate impacts and adaptation responses. However, as other studies have already assumed, the connection between education via awareness and response capacity is not direct, e.g., education can increase the ability to understand climate change information, but there’s no guarantee how the information is applied (Climate – ADAPT, 2015).
Concerning the main economic activities in Baixa Pombalina, we selected the mean of employees per commercial establishment in each subsection and the percentage of four and five star hotel units, as the number of employees in hotels is not available. We assumed that bigger commercial activities and accommodation units have more financial and organizational capacity to cope with extreme events. Indeed, hotel units with four or five stars have usually more demanding customers and are really concerned about their image and reputation. Beyond the compliance of emergency legislation, these establishments regularly adopt voluntary higher requirements in order to act coherently and efficiently, in the case of an extreme event, ensuring that the client interests are not adversely affected.
Lastly, we realize that there are some limitations in the indicators used because of the unavailability of administrative data at the subsection unit. The non-availability of data led the authors to seek indirect and less reliable sources of information and the use of indicators that work as proxies. However, acknowledging the above-mentioned constraints, we consider that the indicators selected are acceptable in an exploratory study conducted at a highly disaggregated level of information. In these circumstances the results should be interpreted with prudence, requiring the development of further and deeper studies based on field work.
2.2. Standardization and aggregation methods
We use a five-class scale for standardized indicator values, ranging from very low (1), low (2), medium (3), high (4) to very high (5), in terms of sensitivity or adaptive capacity, as shown in table II. To standardize the numerical indicator values to scores from 0 to 1, the min-max normalisation method was applied (Fritzsche et al., 2014). Afterwards, the normalised values were aggregated into the five-class scale. As shown in Table I, there are also numerical indicator values (indicators 9, 10, and 11), transformed to a three level scale (1, 3 and 5) since the use of the min-max normalisation method could represent some thresholds related to the very small number of results obtained.
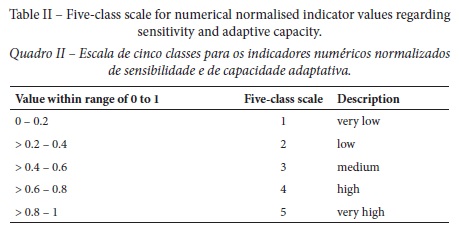
For the nominal values of physical sensitivity category, a rating scale adopting the values 1, 3 and 5 was defined to standardize the data. If the indicator only includes two possible options such as the existence or absence of a certain infrastructure [indicator 2], the outcomes are 5 and 1, respectively.
Concerning the exposure component, specific methods were employed following the nature of the indicators. For the case of SLR, the distinction between the neighbourhoods located under and above the 4.5m curve of altimetry was adopted and thus we assigned a dual exposure level, from very high and very low, respectively. As the number of occurrences of urban floods per subsection, registered in 2013 and 2014, ranges from 0 to 4, the five-class scale for these values was used, from very low (1) to very high (5) exposure, respectively. The composite exposure index was achieved by attributing the highest exposure score of each indicator per neighbourhood. Note that we are considering the most extreme conditions in terms of urban floods and SLR that can occur simultaneously.
Since we are working with very small spatial units and because of the unavailability of administrative data as referred in 2.1, we assumed that the different variables have similar importance and we applied equal weights to the indicators of sensitivity and adaptive capacity. Although the number of employees in commercial activities is high (about 4700), compared to the resident population (1856 in 2010), many employers adopt shift work. Additionally, as an increase in the share of empty homes decreases the adaptive capacity, indicator 17 had to be aligned before the determination of this component of vulnerability.
The sensitivity was also determined by category in order to better identify the most influential factors that contribute to the sensitivity of the area and since important results could be hidden when aggregating too many indicators. Each component of vulnerability is calculated separately and then aggregated following the methodology described to achieve the final vulnerability index.
Finally, we acknowledge that the methodology adopted has some constraints and difficulties, especially related to the lack of information at the subsection unit and also because a highly aggregated vulnerability value may conceal important underlying factors influencing overall vulnerability. Therefore, the results will be analysed with care and require validation through studies and qualitative methodologies (for instance: application of surveys by questionnaires, interviews and field work).
2.3. The components of vulnerability
The sensitivity composite index, after the sensitivity index per category (physical, social, cultural and economic), the exposure composite index and the lack of adaptive capacity index were calculated and mapped for the Baixa Pombalina downtown area. Figure 2 shows the GIS mapping of sensitivity indicators per category.
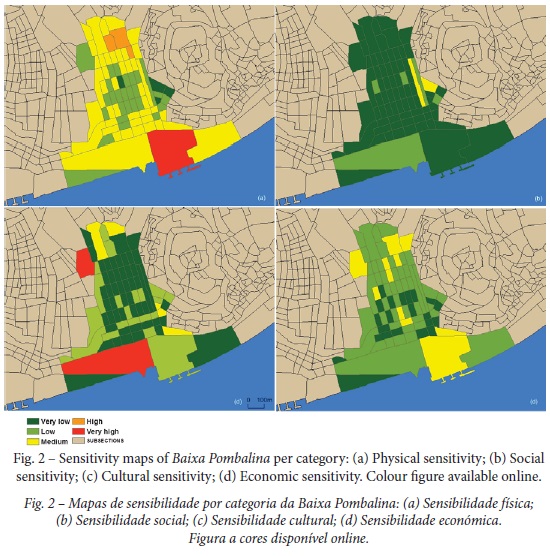
Figure 2a demonstrates the highest physical sensitivity is found close to the estuary, mainly justified by the existence of several terminal stations for public transports and important roads, and in northern part of the area due to both transportation infrastructures and conservation status of buildings. A medium level of physical sensitivity has been achieved for the majority of the neighbourhoods. The street network that crosses this area, beyond permitting access to the downtown, establishes the connection between the west side of the city to the east near the river. An interruption in the circulation due to an inundation may cause significant problems to the city traffic.
Figure 2b shows the majority of the neighbourhoods score very low on social sensitivity due to the fact the Baixa Pombalina area has a small number of residents (1856). It is an historical area dominated by commercial and tourist activities. Compared to the total population of the area, the number of children or the elderly is not significant (less than 405 people), widely varying within neighbourhoods. Although Baixa Pombalina presents a high dynamic in terms of local employees, visitants and commuters that cross the area using the local transport passenger network, we do not include this social aspect, because there is no information available at the neighbourhood level.
Regarding the cultural sensitivity map of the study area (fig. 2c), two spots were identified, in the subsections at the northwest part and near the Tagus Estuary, at the southwest, due to the concentration of archaeological areas and classified heritage. In the north and east parts, archaeological areas and classified heritage can also be found, but in a smaller number.
The highest scores related to the economic activities - tourist, commercial and services – can be found mainly in subsections at the centre of Baixa Pombalina, in a neighbourhood at the northwest, in three subsections on the northeast and in two neighbourhoods situated close to the Tagus Estuary on the southeast of the area (fig. 2d). The maximum score of medium economic sensitivity can be justified by the compensation of indicators extreme values when determining this index. In fact, public services, tourist accommodation and commercial activities are well represented in the Baixa Pombalina downtown area, but they show distinct spatial patterns as they are not placed in the same neighbourhoods.
Figure 3 presents the GIS mapping of sensitivity, exposure, potential impacts and lack of adaptive capacity.
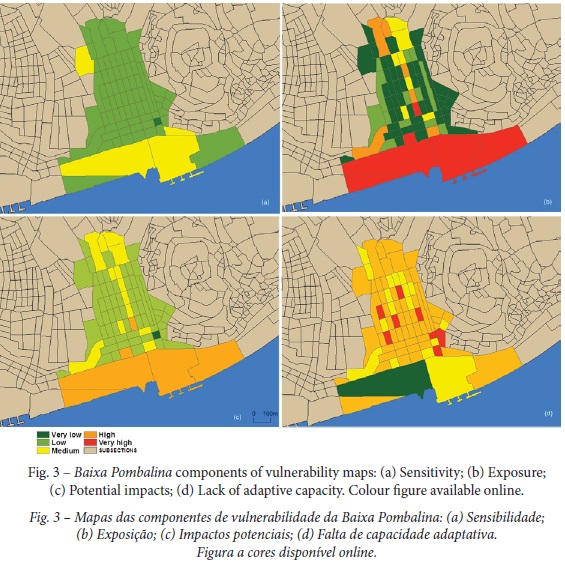
As referred in 2.1, the exposure index (fig. 3b) was achieved by attributing, per neighbourhood, the highest score of the two indicators. The SLR of 1.2m, when occurring simultaneously with other phenomena like storm surges, is expected to affect a large portion of this urban area until an altimetry of 4.5m in 2100, representing the highest exposure scores in the neighbourhoods located near the Tagus Estuary. River floods of this dimension have already happened episodically in the recent past (October 2014). Regarding the occurrence of urban floods, a central corridor, which goes from the north and continues towards the south, is being hit more frequently by inundations, presenting higher exposure scores than the adjacent subsections.
Figure 3c shows the potential impact component expected for the Baixa Pombalina area, calculated as the un-weighted average of the exposure and sensitivity indexes. The neighbourhoods with more potential impacts are those situated at the central corridor that goes from the north up to the subsections bordering the Tagus Estuary. The neighbourhoods in the north and in the central corridor present medium scores for potential impacts, since they suffer from the occurrence of inundations and concentrate important economic activities. A higher level is found in one subsection in this corridor due to the occurrence of floods. Not surprisingly, the neighbourhoods near the estuary show the highest levels as a result of the very high exposure to SLR and the concentration of activities and transport infrastructures.
The lack of adaptive capacity (fig. 3d), taken as the average of the four indicators (i.e., percentage of empty homes, number of residents with high school completed or above, mean of commercial employees per establishment and percentage of four and five star hotel units) presents medium scores in seventeen of the of seventy-nine Baixa Pombalina subsections. In one subsection at the southwest is found a very low level for this component mainly because it concentrates several hotel units and bigger commercial establishments, as well as a more educated resident population.
The remaining area shows high and very high scores. Several causes can explain these high levels of the lack of adaptive capacity as the reduced number of commercial establishments and hotel units close to the boundaries of the study area and the increase of empty homes at the centre and east parts of Baixa Pombalina. However, we must underline the difficulties to describe the adaptive capacity mentioned in 2.1. The inexistence of disaggregated data at this small spatial unit, concerning other socio-economic variables, such as income per capita and information regarding the awareness of the users about the climate impacts carries a limitation to more accurate knowledge on the adaptive capacity of the study area.
2.4. Vulnerability hotspots in Baixa Pombalina
To identify hotspots of vulnerability, e.g., neighbourhoods with high scores of vulnerability to climate change where interventions may be required, a vulnerability map summarizing the sensitivity, exposure and lack of adaptive capacity components was elaborated (fig. 4). From the seventy-nine subsections, twenty two subsections with high vulnerability scores were identified. These subsections are located in the northern (four), central (night) and south (night) parts of the Baixa Pombalina area, with three subsections bordering the Tagus Estuary.
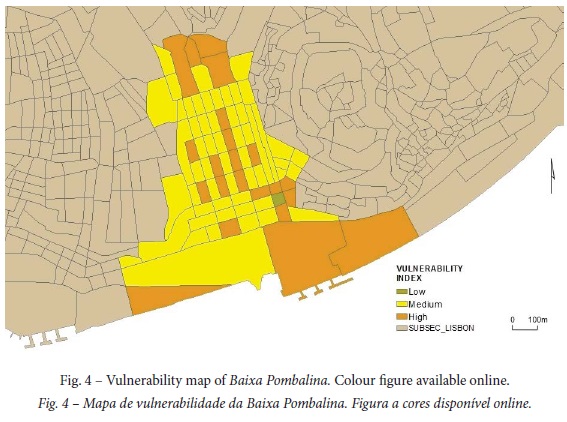
While the areas at the north and at the centre present higher vulnerability mainly due to the occurrence of urban floods, the subsections at the south are affected by the high exposure to the combined effects of SLR and storm surges.
A low level of vulnerability is found in one subsection at the east, corresponding to an area less exposed to the climate phenomena in analysis and presenting low scores of sensitivity. The remaining territory presents medium vulnerability. Overall, the results show a strong influence of the lack of adaptive capacity on the final vulnerability level, which require caution in the analysis, given limited knowledge and uncertainty faced in determining the adaptive capacity component, as previously referred.
Summing up, figure 4 shows three main vulnerability hotspots: i) the four subsections in the north of Baixa Pombalina and the ii) nine subsections in the centre, both areas identified as being severely affected by urban floods; and iii) nine subsections in the south part, three of them bordering the estuary, influenced by the two phenomena, urban floods and SLR. Therefore, these areas should be focused in the PP for climate adaptation purposes.
V. MAINSTREAMING ADAPTATIONS OPTIONS AT NEIGHBOURHOOD LEVEL
1. How to integrate climate change adaptation into spatial plans at local level?
Adaptation planning is an iterative process of analysing, selecting and prioritising options in response to climate change impacts (Reiter, Wedding, Hartge, LaFeir, & Caldwell, 2015). In the last years many approaches have been developed providing guidance to organisations in planning adaptation strategies, as the UKCIP Adaptation Wizard (UKCIP, 2013). It is a risk-based adaptation resource and consists of a five-step framework that starts with acquisition of data and commencement of legal and scientific research. The second phase entails analysing the current climate vulnerability, including consultation of key stakeholders to verify the best input from the scientific, law and policy context. The third phase involves assessing future climate vulnerability and the fourth the definition of adaptation options to tackle key climate impacts. The final step requires the evaluation of the results, e.g., monitoring the effectiveness of the policy and reviewing for taking into account new information on climate change as it becomes available.
In section IV a methodology to identify hotspots of vulnerability in the study area was presented, which generally corresponds to the steps 1 to 3 of the UKCIP Adaptation Wizard. In this section, we intend to develop an approach that can be integrated in the fourth phase of the UKCIP Adaptation Wizard aiming at identifying and selecting adaptation options at the neighbourhood level to be mainstreamed in the existing PP when revising it. It comprises four steps:
(1) Elaborating proposals of adaptation options to tackle the climate change impacts (sea level rise and urban floods) in the areas identified as vulnerability hotspots in Baixa Pombalina;
(2) Analysing the adaptation options in view of the municipal spatial planning system, identifying interactions between other planning instruments, the prevalent pathway of change (incremental versus transformation) and the type of occupation strategy (avoidance versus minimisation);
(3) Defining the procedure to operationalize the integration of the adaptation options into the PP, specifying the component of the spatial plan that should incorporate it;
(4) Building a synthesis matrix systematising the information obtained in the previous steps.
2. Proposals of adaptation options
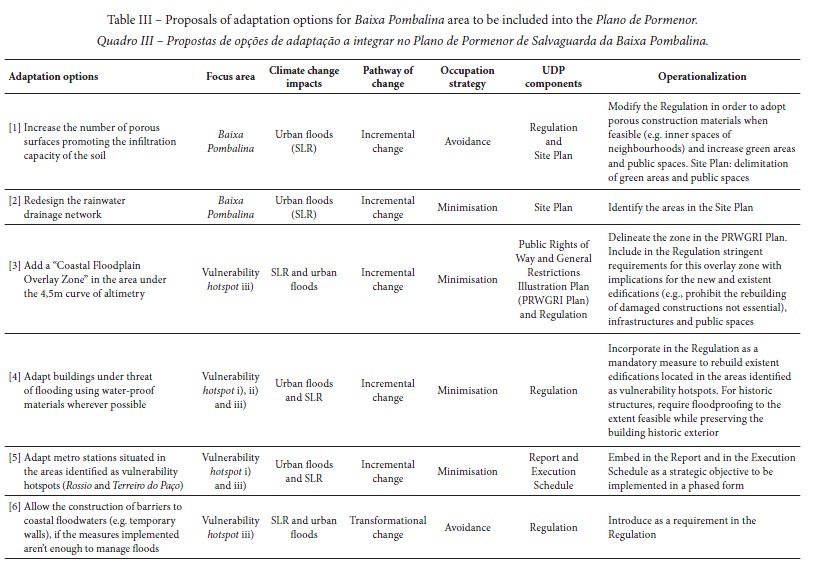
Following the methodological steps explained above, Table III presents proposals of adaptation options to be embedded in the existing PP. Five incremental and one transformational adaptation options are proposed and the respective focus area, the climate change impacts under stake, the occupation strategy, the PP components to be considered and the procedure for operationalization are described.
Note that the focus area of some options [1 – 2] is the whole Baixa Pombalina, since its implementation will contribute to reduce the vulnerability of a broader spatial area. These options have already been considered in the PDM, however they are referred to here because of their relevance to reduce the impacts of climate change on the study area and the need to integrate them in the future revision of the PP. Option 1 is clearly the integration of a solution to increase the permeability of the soil as called for in the Lisbon EMAAC.
Moreover, several adaptation options [3, 4 and 6] should firstly be envisaged at the municipal scale, before being incorporated into the PP, as their deployment affects contiguous urban areas vulnerable to similar climate change impacts. Also note that the Lisbon EMAAC proposes an adaptation option to study the storm surge effect in the riverfront and option 6 of Table III refers to the construction of barriers to coastal floodwaters, if the measures implemented are not enough to manage floods.
Concerning option 5, since it results from a change in the environmental conditions of the area, its integration in the PP will cause a change in the PDM in accordance with the Portuguese legal framework.
Bearing in mind that Baixa Pombalina is a historical urban consolidated area, avoidance strategies are more difficult to be taken into consideration. The proposed occupation strategies are mainly minimisation-oriented and the pathway of change is incremental in nature. Concerning transformational adaptation, the occurrence of extreme events in the area must be monitored and periodically analysed by the local government. Projections of expected future climate impacts must be considered to evaluate if anticipatory transformational adaptation is required [option 6].
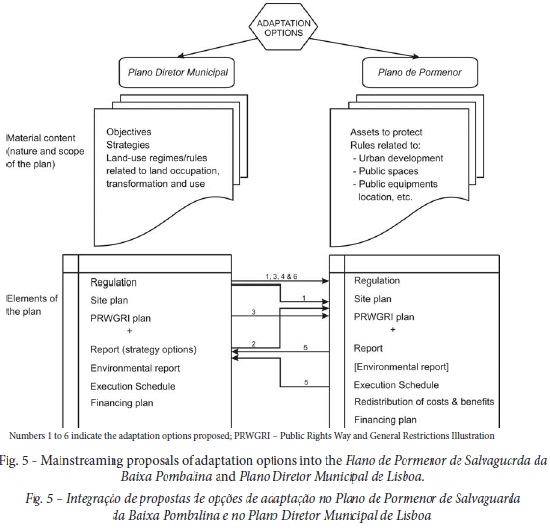
Figure 5 schematically presents how adaptation options can be embedded into local spatial plans through their documental contents. Since spatial planning tools must be mutually compatible, a change in a municipal plan for a specific territory will affect other plans elaborated for that area. The adaptation options proposed in Table III, to be mainstreamed into the PP, interact with Lisbon PDM according to fig. 5, e.g. some of them should be previously considered in the PDM, while others can be incorporated directly in the PP, changing afterwards the PP.
VI. FINAL REMARKS
The vulnerability of a dense central urban area to climate change phenomena must consider the local context with the purpose of identifying targeted and effective adaptation options, i.e. a tailor made solution rather than rolling out a “one size fits all approach”. Once the type of risk being assessed is identified, the analysis should focus and deploy the data available for very detailed spatial unit, as the case of neighbourhoods. This paper aims to map the vulnerability hotspots in the historical Baixa Pombalina downtown area of Lisbon at the neighbourhood level using a GIS, and to identify adaptation options to be embedded into the PP in order to improve the resilience of this area to the impacts of urban floods and SLR. We follow a state-of-the-art approach to determine the vulnerability, based on twenty indicators of sensitivity, exposure and adaptive capacity, to get new knowledge and new insights for one of the most important areas of Lisbon.
Twenty two subsections were found as vulnerability hotspots, mostly concentrated in the northern and central parts of Baixa Pombalina and by the riverside. The former are seriously affected by urban floods while the later may suffer the consequences of the combined effects of urban floods and SLR. The results show both the socioeconomic framework conditions and the capacity to adapt by the users of the area strongly influence its vulnerability, e.g., the dense urban fabric, dominated by commercial and tourist activities, the small number of residents, presenting a low level of education, and the existence of a significant percentage of unoccupied buildings.
Since the vulnerability index map can mask some important issues, the results should be analysed separately for each component to avoid over- or misinterpretation. This is the first attempt to determine the vulnerability and its components at a very detailed spatial unit to the impacts of urban floods and SLR for the Baixa Pombalina area using GIS. The use of a GIS tool highlighted the areas more affected by the climate impacts in study and supported the identification of local specific adaptation options to cope with these phenomena. This methodology can be replicated for other urban areas that intend to better understand its climate vulnerabilities at a disaggregated spatial unit.
Proposals of adaptation options for these hotspots include adaption of the lower levels of buildings to withstand controlled flooding and the creation of a “Coastal Floodplain Overlay Zone” to discourage development in high-vulnerability areas. The consideration of these options should be taken under a mainstreaming approach into the PP during its revision, namely through integrating the options in the plan and considering the interactions with other planning tools, mainly the PDM, since it establishes the strategy for the entire municipality and the successful implementation of some measures depends on adjacent areas. Then, the legal framework for local spatial planning instruments must be flexible and integrative, in order to allow the mainstreaming of adaptation options to increase the resilience of a territory, even if it is firstly proposed by a detailed plan. One important requirement to establish in the regulation, concerning local spatial plans, should be to include the elaboration of vulnerability assessments as a mandatory procedure before the plan approval and every four years, accompanying the status report for spatial planning. In fact, since the vulnerability of an area is dynamic, dependent on the adaptation options implemented, the climate hazards considered and its sensitivity, the exercise of mapping vulnerability hotspots using GIS must take place periodically. We also consider that every plan should set up a mechanism for monitoring and communicate the effectiveness of the adaptation options implemented. The disclosure of these results will inform the population about the local climate action and the importance of involving the various stakeholders to increase the adaptive capacity of the territory. An important implication of this research is to inform policy interventions which enable local governments to identify the vulnerabilities to climate change phenomena in specific areas and prioritise the adaptation options effectively. The outcomes of this investigation show how a vulnerability assessment can facilitate the incorporation of adaptation options into municipal plans and constitute a starting point for future analysis and discussions on local vulnerability in the Baixa Pombalina area.
A serious limitation we face refers to the inexistence of socioeconomic data at the subsection spatial unit, which is a constraint to fully characterize the sensitivity and the adaptive capacity of the area. Therefore, we strongly recommend the institutional responsibility, namely the municipality, to develop efforts to provide socioeconomic data, such as the annual income and the user’s awareness about climate change impacts, at that scale, to improve the certainty over the design and operationalization of adaptation measures.
We are aware of the constraints related to the data, indicators and the methodology used and we consider that further studies, using qualitative methodologies, must be developed to confirm the conclusions and the proposals presented in this paper.
As next steps to this study, a combination of the top-down methodology presented here with a bottom-up approach, through consultation of key stakeholders must be developed. In workshops with local stakeholders, the maps produced and the adaptation options proposed for incorporation into the PP may be improved, integrating local knowledge and data not available to the public. Lastly, the disclosure of the maps in an interactive way, through the local government’s website, would raise awareness about the local climate impacts and promote citizen engagement to contribute to the implementation of the adaptation options.
REFERENCES
Ambrette, B. (2013). Municipal Zoning Options for Adaptation to Sea Level Rise in Connecticut. The Nature Conservancy. Retrieved from http://scrcog.org/wp-content/uploads/hazard_mitigation/background_material/TNC_CT_Municipal_Zoning_Options-fo r-SLR.pdf [ Links ]
Carter, T., Fronzek, S., Inkinen, A., Lahtinen, I., Lahtinen, M., Mela, H… Simonsson, L. (2016). Characterising vulnerability of the elderly to climate change in the Nordic region. Regional Environmental Change, 16(1), 43-58. doi: 10.1007/s10113-014-0688-7 [ Links ]
Climate – ADAPT. (2015). Urban vulnerability to climate change in Europe – a map book (pilot version). European Climate Adaptation Platform. Retrieved from http://climate-adapt.eea.europa.eu/tools/urban-adaptation/generic-response [ Links ]
Câmara Municipal de Lisboa, Direção Municipal de Economia e Inovação, & Divisão de Estudos e Prospectiva. (CML/DMEI/DEP). (2013). Shape “ Hotéis_2013_PPBaixaPomb”: Levantamento dos Estabelecimentos Hoteleiros de Lisboa [Shape_Inventory of Tourist Accomodations at Baixa Pombalina Área]. Lisboa. [ Links ]
Câmara Municipal de Lisboa. (CML). (2012). Plano Diretor Municipal de Lisboa [Lisbon Municipal Director Plan]. Lisboa: Câmara Municipal de Lisboa. [ Links ]
Câmara Municipal de Lisboa. (CML). (2011). Relatório da Proposta de Plano de Pormenor de Salvaguarda da Baixa Pombalina [Baixa Pombalina Plano de Pormenor Report)]. Lisboa: Câmara Municipal de Lisboa. [ Links ]
Câmara Municipal de Lisboa, Direção Municipal de Economia e Inovação, & Departamento Emprego, Empreendedorismo e Empresas. (CML/DMEI/DEEE). (2010). Shape “RC_2010_ PPBaixaPomb”: Recenseamento Comercial de Lisboa [Shape_Lisbon Commercial Census at Baixa Pombalina Área]. Lisboa. [ Links ]
Costa, J. (2013). Urbanismo e Adaptação às Alterações Climáticas - As Frentes de Água [Urbanism and Adaptation to Climate Change – The Waterfronts]. Lisboa: Livros Horizonte. [ Links ]
Davidse, B., Othengrafen, M., & Deppisch, S. (2015). Spatial planning practices of adapting to climate change. European Journal of Spatial Development, 1(57). Retrieved from http://urn.kb.se/resolve?urn=urn:nbn:se:norden:org:diva-4261 [ Links ]
Fritzsche, K., Schneiderbauer, S., Bubeck, P., Kienberger, S., Buth, M., Zebisch, M… Kahlenborn, W. (2014). The Vulnerability Sourcebook: Concept and guidelines for standardised vulnerability assessments. Germany: Adelphi, EURAC & Z_GIS, University of Salzburg. Retrieved from: https://www.weadapt.org/sites/weadapt.org/files/legacy-new/knowledge-base/files/54c61b9fac123vulnerability-sourcebook-guidelines-for-assessments-giz-2014.pdf [ Links ]
Grannis, J. (2011). Adaptation Toolkit: Sea-Level Rise and Coastal Land Use. How Governments Can Use Land-Use Practices to Adapt to Sea-Level Rise. Georgetown Climate Center, Harrison Institute. Retrieved from: http://www.georgetownclimate.org/files/report/Adaptation_Tool_Kit_SLR.pdf [ Links ]
Instituto Nacional de Estatística. (INE). (2011). Censos 2011 [2011 Census]. Lisboa: Instituto Nacional de Estatística.
Intergovernmental Panel on Climate Change. (IPCC). (2014). Climate Change 2014: Impacts, Adaptation, and Vulnerability. Contribution of Working Group II to the Fifth Assessment Report of the Intergovernmental Panel on Climate Change. Cambridge, UK and New York, USA: CU Press. [ Links ]
Intergovernmental Panel on Climate Change. (IPCC). (2012). Managing the Risks of Extreme Events and Disasters to Advance Climate Change Adaptation. Cambridge, UK and New York, USA: CU Press. [ Links ]
Intergovernmental Panel on Climate Change. (IPCC). (2007). Climate Change 2007: Impacts, Adaptation and Vulnerability. Contribution to the Working Group II to the Fourth Assessment Report of the Intergovernmental Panel on Climate Change. Cambridge, UK: CU Press. [ Links ]
Lebel, L., Li, L., Krittasudthacheewa, C., Juntopas, M., Vijitpan, T., Uchiyama, T... Krawanchild, D. (2012). Mainstreaming climate change adaptation into develoment planning. Bangkok: Adaptation Knowledge Platform and Stockholm Environment Institute. Retrieved from: https://www.weadapt.org/sites/weadapt.org/files/legacy-new/knowledge-base/files/5027f1383bb01mainstreaming-climate-change.pdf [ Links ]
Manitoba Government. (2011). Planning Resource Guide: Climate Change Adaptation through Land Use Planning. Canada. Retrieved from http://www.gov.mb.ca/ia/plups/pdf/cca.pdf [ Links ]
Measham, T., Preston, B., Smith, T., Brooke, C., Gorddard, R., Withycombe, G… Morrison, C. (2011). Adapting to climate change through local municipal planning: barriers and challenges. Mitigation and Adaptation Strategies for Global Change, 16 (8), 889-909. doi: 10.1007/s11027-011-9301-2 [ Links ]
Regimento de Sapadores Bombeiros, & Sala de Operações Conjunta. (RSB/SALOC). (2015). Registo de inundações: anos 2013 e 2014 [Inundation occurrences in 2013 and 2014]. Lisboa: Regimento Sapadores de Bombeiros de Lisboa. [ Links ]
Reiter, S., Wedding, L., Hartge, E., LaFeir, L., & Caldwell, M. (2015). Climate Adaptation Planning in the Monterey Bay Region: An Iterative Spatial Framework for Engagement at Local Level. Natural Resources, 6, 375-379. doi: 10.4236/nr.2015.65035 [ Links ]
Roggema, R., Vermeend, T., & Dobbelsteen, A. (2012). Incremental change, transition or transformation? Optimising change pathways for climate change adaptation in spatial planning. Sustainability Journal, 4, 2525-2549. doi: 10.3390/su4102525 [ Links ]
Roggema, R. (2009). Adaptation to Climate Change. A Spatial Challenge. Netherlands: Springer. [ Links ]
Rød, J., Berthling, I., Lein, H., Lujala, P., Vatne, G., & Bye, M. (2012). Integrated vulnerability mapping for wards in Mid-Norway. Local Environment, 17 (6-7), 695-716. doi: 10.1080/13549839.2012.685879 [ Links ]
Uittenbroek, C., Janssen-Jasen, L., & Runhaar, M. (2012). Mainstreaming climate adaptation into urban planning: overcoming barriers, seizing opportunities and evaluating the results in two Dutch case studies. Regional Environmental Change , 3(2), 399-411. doi: 10.1007/s10113-012-0348-8 [ Links ]
United Nations Development Programme. (UNDP). (2010). Mapping Climate Change Vulnerability and Impact Scenarios. A Guidebook for Sub-National Planners. NYC: United Nations Development Programme.
United Kingdom Climate Impacts Programme. (UKCIP). (2013). The UKCIP Adaptation Wizard v 4.0. Oxford: UKCIP. Retrieved from www.ukcip.org.uk/wizard/ [ Links ]
Recebido: novembro 2017. Aceite: maio 2018.

