


Serviços Personalizados
Journal
Artigo
 Inglês (pdf)
 Artigo em XML
 Referências do artigo
 Enviar este artigo por email
Indicadores
-
 Citado por SciELO
 -
 Acessos
Links relacionados
-
 Similares em
SciELO
Similares em
SciELO
Compartilhar

 Permalink
Finisterra - Revista Portuguesa de Geografia
versão impressa ISSN 0430-5027
Finisterra no.98 Lisboa dez. 2014
ARTIGO ORIGINAL
Perception of thermal comfort by users of urban green areas in Lisbon
Percepção do conforto térmico pelos utilizadores de espaços verdes de Lisboa
Sandra Oliveira1 Teresa Vaz2 Henrique Andrade 3
1 NICIF, Faculdade de Letras, Universidade de Coimbra. Largo da Porta férrea, 3004-530 Coimbra. E-mail: sisoliveira@gmail.com
2 Centro de estudos Geográficos do instituto de Geografia e Ordenamento do territ ório, Universidade de Lisboa. E-mail: teresagvaz@gmail.com
3 Centro de estudos Geográficos do Instituto de Geografia e Ordenamento do Territó rio, Universidade de Lisboa
ABSTRACT
Green urban areas are a potential touristic attraction, providing opportunities for recreation and social interaction. In this study, two green areas in Lisbon were selected to investigate their influence on the thermal environment in and outside them and to analyse the usage of these parks in view of the perception of thermal comfort, the preferences and personal characteristics of the visitors. Measurements of temperature and relative humidity were carried out for several successive weeks in summer and in winter, in different locations around and inside the green areas. temperature differences between the green spaces and the surrounding areas were greater in hotter conditions and reached up to 7ºC difference at certain times on particular days. This cooling effect provided by green areas has a potential role in mitigating climate change impacts. In order to analyse the perception of thermal comfort and users’ preferences, face-to-face interviews were carried out simultaneously with measurements of weather parameters. In summer, a positive correlation between the measured values of temperature and relative humidity with people’s perception was observed. A significant association between individual’s characteristics and type of usage of the parks was also revealed, particularly related to age and gender. Understanding the relationship between weather parameters, people’s perception and visitors’ preferences is paramount to create green areas more attractive and beneficial for the urban environment.
Keywords: Urban green areas, park cool island, perception, thermal comfort, tourism, Lisbon.
RESUMO
Os espaços verdes melhoram o ambiente urbano e são potenciais atrac ções turísticas. Investiga-se a influência de dois espaços verdes de Lisboa nas condições térmicas em redor; verifica-se também se a percepção do conforto térmico dos visitantes, as suas preferências e características individuais condicionam o uso desses espaços. Realizaram-se medições de temperatura e humidade relativa, no Verão e no inverno, e calcularam-se desvios térmicos entre áreas verdes e ruas circundantes. Estes podem atingir 7ºC em determinados dias e horas (maiores diferen ças com temperaturas altas). Esta “ilha de frescura” dos espaços verdes tem um papel importante na mitigação dos impactes das alterações climáticas nas cidades. Para analisar a percepção do conforto térmico e preferências dos utilizadores, realizaram-se entrevistas presenciais em simultâneo com medições dos parâmetros meteorológicos. Verificou-se uma corre lação positiva entre a percepção dos visitantes e os valores de temperatura e humidade relativa nos meses de Verão e também uma associação significativa entre as características dos indivíduos, particularmente o género, a idade, e o tipo de utilização dos espaços verdes. a investigação da relação entre parâmetros meteorológicos, utilização dos espaços verdes e preferências dos visitantes, é fundamental para criar áreas mais atractivas e ben éficas para o ambiente urbano.
Palavras-chave: Espaços verdes urbanos, ilha de frescura, percepção, conforto t érmico, turismo, Lisboa.
RÉSUMÉ
Perception du confort thermique par les usagers des espaces verts de Lisbonne. Les espaces verts urbains améliorent l’environnement urbain et constituent des attractions touristiques. On a étudié deux espaces verts à Lisbonne, afin de déterminer leur influence sur les conditions thermiques environnantes et pour analyser l’influence de la perception de confort thermique sur leur usage par des visiteurs de diverses catégories. On a réalisé des mesures de température et d’humidit é, en été et en hiver, tant dans les espaces verts qu’autour d’eux. À certaines heures et à certains endroits on a enregistré des différences thermiques allant jusqu’à 7ºC, surtout quand il fait très chaud. L’effet « îlot de fraîcheur » pourrait jouer un rôle important, en cas de sensibles altérations climatiques. Pour analyser l’ impression de confort thermique et les préférences des utilisateurs, on a réalisé simultanément des entrevues et des mesures de paramètres météorologiques. Pendant l’été, on constate une corrélation positive entre les valeurs de temp érature et d’humidité et leur perception par les visiteurs, ainsi qu’une association significative entre les caractéristiques individuelles des utilisateurs (sexe et âge) et le type d’usage qu’ils font des espaces verts. Ces connaissances permettront de créer des espaces verts plus attractifs et amélioreront ainsi l’ambiance urbaine.
Mots-clés: Espaces verts urbains, î lot de fraicheur, perception, confort thermique, tourisme, Lisbonne.
I. INTRODUCTION
Green areas are recognized as important elements in urban areas, as they contribute to improve the urban environment (Shimoda, 2003; Georgi and Dimitriou, 2010; Cohen et al., 2012; Gago et al., 2013). Green spaces help to regulate the urban climate and to mitigate the Urban Heat Island (UHI) by creating a cooling effect (Lin et al., 2011; Oliveira et al., 2011; Choi et al., 2012; Lopes et al., 2013) that can also moderate the consumption of energy. furthermore, these areas contribute to the reduction of air pollution and noise levels, provide habitats to different species and increase biodiversity in cities, besides promoting social contact between inhabitants, thus having a positive influence on human health (Jauregui, 1990; Upmanis et al., 2001; Dimoudi and Nikolopoulou, 2003; Fang and Ling, 2005; Georgi and Zafiriadis, 2006; Parés-franzi et al., 2006; Yu and Hien, 2006; Lafortezza et al., 2009; Nardo et al., 2010; Haq, 2011; Cohen et al., 2012; Home et al., 2012; ). Green areas can also have an important role in climate change adaptation; the expected global changes may accumulate with the urban thermal effects, increasing the vulnerability of urban areas to the impacts of climate change (Patz et al., 2005; Wilby and Perry, 2006; Alcoforado and Andrade, 2008). in this context, the microclimatic influence of green areas in the surrounding areas, particularly the cooling effect in hotter seasons (Lafortezza et al., 2009; Zoulia et al., 2009; Oliveira et al., 2011; Cohen et al., 2012), can mitigate the effects of the estimated increase in temperatures and heat waves, whose frequency and intensity are expected to rise (Santos and Miranda, 2006; Parry, 2007; Alcoforado and Andrade, 2008); moreover, urban vegetation, particularly trees, also contribute to CO2 uptake (Akbari, 2002).
Additionally, green areas play an important role in recreation, providing noise protection and facilities to their users (Haq, 2011), either locals or tourists. The availability of amenities in the green areas is a relevant parameter for tourism activities in cities (Çalişkan and Matzarakis, 2013; Cianga and Popescu, 2013). Furthermore, the image of a destination is influenced by the weather conditions, particularly when affecting outdoor activities (De Freitas, 2003; Andrade et al., 2006; Çalişkan and Matzarakis, 2013), thus the climatic improvements that green areas provide to the urban environment represent an asset for tourism development. These spaces create microclimatic conditions that enable tourists to spend more time outdoors, contributing to the social and economic dynamics of the city (Haq, 2011).
Several studies have analysed the influence of weather and climate in tourism (De Freitas, 2003; Gómez Martín, 2005; Scott et al., 2009). additionally, the recent emphasis in climate change encouraged the development of studies focused on the potential influence of future climatic projections on tourism activities, its impacts, mitigation and adaptation strategies (Nicholls et al., 2006; Scott et al., 2009; e Ndler and Matzarakis, 2011; Kaj án and Saarinen, 2013; Matzarakis et al., 2013).
The urban tourism in central and southern Europe is also expected to be influenced by climate change, due to the projected increase of heat waves, and the decrease in air quality in urban areas (Nicholls et al., 2006; Lafortezza et al. , 2009). As the most important effects of climate on tourism occur at the micro scale (Matzarakis, 2001), green spaces, even the smaller ones, can play a relevant role in the adaptation of urban areas to climate change impacts.
The main purpose of this study was to investigate the relationship between weather conditions and green areas, in relation to the microclimatic effects of green areas in the surrounding environment and the perception of thermal comfort by the users.
The specific objectives of this study were:
i) to investigate the thermal effects of small green spaces in the surrounding area, in different seasons;
ii) to assess the perception of bioclimatic comfort of users in different green areas of Lisbon;
iii) to analyse the preferences of users in view of their characteristics and the conditions of the green spaces (vegetation, facilities, microclimatic conditions);
iv) to investigate the role of the thermal environment in the use of urban green areas.
II. MATERIALS AND METHODS
1. Study area
This research was carried out in Lisbon, the largest city of Portugal. Located on the edge of the Atlantic Ocean, Lisbon’s climate is typically Mediterranean, with hot and dry summers and mild winters (Alcoforado et al., 2006, 2009; Oliveira et al., 2011). The thermal pattern of the city is determined by the combination of different features, particularly the proximity to the Atlantic Ocean and to the Tagus River, the irregular relief and the urban morphology (Alcoforado, 1993; Alcoforado and Andrade, 2006). The UHI has its maximum intensity in the south of the city and occurs more frequently during the summer (2ºC by night and 1.8ºC by day), when wind speeds range from 2 to 6 ms-1 (Lopes et al., 2013). Even with weak regional winds the urban neighbourhoods near the river are influenced by the estuarine breezes that produce a cooling effect (Alcoforado et al., 2006, 2009). In late morning and early afternoon in summer, these areas can have temperatures that are, on average, 3.5ºC lower than the city center (Vasconcelos and Lopes, 2006; Lopes et al., 2013). The combination of the estuarine breezes and the weak regional wind, makes the core of the UHI move to the north of the city (Alcoforado et al., 2009).
Lisbon has a population of circa 540,000 (INE, 2011), distributed in an area of some 85 km2. The city includes 1,349 ha of green spaces distributed in 65 parks, representing 16% of the total area of the municipality (schilling, 2010). The Monsanto Park is the largest green area and occupies 900 ha. Lisbon has an average of
26.8 m2 of green areas per capita (Soares and Castel-Branco, 2007) and the small green areas of the type of a “neighbourhood park” are predominant (soares, 2006). As for tourism activities, the good weather, the seafront position and the historical and cultural heritage make of Lisbon a desired destination for tourists from all over the world. In the summer months the flow of tourists increases substantially, followed by a spring “peak” (Zarrili and Brito, 2013).
Two small green areas were selected for this study: the park Teófilo de Braga, in Campo de Ourique (green area a), and the park Braancamp Freire, in Campo dos Mártires da Pátria (green area B) (fig. 1). These green spaces are located in built-up areas of the city and have distinct characteristics, as described below:
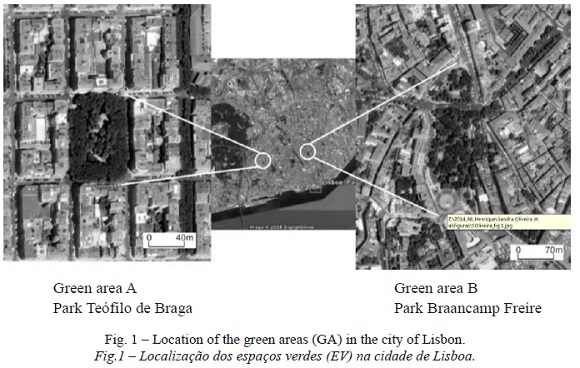
a) Park Teófilo de Braga (green area a) is located in a densely built-up area with an orthogonal geometry. It has a surface area of 2,400 m2, a rectangular shape and north-south orientation. Trees prevail over other types of vegetation, such as shrubbery and herbaceous plants, and the dominant tree species are, amongst others, Celtis australis, Gingko biloba, Tilia tormentosa, Aesculus hippocastanum and Metrosideros excelsia. The latter is a classified species due to its characteristics and “public interest”. The park has a playground, tables and benches facing different directions and a small lake. It is surrounded by tall buildings (15-25 meters high) with varied shapes, colours and construction materials, which are used for residential or commercial purposes.
b) Park Braancamp Freire (green area B) is located in a densely urbanized area, in the watershed between the valleys of two main avenues of the city. It has a surface area of 22,600 m2, in a north-south orientation and an irregular configuration, being crossed transversally by a road. It has a lake, where various bird species are found. Similarly to Park Teófilo Braga trees prevail over other types of vegetation, the dominant tree species being Sophora japonica, Tilia tormentosa, Ficus benjamina, Acer negundo, Chorisea speciosa, Gingko biloba, Grevillea robusta, Metrosideros excelsia, among others. The park has different types of facilities, namely a sports camp and a playground in the northern part and a restaurant and a paved square with a statue in the southern part, as well as tables and many benches along the park. It is surrounded by buildings of 10 to 20 meters high and with varied colours and shapes, which are used for residential, commercial or social purposes.
2. Field data collection
2.1. Weather conditions in green areas and their surroundings
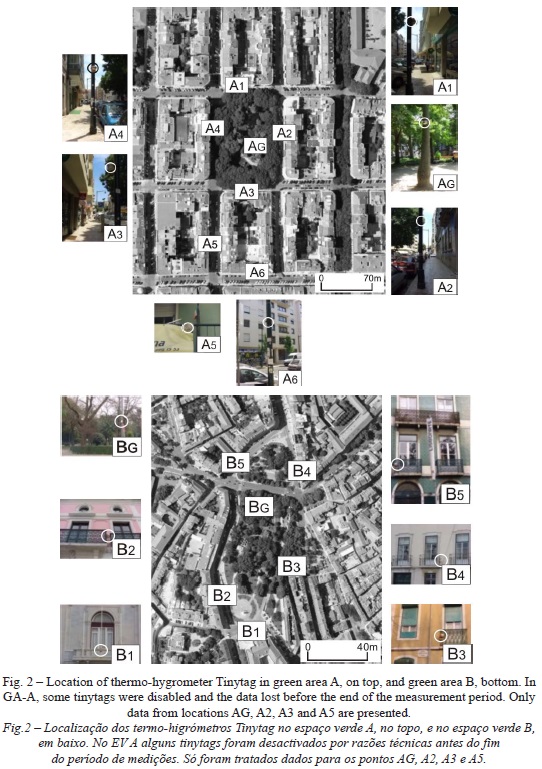
in order to characterize the seasonal weather conditions of the study area and of its surroundings, several thermo-hygrometers tinytag 433–7841 (Gemini Data-loggers, Chichester, UK), were placed on lampposts or verandas inside and around the green areas, at an approximate height of 3 m, according to the specific conditions of each green space (fig. 2). Air temperature (TA) and relative humidity (RH) were measured every 10 min for at least 30 successive days. in Green area B (GA-B), the devices were placed in winter (February 2007) and summer (July-September 2007), whereas in Green area a (GA-A) only summer measurements could be obtained (June-July 2006).
2.2. Perception of the thermal comfort by users and their preferences
In the bioclimatic functions of green spaces, the modification of all the atmospheric parameters that affect the human body energy balance should be considered: air temperature (TA), mean radiant temperature (TMRT), wind speed (V) and air humidity (Andrade, 2003; Oliveira and Andrade, 2007; Parsons, 2010). When these parameters change, green spaces can influence the thermal comfort of the green space users. The perception of bioclimatic conditions by the users and their preferences of usage within the green areas were analysed in relation to their personal characteristics and the influence of the weather conditions. To attain this purpose, itinerant measurements of the meteorological parameters that account for human comfort were performed simultaneously with face-to-face interviews, carried out with randomly selected adults passing by or sitting inside the green area. The itinerant measurements were made using testo probes: ta was measured with an NTC thermostat with an accuracy of 0.2°C, whereas wind speed (v) was measured using a thermal anemometer (warm bulb) with an accuracy of 0.3 m/s at 22°C and a time of response of 4 s. these measurements were taken every 30 seconds, at the same time as the interviews. solar (K) and infrared (L) radiation were measured every 20 minutes, using a pyranometer CM21 Kipp & Zonen and a pyrgeometer CG1 Kipp & Zonen, respectively (Kipp & Zonen, Delft, the Netherlands), following the procedure described in Oliveira and Andrade (2007).
The interview included questions in a short-answer format, related to three different matters: i) the personal characteristics; ii) the preferences and habits when using the green space; iii) the perception of the meteorological conditions and bioclimatic comfort at the moment of the interview. The selection and structure of the questions were based on previous studies (Nikolopoulou and Steemers, 2003; Stathopoulos et al., 2004; Knez and Thorsson, 2006; Oliveira and Andrade, 2007), as described below:
i) the opening section of the questionnaire survey aims to collect data on personal characteristics of the individual and is divided in two subsections. The first, collected by the interviewer, concerns various elements that can influence the person’s thermal sensations and expectations, such as exposure (sun or shade); company (alone or accompanied); type of clothing; physical characteristics (e.g. pale skin, dark skin, fat, thin); the activity before the interview (rest, read/write, talk); the position (standing, sitting or lying down) and the place (bench, grass, ground). The second subsection collects information on age, gender, place of birth, residency, permanency, education level, professional activity and smoking habits.
ii) the second part included five questions concerning the use of the green areas: the duration of the visit; motivations for the use of that particular green area; frequency of visits; travel distance (in time) from residency, transportation used and the preferences on season, weekday and time for visiting the green space.
iii) the third part of the interview was dedicated to the perception of the weather conditions and their relationship with the use of the park; the perception of the meteorological conditions was assessed through a nominal scale divided in 4 levels, applied to each of the variables monitored (air temperature, relative humidity, solar radiation and wind), and the users were asked how they were perceiving each weather parameter at the moment of the interview. Finally, the users were asked in which weather conditions they visited the park and their preferred places inside the green area under different weather conditions.
In winter time, the clothing types and the nominal scale applied for temperature were slightly changed, according to the most typical outfits and weather conditions found during these seasons in Lisbon.
2.3. Data analysis
To assess the thermal conditions in and outside the green areas, the values of temperature measured at several locations inside and around the green areas were compared, for both seasons, by calculating the temperature difference between the green area (AG or BG locations in fig. 2) and each of the other measurement spots.
The data obtained from the interviews and the itinerant measurements during field work were analysed considering two different approaches:
– the possibility of a relationship between the perception of the weather parameters by the interviewees and the measured values of each variable;
– the possibility of a relationship between the personal characteristics of the interviewees and the preferences of use of the green areas.
The nominal scale used for the perception of the weather parameters in the interview was transformed in a 4-point scale (1 meaning lower perceived temperature, humidity, radiation and wind, increasing until level 4). This was considered as an actual perception vote (APV), which was analysed in relation to the measured values of each variable with the Pearson correlation. The variables concerning personal characteristics (section I of the interview) and the preferences of use (section II) were analysed with the v Cramer test, a measure based on the chi-square test which shows the strength of association between nominal variables.
III. RESULTS AND DISCUSSION
1. Weather conditions of the green areas and their surroundings
In summer time, thermal differences were found, in both study areas, between the locations closer to the green area and the other locations. Figure 3 shows the frequency of the differences from 0 and 3ºC, between the green area and each of the surrounding locations.
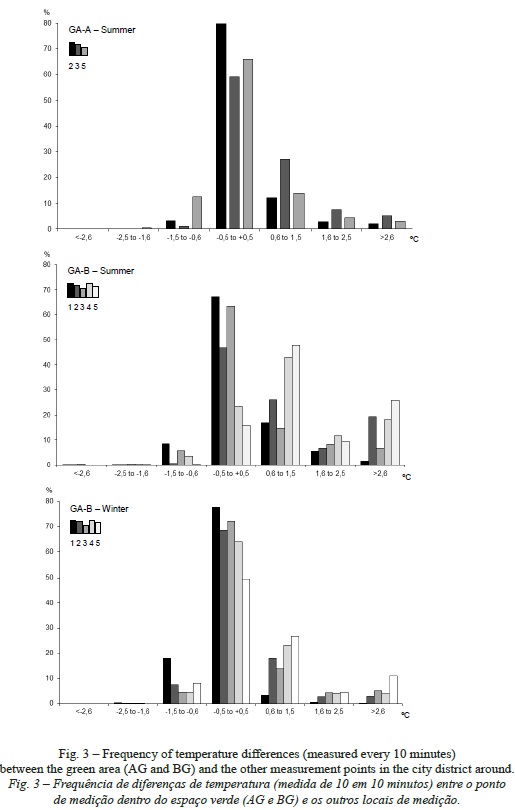
In GA-A, 1% of all the measurements (50 successive days, every 10 minutes) showed differences in temperatures above 3ºC between location AG, inside the green area, and location a2 on the east of the park; this value increased to 2.6% for location A3 (south edge of the park) and to 1.6% for location a5 (further away of the green area, in the southwest). These differences, measured at the various locations, occurred on different days suggesting the influence of the urban morphology, besides the general weather conditions, on the thermal behaviour recorded in the different measurement spots.
In GA-B (54 days of measurements), we found similar trends with more evident differences; in location B5, on the northwest side of the green area, 24% of the measurements were above 3ºC in relation to the location inside the park, 16% for location B2 (southeast of the park) and 15% for location 4 (northeast side). In two particularly hot days in which temperatures reached 40ºC in the afternoon, the differences were above 10ºC between these locations and the one inside the green area.
In winter time (20 successive days), location B5 showed 9% of measurements with differences above 3ºC in relation to the green area, whereas for all the other locations this proportion was much lower. On the contrary, there was a higher proportion of records showing the green area slightly warmer than the other locations, particularly in relation to location 1 (59%) and location 2 (26%), although the differences were generally below 2ºC.
These results suggest that green areas have a marked cooling effect in hotter conditions. This cooling effect can extend to the surrounding areas, depending on the urban geometry, the characteristics of the green area and the general weather conditions (Cohen et al., 2012; Hamada et al., 2013). Oliveira et al. (2011) found that on particularly hot days in Lisbon, the differences in temperature between GA-A (cooler) and other spots located up to 300 m south of the park were significant, varying as a function of sun exposure, street orientation and wind speed. The lower differences between the various locations in the nearest surroundings of GA-A, in relation to GA-B, can be due to the urban geometry and consequent sun exposure, as green area a is smaller and it is surrounded by tall buildings on all sides increasing the number of hours of shade that affected the thermo-hygrometers outside the green area.
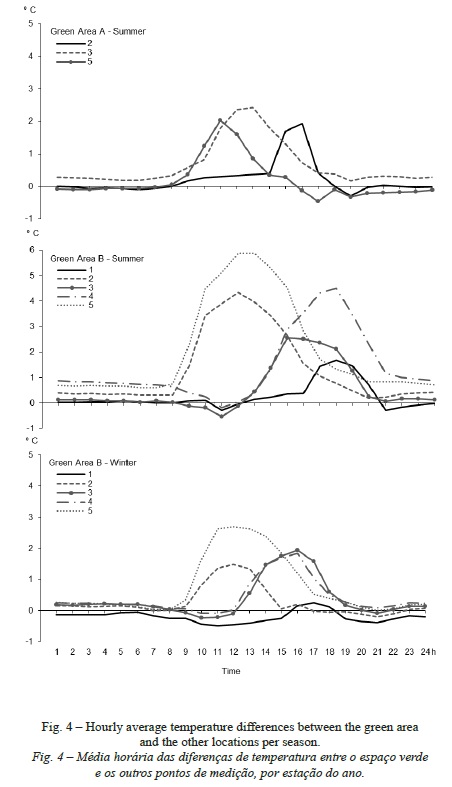
The differences in temperature between locations varied with the time of the day; figure 4 shows that the major differences were verified between 10 am and 4 pm, indicating that the cooling effect of green areas is more evident in hotter conditions (Oliveira et al., 2011; Cohen et al., 2012). GA-A showed lower differences in summer in relation to GA-B, with the maximum average difference of 2.5ºC for location a3 and of 6ºC in location B5. seasonal variations were also verified, with the differences between GA-B and the other locations decreasing in winter, reaching a maximum of 2.5ºC in location B5, whereas location 1 showed, in general, lower temperatures than the green area. These results are consistent with the study by Hamada and Ohta (2010) in Japan, since they also found that the temperature difference between the green area and the surroundings was larger in summer than in winter and more evident during the day.
2. Perception of the weather conditions by users and their preferences
2.1. Weather conditions in the green areas during the field work days
In summer, GA-A, location 2 on the east side of the green area, showed higher values of maximum temperature than the other locations. in the hottest day of field work, maximum temperatures surpassed 34ºC in location 2, over 3ºC above the values of the other locations. Locations B2 and B5 had, on average, the highest temperature that reached 40ºC, whereas in the green area temperatures were up to 6ºC lower than in those locations.
In winter, the differences in temperature between locations were much less evident, with location 1 showing similar values to the green area.
2.2. Characteristics of the interviewees
Sixty six people were interviewed in GA-A and 43 in GA-B in summer, whereas in winter 41 people were interviewed in GA-B only. The results of the interviews are summarized in table I, thus only a brief description of the most important parameters is provided here.
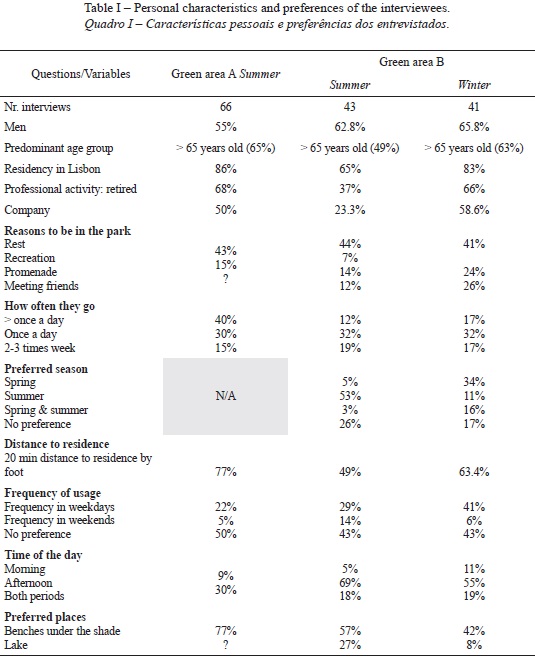
In summer, both green areas were frequented mostly by elderly people above 65 years of age, although this proportion was higher for GA-A (65% as opposed to 49%). The majority were men and above 80% of all interviewees lived in the Lisbon area; this value decreased in summer time for GA-B, meaning that a higher number of non-locals used this park. It was also found that many people go to this park alone in summer, whereas the majority of people go to the GA-A accompanied both in summer and in winter.
These differences are most likely due to the diverse features of these green areas and their location; GA-A is much smaller and it is located in a very densely urbanised area, mainly residential and commercial. Green area B is larger and has more amenities, as well as cultural and educational facilities, thus the type of population that frequents the area, and their interests, also differ. The recreation conditions and facilities provided influence the choice of users (Cianga and Popescu, 2013).
The preferred time of the day for the majority of users is the afternoon. This choice is relevant in what concerns the perception of weather conditions and the potential benefits of green areas. As the highest temperatures of a day occur during the afternoon and since the cooling effect of the green areas is more evident under hot conditions (Oliveira et al., 2011; Cohen et al., 2012), parks are mainly frequented in the afternoon when thermal comfort of people is increased there. This phenomenon should be divulged so that park users can take full advantage of a maximum cooling effect. as expected, the majority of users in summer declared preferring the benches under the shade in both green areas (77% in green area a and 57% in green area B), a proportion that decreases in winter (42%). these results show that the preferences of use of the green areas vary also according to the season, to accommodate changes in weather conditions. Other authors have pointed out the importance of behavioural adjustments to cope with weather conditions and increase an individual’s bioclimatic comfort (Thorsson et al., 2004; Lin et al., 2010, 2012). in green area B, 18% of the people in winter and 14% in summer said they go to the parks under every meteorological situation, but the time of permanency varies, the activity performed changes (when it is cold they walk instead of sitting) and the places chosen to spend the time are altered (outdoors and under the shade with sunny, hot weather; inside the restaurant when it rains and in the sun when it is cold).
2.3. Perception of the weather parameters
A significant correlation was found between Actual Perception Vote (APV) for temperature and the values of ta, as measured by the Pearson correlation coefficient (r=0.66, p<0.01) and between APV for humidity and the values of HR (r=0.33, p<0.01) for the summer data. Winter data didn’t show any significant relation with APV. There was no significant correlation between APV for wind and the measured values of wind speed. The stronger correlation found for temperature may indicate that people associate their general thermal feeling to temperature, although it integrates the influence of several parameters, as people are not able to perceive isolated parameters (Parsons 1993; Andrade et al., 2011).
2.4. Personal characteristics and preferences of use of the green areas
The individual characteristics of people and their expectations influence their use of the green areas (Lin et al., 2012). Significant relationships between specific pairs of variables that represent personal features were found, as shown in table II.
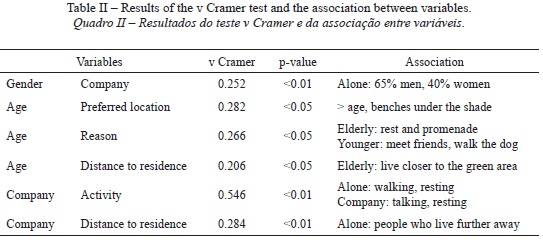
The effect of company (if the person is alone or not) showed interesting results; the highest value was found between the company and the activity being performed, followed by the relationship between company and distance to the residence, with people alone coming from further away. Gender is also related to company, with men being found alone more often than women in the urban green areas.
Although significant, the value of the association between the variables is rather weak, probably due to the complexity of the parameters analysed; further investigation on this issue, which is outside the scope of this study, is required. Nevertheless, it is important to consider the relationships between personal characteristics and the usage of green areas, as this will also influence the role green areas can play in the improvement of the urban environment.
IV. CONCLUSIONS
Urban green areas are important assets in cities, contributing to improve the urban environment, providing leisure opportunities and social contact between people, among other benefits. Small green areas (“neighbourhood” type) are common in Lisbon, where Mediterranean climate prevails, and are mainly used by elderly people during the afternoon in summertime. The use of these green spaces and their benefits also depend on the individual characteristics of the users.
In this study, temperature differences were found between the green areas and the other measurement locations. The green area is in general cooler. these differences were clearer in summer than in winter and between 10 am and 4 pm, ranging overall from 2 to 6ºC difference, depending on the location where the measurement was done.
The actual Perception Vote revealed only significant correlation with temperature and humidity in summer measurements.
It was also found that the personal characteristics of people influence the use of the green areas. Men are more often found alone than women. Elderly people show a preference for benches in the shade and they come from a closer location. The use of green spaces also changed with the season, concerning the time of permanency, the activity performed and the preferred location inside the garden.
In cities with a Mediterranean climate, like Lisbon, the existence of small green areas can have a positive contribution to different aspects of the city ’s environment, as confirmed by the results of this study:
a) Provide “cool islands” within the dense urban fabric, improving thermal comfort in the green area and the nearest surroundings; both green areas showed thermal differences between the locations within and outside the park, depending on the distance, the configuration of the green area and the prevailing weather conditions; b) Mitigate the potential effects of climate change, expected to cause higher frequency and intensity of heat waves, since the cooling effect of green areas is more evident in hotter conditions; in winter time, the thermal differences between the parks and the surroundings were less evident and the majority of the users preferred to visit the park in summer; c) improve the urban environment by reducing noise and pollution levels; the users of both green areas mentioned the opportunity for relaxation and resting as reasons for their use; d) Provide opportunities for social contact among local people and with tourists; e) Diversify the touristic offer within the city, which can attract more people with different interests, thus having positive effects in the social and economic dynamics of the urban area.
The influence of green areas in the weather parameters, confirmed by a cooling effect that is particularly strong in hotter conditions, is a relevant benefit for the users of these spaces and the surrounding areas. As the microclimatic influence of green areas may extend beyond the park, green areas also contribute to regulate thermal comfort and mitigate potential impacts of climate change in the overall urban area.
The availability and type of green areas is a relevant criterion for tourism activities in urban areas. The knowledge of the preferences of usage and their relationship with personal characteristics and weather perception is an important tool to design green areas suitable to local people and attractive to other visitors.
ACKNOWLEDGMENTS
This study was carried out in the framework of the UrbKlim project (POCI/GEO/61148/2004 – funded by the Operational Programme for science and innovation 2010 and by FCT). We would like to thank Prof. Maria João Alcoforado for her support throughout the development of this research and for encouraging the production of this paper and the anonymous referees for their comments that have contributed to improve the manuscript. Finally, we are extremely grateful to the late Prof. Henrique Andrade, for his unpaired dedication, outstanding scientific skills and his great inspirational work.
BIBLIOGRAPHY
Akbari H (2002) Shade trees reduce building energy use and CO2 emissions from power plants. Environmental Pollution, 116: S119–S126. [ Links ]
Alcoforado M J (1993) O clima da região de Lisboa: contrastes e ritmos térmicos . Memórias do Centro de Estudos Geográficos, 15, Lisboa. [ Links ]
Alcoforado M J, Andrade H (2008) Global Warming and the Urban Heat Island. In: Marzluff JM, Shulenberger E, Endlicher W, Alberti M, Bradley G, Ryan C, et al. (eds) Urban Ecology, Springer, pp 249 –262.
Alcoforado M J, Andrade H (2006) Nocturnal urban heat island in Lisbon (Portugal): main features and modelling attempts. Theoretical and Applied Climatology, 84(1-3): 151–159. [ Links ]
Alcoforado M-J, Andrade H, Lopes A, Vasconcelos J (2009) Application of climatic guidelines to urban planning: the example of Lisbon (Portugal). Landscape and Urban Planning, 90(1): 56 – [ Links ]65.
Alcoforado M J, Andrade H, Lopes A, Vasconcelos J, Vieira R (2006) Observational studies on summer winds in Lisbon (Portugal) and their influence on daytime regional and urban thermal patterns. Merhavim, 6: 88–112. [ Links ]
Andrade H (2003) Bioclima humano e temperatura do ar em Lisboa. PhD Thesis, University of Lisbon.
Andrade H, Alcoforado M-J, Oliveira S (2011) Perception of temperature and wind by users of public outdoor spaces: relationships with weather parameters and personal characteristics. International Journal of Biometeorology, 55(5): 665–680. [ Links ]
Andrade H, Oliveira S, Alcoforado M-J (2006) A first assessment of the outdoor climatic confort in Lisbon. In: Proceedings of the 3rd International Conference on Urban Ecology, Shrinking Cities: Ecological Consequences and Challenges for Urban Development. Berlin, Germany, 15-16 September.
Çalişkan O, Matzarakis A (2013) The Climate and Bioclimate of Nevşehir from the Perspective of Tourism. In: Advances in Meteorology, Climatology and Atmospheric Physics, Springer, pp 397–402.
Choi H-A, Lee W-K, Byun W-H (2012) Determining the Effect of Green Spaces on Urban Heat Distribution Using Satellite Imagery. Asian Journal of Atmospheric Environment, 6: 127-135. [ Links ]
Cianga N, Popescu A (2013) Green Spaces and Urban Tourism Deveopment in Craiova Municipality in Romania. European. Journal of Geography,. 4(2): 34–45. [ Links ]
Cohen P, Potchter O, Matzarakis A (2012) Daily and seasonal climatic conditions of green urban open spaces in the Mediterranean climate and their impact on human comfort. Building and Environment, 51: 285–295. [ Links ]
Dimoudi A, Nikolopoulou M (2003) Vegetation in the urban environment : microclimatic analysis and benefits, Energy and Buildings, 35: 69–76. [ Links ]
Endler C, Matzarakis A (2011) Climate and tourism in the Black Forest during the warm season. International Journal of Biometeorology, 55(2): 173– 86. [ Links ]
Fang C-F, Ling D-L (2005) Guidance for noise reduction provided by tree belts. Landscape and Urban Planning, 71(1): 29–34. [ Links ]
de Freitas C R (2003) Tourism climatology: evaluating environmental information for decision making and business planning in the recreation and tourism sector. International Journal of Biometeorology, 48(1): 45–54. [ Links ]
Gago E J, Roldan J, Pacheco-Torres R, Ordóñez J (2013) The city and urban heat islands: A review of strategies to mitigate adverse effects. Renewable & Sustainable Energy Review, 25: 749–758. [ Links ]
Georgi J N, Dimitriou D (2010) The contribution of urban green spaces to the improvement of environment in cities: Case study of Chania, Greece. Building and Environment, 45(6): 1401–1414. [ Links ]
Georgi N J, Zafiriadis K (2006) The impact of park trees on microclimate in urban areas. Urban Ecosystems, 9(3): 195–209. [ Links ]
Gómez Martín M B (2005) Weather, climate and tourism a geographical perspective. Annals ofTourism Research, 32(3): 571–591. [ Links ]
Hamada S, Ohta T (2010) Seasonal variations in the cooling effect of urban green areas on surrounding urban areas. Urban Forestry & Urban Greening, 9(1): 15–24. [ Links ]
Hamada S, Tanaka T, Ohta T (2013) Impacts of land use and topography on the cooling effect of green areas on surrounding urban areas. Urban Forestry & Urban Greening, 12(4): 426–434. [ Links ]
Haq S M A (2011) Urban Green Spaces and an Integrative Approach to Sustainable Environment. Journal of Environmental Protection, . 02(05): 601–608. [ Links ]
Home R, Hunziker M, Bauer N (2012) Psychosocial Outcomes as Motivations for Visiting Nearby Urban Green Spaces. Leisure Sciences, 34(4): 350–365. [ Links ]
INE - Instituto Nacional de Estatística (2011) Censos 2011.
Jauregui E (1990) Influence of a large urban park on temperature and convective precipitation in a tropical city. Energy and Buildings, 15(3): 457–463. [ Links ]
Kaján E, Saarinen J (2013) Tourism, climate change and adaptation: a review. Current Issues in Tourism, 16(2): 167–195. [ Links ]
Knez I, Thorsson S (2006) Influences of culture and environmental attitude on thermal, emotional and perceptual evaluations of a public square. International Journal of Biometeorology, 50(5): 258–68. [ Links ]
Lafortezza R, Carrus G, Sanesi G, Davies C (2009) Benefits and well-being perceived by people visiting green spaces in periods of heat stress. Urban Forestry and Urban Greening, 8(2): 97–108. [ Links ]
Lin T-P, Matzarakis A, Hwang R-L (2010) Shading effect on long-term outdoor thermal comfort. Building and Environment, 45(1): 213–221. [ Links ]
Lin T-P, Tsai K-T, Hwang R-L, Matzarakis A (2012) Quantification of the effect of thermal indices and sky view factor on park attendance. Landscape and Urban Planning, 107(2): 137–146. [ Links ]
Lin W, Wu T, Zhang C, Yu T (2011) Carbon savings resulting from the cooling effect of green areas: a case study in Beijing. Environmental Pollution, 159(8-9): 2148–54. [ Links ]
Lopes A, Alves E, Alcoforado M J, Machete R (2013) Lisbon Urban Heat Island Updated : New Highlights about the Relationships between Thermal Patterns and Wind Regimes. Advances in Meteorology 2013, Article ID 487695, 11 p.
Matzarakis A (2001) Assessing climate for tourism purposes: Existing methods and tools for the thermal complex. Proceedings of the First International Workshopon Climate, Tourism and Recreation. Greece: 101-112. [ Links ]
Matzarakis A, Rammelberg J, Junk J (2013) Assessment of thermal bioclimate and tourism climate potential for central Europe—the example of Luxembourg. Theoretical and Applied Climatology, 114(1-2): 193–202. [ Links ]
Nardo F Di, Saulle R, Torre G La (2010) Green areas and health outcomes : a systematic review of the scientific literature. Italian Journal of Public Health, 7(4): 402-413. [ Links ]
Nicholls N, Butler C D, Hanigan I (2006) Inter-annual rainfall variations and suicide in New South Wales, Australia, 1964-2001. International Journal of Biometeorology, 50(3): 139–43. [ Links ]
Nikolopoulou M, Steemers K (2003) Thermal comfort and psychological adaptation as a guide for designing urban spaces. Energy and Buildings, 35(1): 95–101. [ Links ]
Oliveira S, Andrade H (2007) An initial assessment of the bioclimatic comfort in an outdoor public space in Lisbon. International Journal of Biometeorology, 52(1): 69–84. [ Links ]
Oliveira S, Andrade H, Vaz T (2011) The cooling effect of green spaces as a contribution to the mitigation of urban heat: A case study in Lisbon. Building and Environment,. 46(11): 2186–2194. [ Links ]
Parés-Franzi M, Saur í-Pujol D, Domene E (2006) Evaluating the environmental performance of urban parks in Mediterranean cities: an example from the Barcelona metropolitan region. Environmental Management, 38(5): 750–9. [ Links ]
Parry M L (2007) Climate Change 2007: Impacts, Adaptation and Vulnerability: Working Group II Contribution to the Fourth Assessment Report of the IPCC Intergovernmental Panel on Climate Change. Cambridge University Press. [ Links ]
Parsons K (1993) Human thermal environments. Taylor & Francis, London [ Links ]
Parsons K (2010) Human thermal environments: the effects of hot, moderate, and cold environments on human health, comfort and performance. CRC Press. [ Links ]
Patz J A, Campbell-Lendrum D, Holloway T, Foley J A (2005) Impact of regional climate change on human health. Nature, 438(7066): 310–317. [ Links ]
Santos F D, Miranda P (2006) Alterações climáticas em Portugal. Cená rios, Impactos e Medidas de Adaptação (Climate change in Portugal. Scenarios, Impacts and Adaptation Measures). Gradiva, Lisbon. [ Links ]
Schilling J (2010) Towards a Greener Green Space Planning. Urban green space planning in Lisbon (Portugal). MSc thesis. Lund University, Sweden. [ Links ]
Scott D, de Freitas C, Matzarakis A (2009) Adaptation in the tourism and recreation sector. In: Biometeorology for adaptation to climate variability and change, Springer, pp 171–194.
Shimoda Y (2003) Adaptation measures for climate change and the urban heat island in Japan’s built environment. Building Research & Information, 31(3-4): 222–230. [ Links ]
Soares A L (2006) The value of the trees, Trees and urban forest in Lisbon (in Portuguese). Ph.D thesis, Institute of Agronomy, Technical University of Lisbon. [ Links ]
Soares A L, Castel-Branco C (2007) As árvores da cidade de Lisboa. In: Silva JS [Coord. Ed.]. Floresta e Sociedade – Uma história em comum. p. 289-334. Vol. VII dea Sande Silva [Coord. Ed.] Colecçã o árvores e Florestas de Portugal. Jornal Público/ Fundação Luso-Americana para o Desenvolvimento/ Liga para a Protec ção da Natureza, Lisboa.
Stathopoulos T, Wu H, Zacharias J (2004) Outdoor human comfort in an urban climate. Building and Environment, 39(3): 297–305. [ Links ]
Thorsson S, Lindqvist M, Lindqvist S (2004) Thermal bioclimatic conditions and patterns of behaviour in an urban park in Göteborg, Sweden. International Journal of Biometeorology, 48(3): 149–156. [ Links ]
Upmanis H, Eliasson I, Andersson-Sköld Y (2001) Case studies of the spatial variation of benzene and toluene concentrations in parks and adjacent built-up areas. Water, Air, & Soil Pollution, 129(1-4): 61–81. [ Links ]
Vasconcelos J, Lopes A (2006) Recent urban development trends and its implication on the estuarine breezes in Lisbon, Portugal. Proceedings of the 6th International Conference on Urban Climate, Göteborg: 466–469.
Wilby R L, Perry G L W (2006) Climate change, biodiversity and the urban environment: a critical review based on London, UK. Progress in Physical Geography, 30(1): 73–98. [ Links ]
Yu C, Hien W N (2006) Thermal benefits of city parks. Energy and Buildings, 38(2): 105–120. [ Links ]
Zarrili L, Brito M (2013) Lisbon experience. Mobility, quality of life and tourist image: a survey. GeoJournal of Tourism and Geosites, 2(12): 203-213. [ Links ]
Zoulia I, Santamouris M, Dimoudi a (2009) Monitoring the effect of urban green areas on the heat island in Athens. Environmental Monitoring and Assessment, 156(1-4): 275–92. [ Links ]
Received: March 2014. Accepted: September 2014

